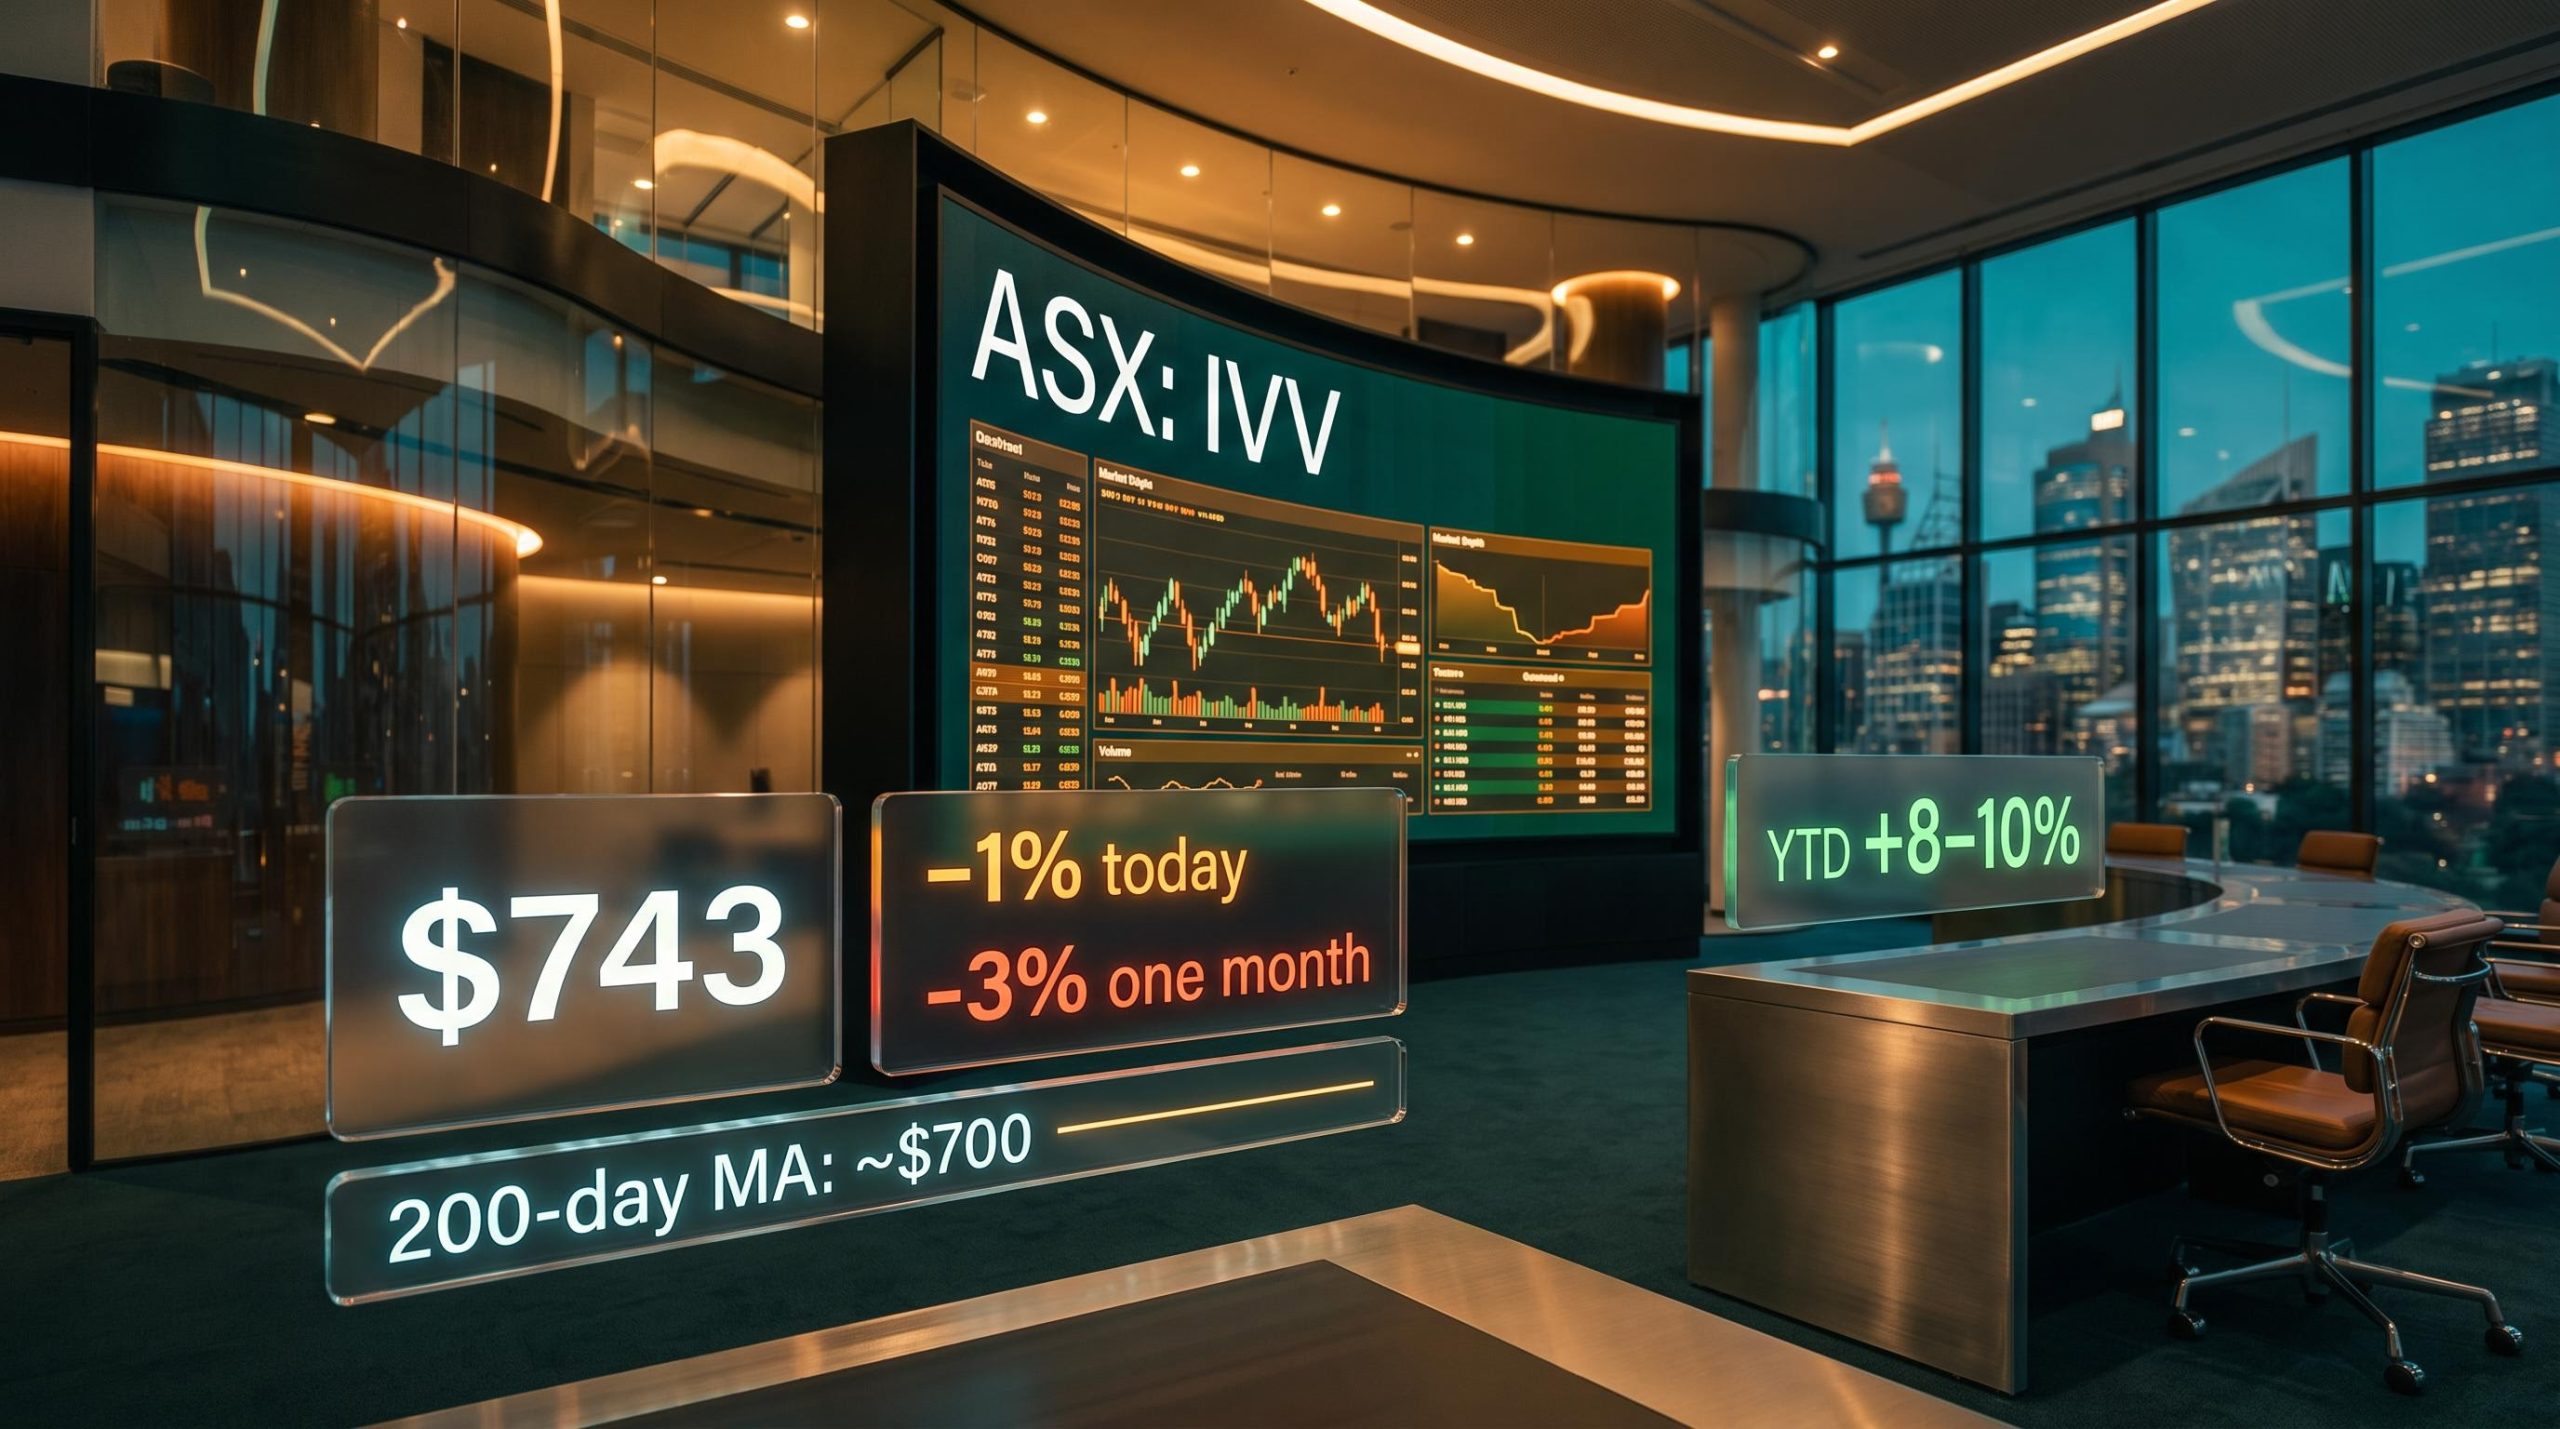
IVV has shed roughly 1% across today’s session and sits about 3% below where it stood a month ago. For Australian investors watching the price tick lower, the question is immediate: does this make it cheaper in a meaningful sense, or just cheaper on a screen?
The iShares S&P 500 ETF (ASX: IVV) remains one of the most widely held US equity instruments among Australian retail investors. Its current pullback sits against a backdrop of 8-10% year-to-date gains in 2026 and roughly 17-22% over the past 12 months. Separating the structural case for the fund from the near-term price signal is what determines whether this moment warrants action or patience.
Here is a clear framework for deciding whether current IVV pricing justifies a move, what the dip does and does not change about the fund’s investment case, and how to think about entry sizing if you decide to act.
What the recent price move actually tells you
When the fund posts a one-day loss of around 1% and trails its month-ago level by roughly 3%, those numbers invite a reaction. But those figures need context. IVV’s average daily volatility, measured by average true range, runs at 1-1.5%. A single 1% session is meaningful but sits within the fund’s normal range of movement, not outside it.
IVV’s decade return record was built through multiple periods of comparable volatility, including several stretches where the fund sat meaningfully above its long-run moving averages before consolidating, which is precisely the pattern the current setup resembles.
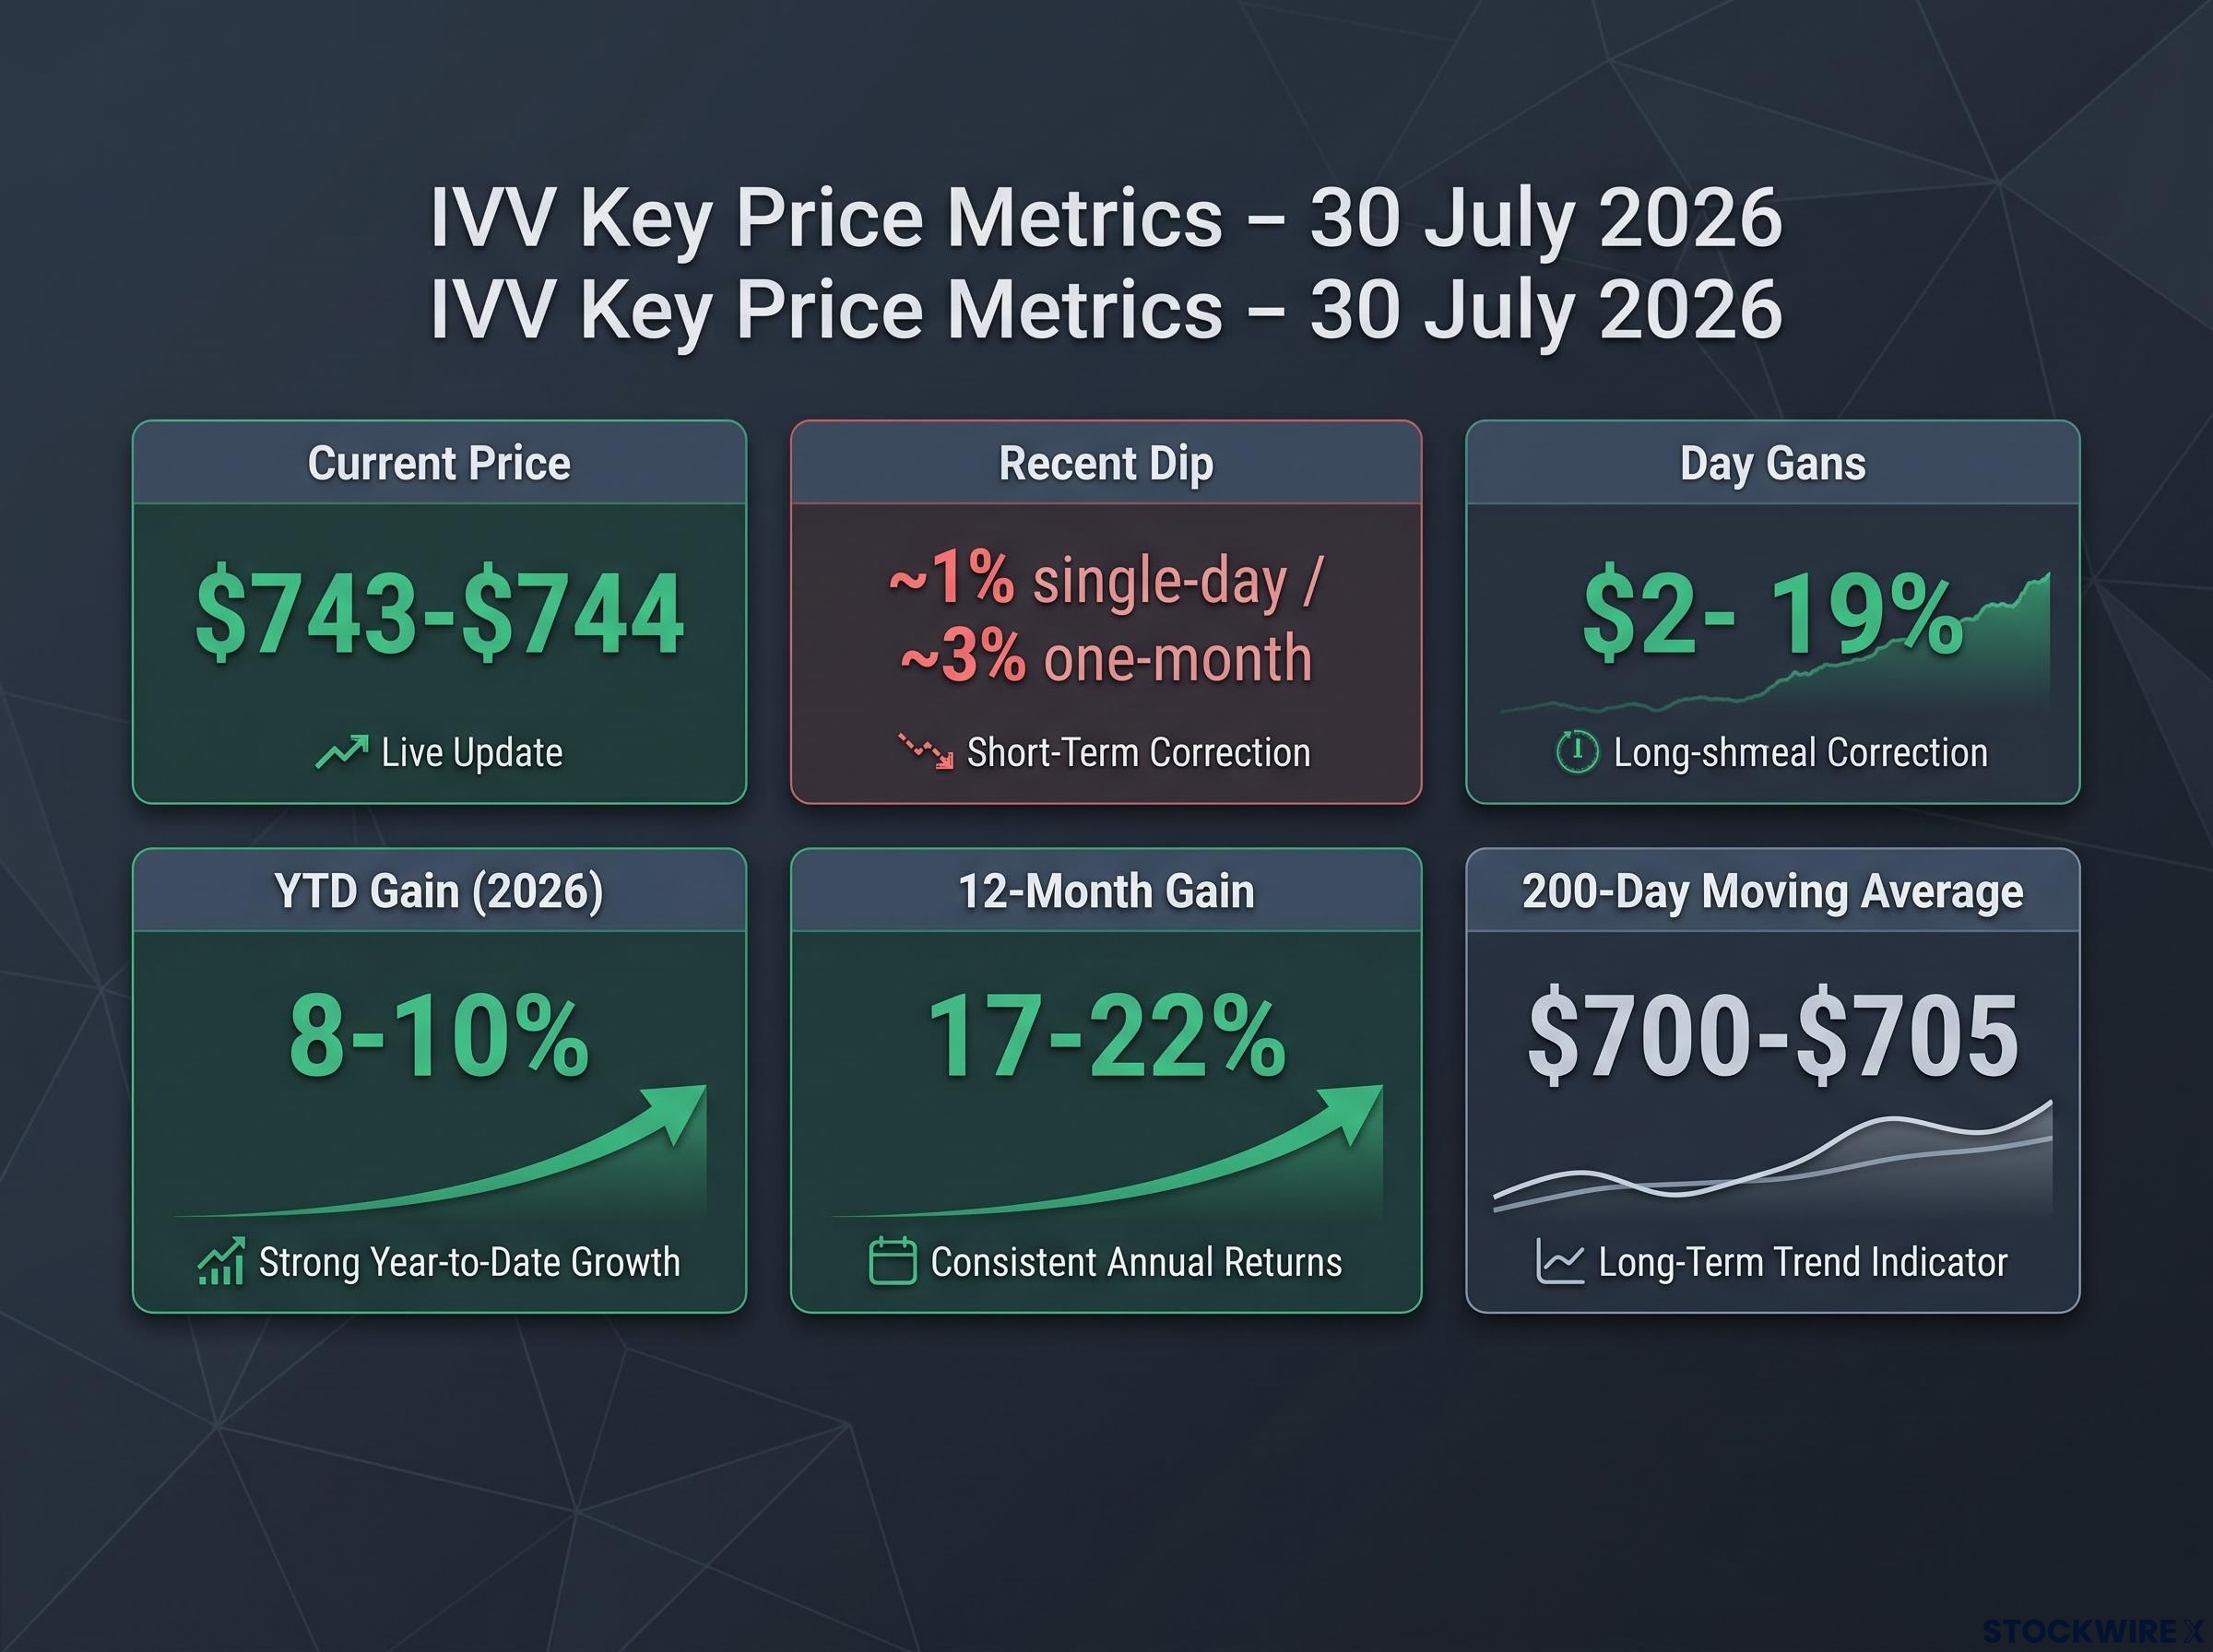
Here are the key price metrics as of 30 July 2026:
- Current price: Mid-$740s (approximately $743-$744)
- Single-day decline: Approximately 1%
- One-month decline: Approximately 3% (broader data suggests 1-2% from late-May levels, depending on the measurement window)
- Year-to-date gain (2026): Approximately 8-10%
- 12-month gain: Approximately 17-22%
- 200-day moving average: Approximately $700-$705
IVV is currently trading approximately 13-14% above its 200-day moving average. The primary uptrend is not just intact; it is not even close to being tested.
That distance between the current price and the 200-day average tells you the correction is friction after a strong rally, not a change in direction. The fund sits roughly 2% below its 20-day average, which is where short-term softness shows up. But the long-term trend line is well below, confirming that nothing structural has broken. If you were comfortable owning IVV two weeks ago, the technical picture has not given you a reason to change your mind.
When big ASX news breaks, our subscribers know first
Why IVV’s structural advantages are unaffected by short-term price movements
The dip changed the price. It changed nothing about the instrument itself. The features that make IVV one of the most efficient ways to access US equities are permanent, and they matter more to your long-term returns than any short-term entry point.
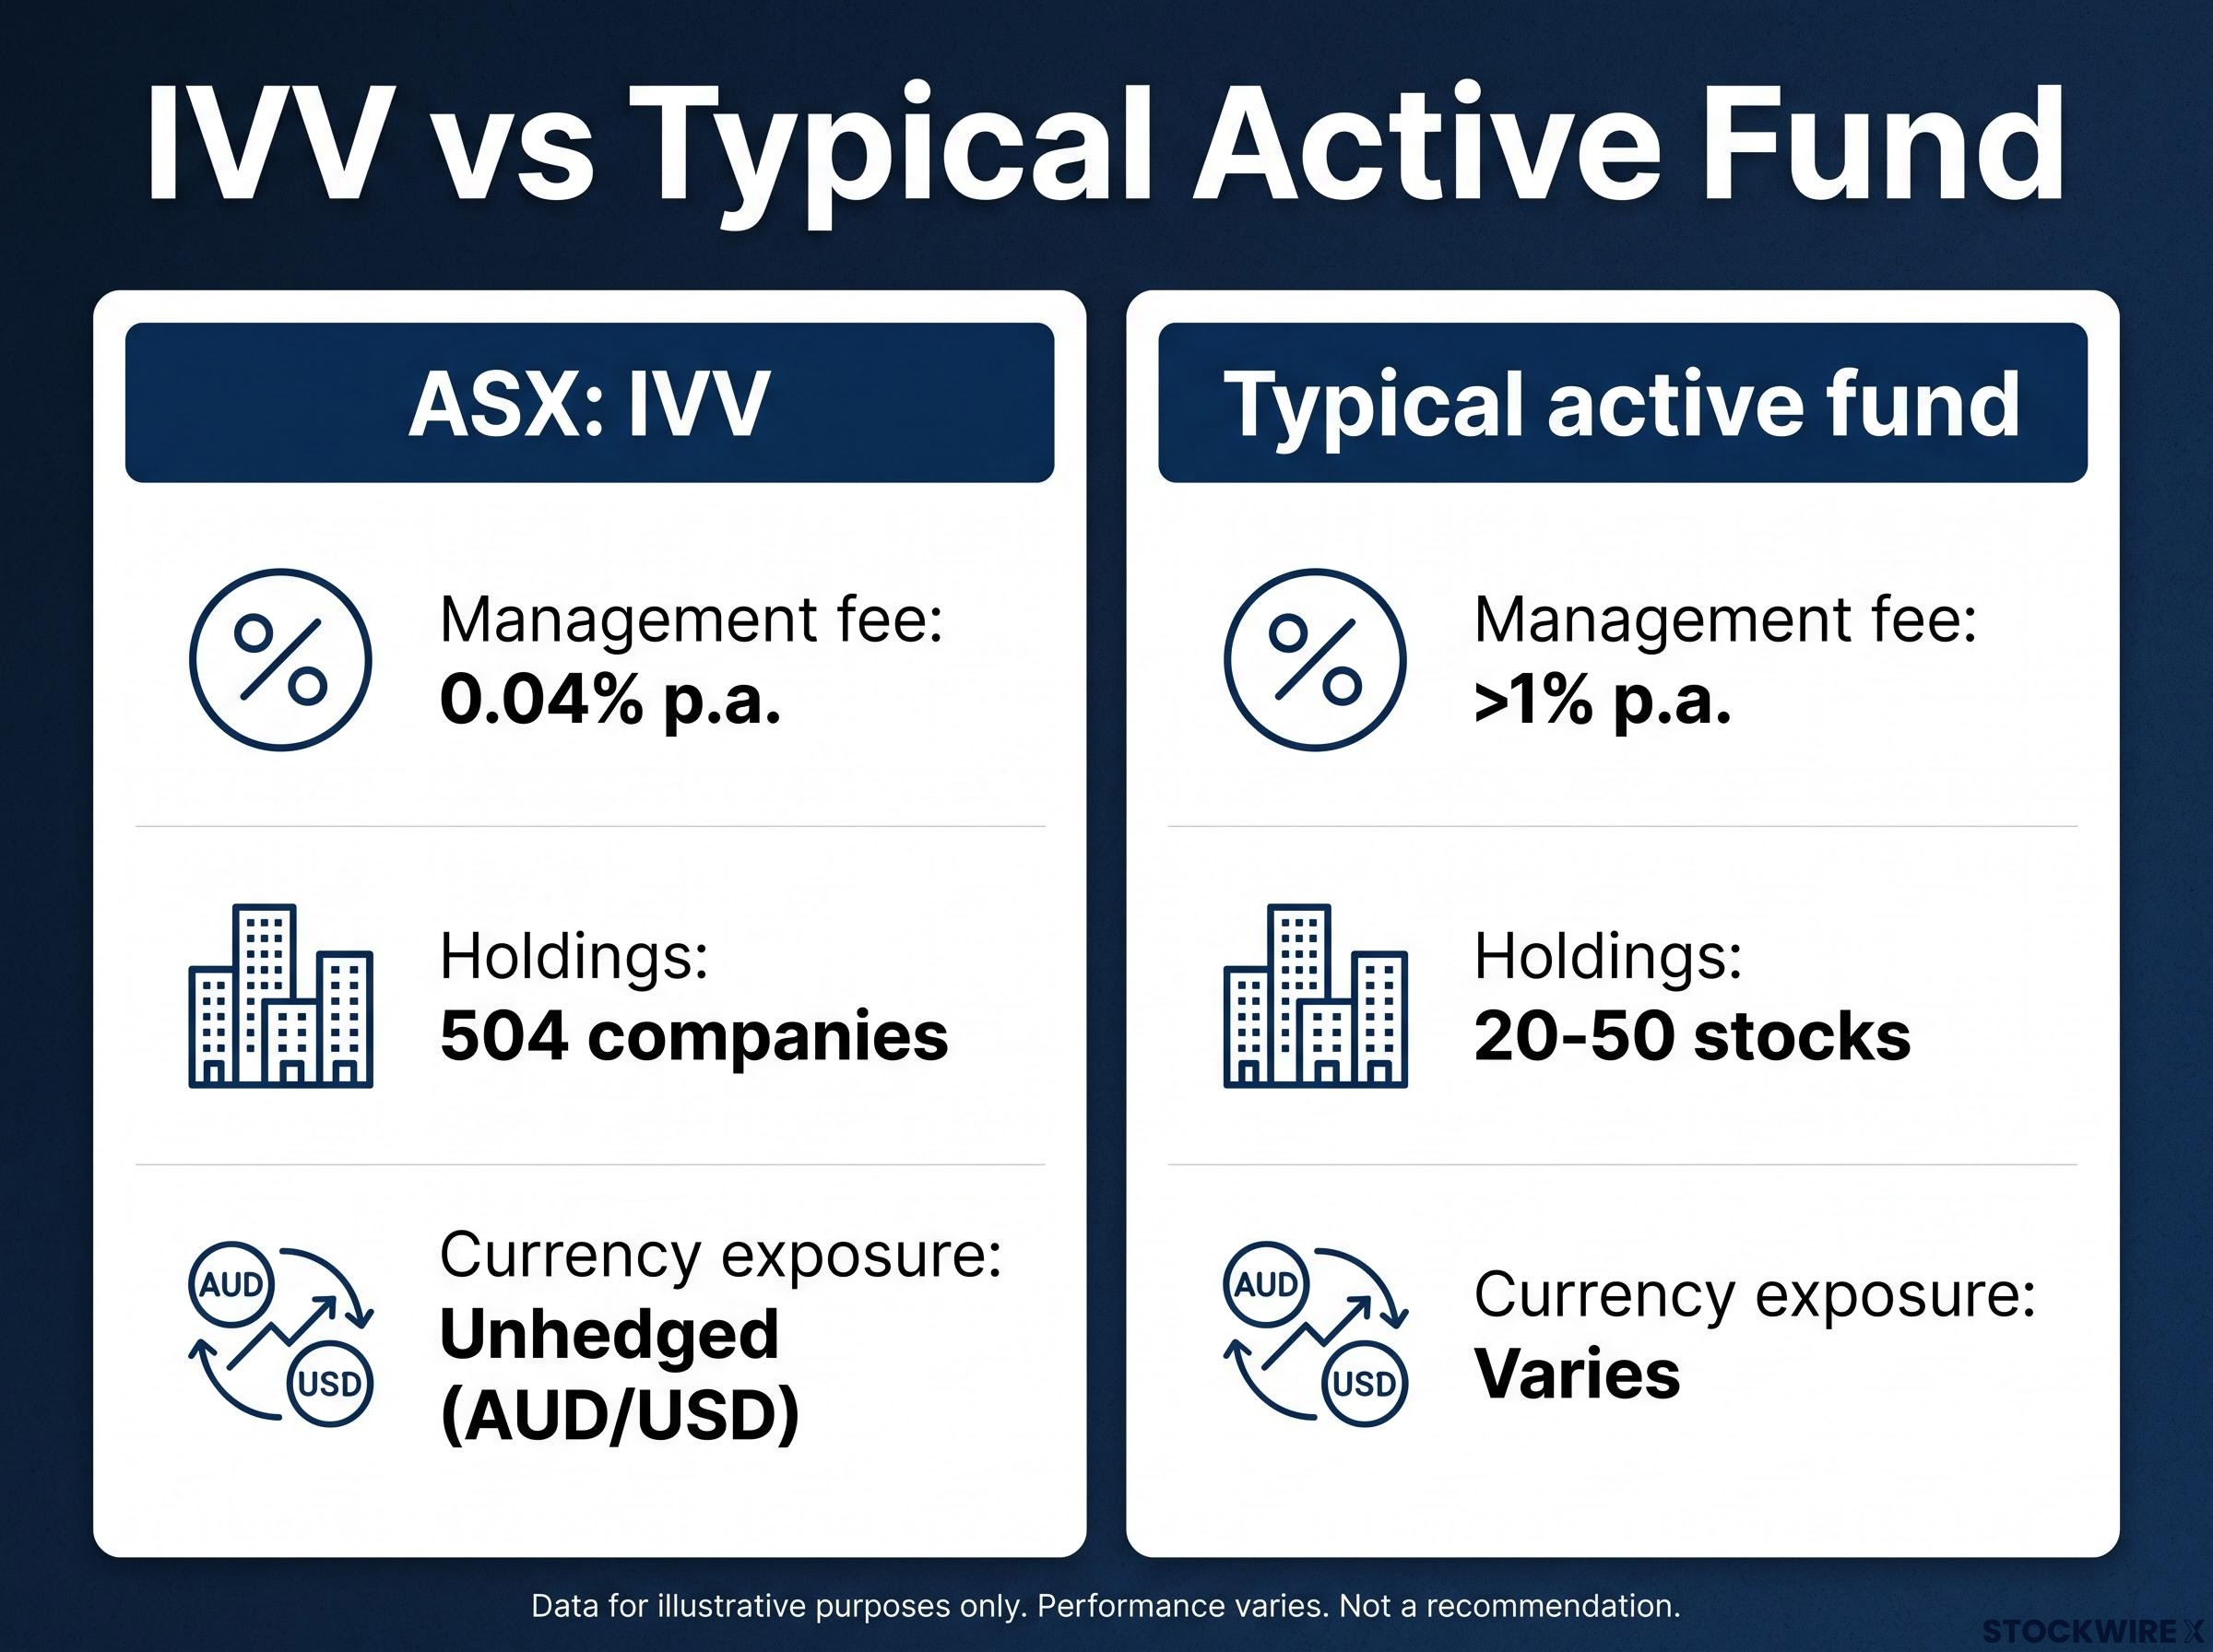
| Attribute | IVV | Typical active fund | Long-term impact |
|---|---|---|---|
| Management fee | 0.04% p.a. | Often exceeds 1% p.a. | Over 20 years, the fee difference compounds into tens of thousands of dollars retained |
| Holdings | 504 companies (S&P 500 index) | Typically 20-50 stocks | Rules-based rebalancing adds outperformers, removes underperformers automatically |
| Currency exposure | Unhedged (AUD/USD) | Varies | Returns reflect both US equity performance and exchange rate movements in a single holding |
The 0.04% annual fee (some broader sources cite 0.03%; both are exceptionally low) means you keep almost the entire return the market generates. Over a 20-year horizon, that structural cost advantage is worth substantially more to your portfolio than optimising an entry point by 1-2%.
What the 36% technology weighting means in practice
Technology accounts for approximately 36% of IVV’s holdings as of late July 2026. Recent gains have been driven heavily by mega-cap technology and communication services names, reflecting AI and productivity themes that have dominated investor attention.
That concentration is a feature of where value has accumulated in the US market. It is also a risk factor. If AI-related sentiment reverses or earnings disappoint in those names, IVV’s performance will feel it disproportionately. Understanding this does not change the case for the fund; it changes how much of your portfolio should sit in it.
Reading the dip honestly: reasonable entry point, not a clearance sale
A 1-3% drawdown after 17-22% gains over 12 months is modest consolidation. It is not a deep discount, and characterising it as a sale would be misleading. The honest read requires looking at both sides of the ledger.
What the dip changes:
- Your entry price is 1-3% lower than it was at recent highs
- Your margin of safety is slightly improved relative to the prior fortnight
- A scheduled contribution landing now captures a modestly better price
What the dip does not change:
- S&P 500 aggregate valuations remain above long-run averages, particularly in mega-cap growth and AI-adjacent segments
- Currency exposure to AUD/USD movements is unchanged
- Technology concentration risk at 36% persists
- A standard equity market pullback historically averages 10% or more; this correction is well short of that
The current environment is a reasonable entry point for disciplined long-term buyers. It is not a situation where downside risk has vanished.
Elevated valuations mean you should enter with eyes open. The current price reflects optimistic earnings expectations, and those expectations are not guaranteed to be met. This is not a reason to avoid the fund. It is a reason to size your position with the awareness that further downside is entirely possible before the next leg higher.
Dollar-cost averaging as the practical answer to entry timing uncertainty
IVV’s documented daily volatility of approximately 1.3-1.4% over recent 9-20 day windows tells you something important: precise short-term timing is structurally unreliable. Attempting to find the exact bottom of a pullback adds friction and stress to a decision that a rules-based schedule handles automatically, likely with better outcomes.
Here is a practical three-step framework:
- Set a target IVV allocation as a percentage of your total portfolio (for many Australian investors targeting US equity exposure, this sits in the 20-30% range)
- Divide your intended investment into equal monthly or quarterly tranches, deploying each on a fixed schedule regardless of price
- Set a rebalancing rule for when your IVV allocation drifts beyond a defined threshold (e.g., rebalance when it exceeds or falls below your target by 5% of portfolio weight)
Dollar-cost averaging naturally acquires more units after dips and fewer after rallies. The current modest pullback is exactly the kind of environment where a scheduled contribution simply lands at a somewhat better price without requiring any active decision from you.
Lump-sum versus phased entry: what the evidence says
Historical data shows lump-sum investing tends to outperform DCA in rising markets, because capital is deployed sooner and captures more upside. However, DCA produces better behavioural outcomes by reducing the emotional impact of a sharp decline immediately after entry.
The lump-sum versus phased entry debate has a clear mathematical answer in rising markets, with lump-sum investing outperforming DCA in approximately 68% of historical scenarios, but the right choice for any individual investor turns on behavioural profile, CGT parcel management, and whether the expected upside outweighs the regret risk of a sharp drawdown immediately after deployment.
If you have a regular income stream to deploy, or if your total intended allocation is large enough that a 5-10% immediate decline would meaningfully shake your confidence in holding, phased entry is the appropriate choice. The goal is not to maximise theoretical returns. The goal is to build a position you can actually hold through volatility.
Risks specific to Australian investors that the price alone does not show
The price on your screen shows you a number. It does not show you the three structural risks that will shape your actual return from this position.
Currency risk is the most frequently overlooked factor for Australian IVV holders. Because ASX:IVV is unhedged, a strengthening Australian dollar versus the US dollar will reduce your AUD-denominated returns, even if the S&P 500 itself is rising. Your return and a US investor’s return on the same fund can diverge meaningfully over multi-year periods.
The compounding effect of AUD appreciation on unhedged ETF returns has been sharp over the past 18 months, with hedged and unhedged versions of identical international equity strategies diverging by as much as 13 percentage points over the year to mid-2026, a gap driven entirely by currency movement rather than any difference in underlying equity performance.
| Risk | Description | Practical impact | Mitigation |
|---|---|---|---|
| Currency (AUD/USD) | IVV is unhedged; AUD/USD movements directly affect returns | A stronger AUD reduces IVV’s AUD-denominated performance regardless of US market direction | Complement with AUD-denominated assets; accept currency as a long-term wash with short-term volatility |
| Concentration | 100% US equities; 36% in technology | No regional diversification; AI sentiment reversal could drive sharp drawdowns | Balance with ASX equities, other regional ETFs (Europe, Asia) |
| Valuation | S&P 500 valuations above long-run averages, especially in mega-cap growth | Less margin of safety; valuation compression possible even if earnings remain solid | Phase entries via DCA; maintain defensive allocation (bonds, cash) |
Identifying these risks does not make IVV a poor choice. It makes it an informed one. Understanding them points you toward how IVV should sit within a broader portfolio rather than whether it should be avoided.
Building IVV into a portfolio that can absorb what the US market throws at it
IVV is a core building block. It is not a complete portfolio. The distinction matters because it reframes the “should I buy now” question into the one you should actually be answering: does my overall allocation match my risk tolerance?
A well-constructed Australian investor’s portfolio might include:
- IVV as the US equity core, providing broad exposure to 504 large-cap American companies
- An ASX-focused ETF for Australian equity exposure, capturing franking credits (a material tax benefit not available through IVV) and domestic sector diversification
- A global or regional ETF covering Europe, Asia, or emerging markets to reduce single-country dependence
- A fixed income or cash allocation for portfolio stability and dry powder during drawdowns
The long-term uptrend in IVV remains intact as of 30 July 2026. The dip is modest. The structural case is unchanged. The risks are real but identifiable. The appropriate response for a long-term investor is continued disciplined accumulation according to a pre-set plan, not a reaction to a 1-3% move on a screen.
Whether IVV is priced at $743 or $762 today matters far less than whether your position sizing and complementary holdings are built to handle whatever the US market delivers next.
This article is for informational purposes only and should not be considered financial advice. Investors should conduct their own research and consult with financial professionals before making investment decisions. Past performance does not guarantee future results. Financial projections are subject to market conditions and various risk factors.