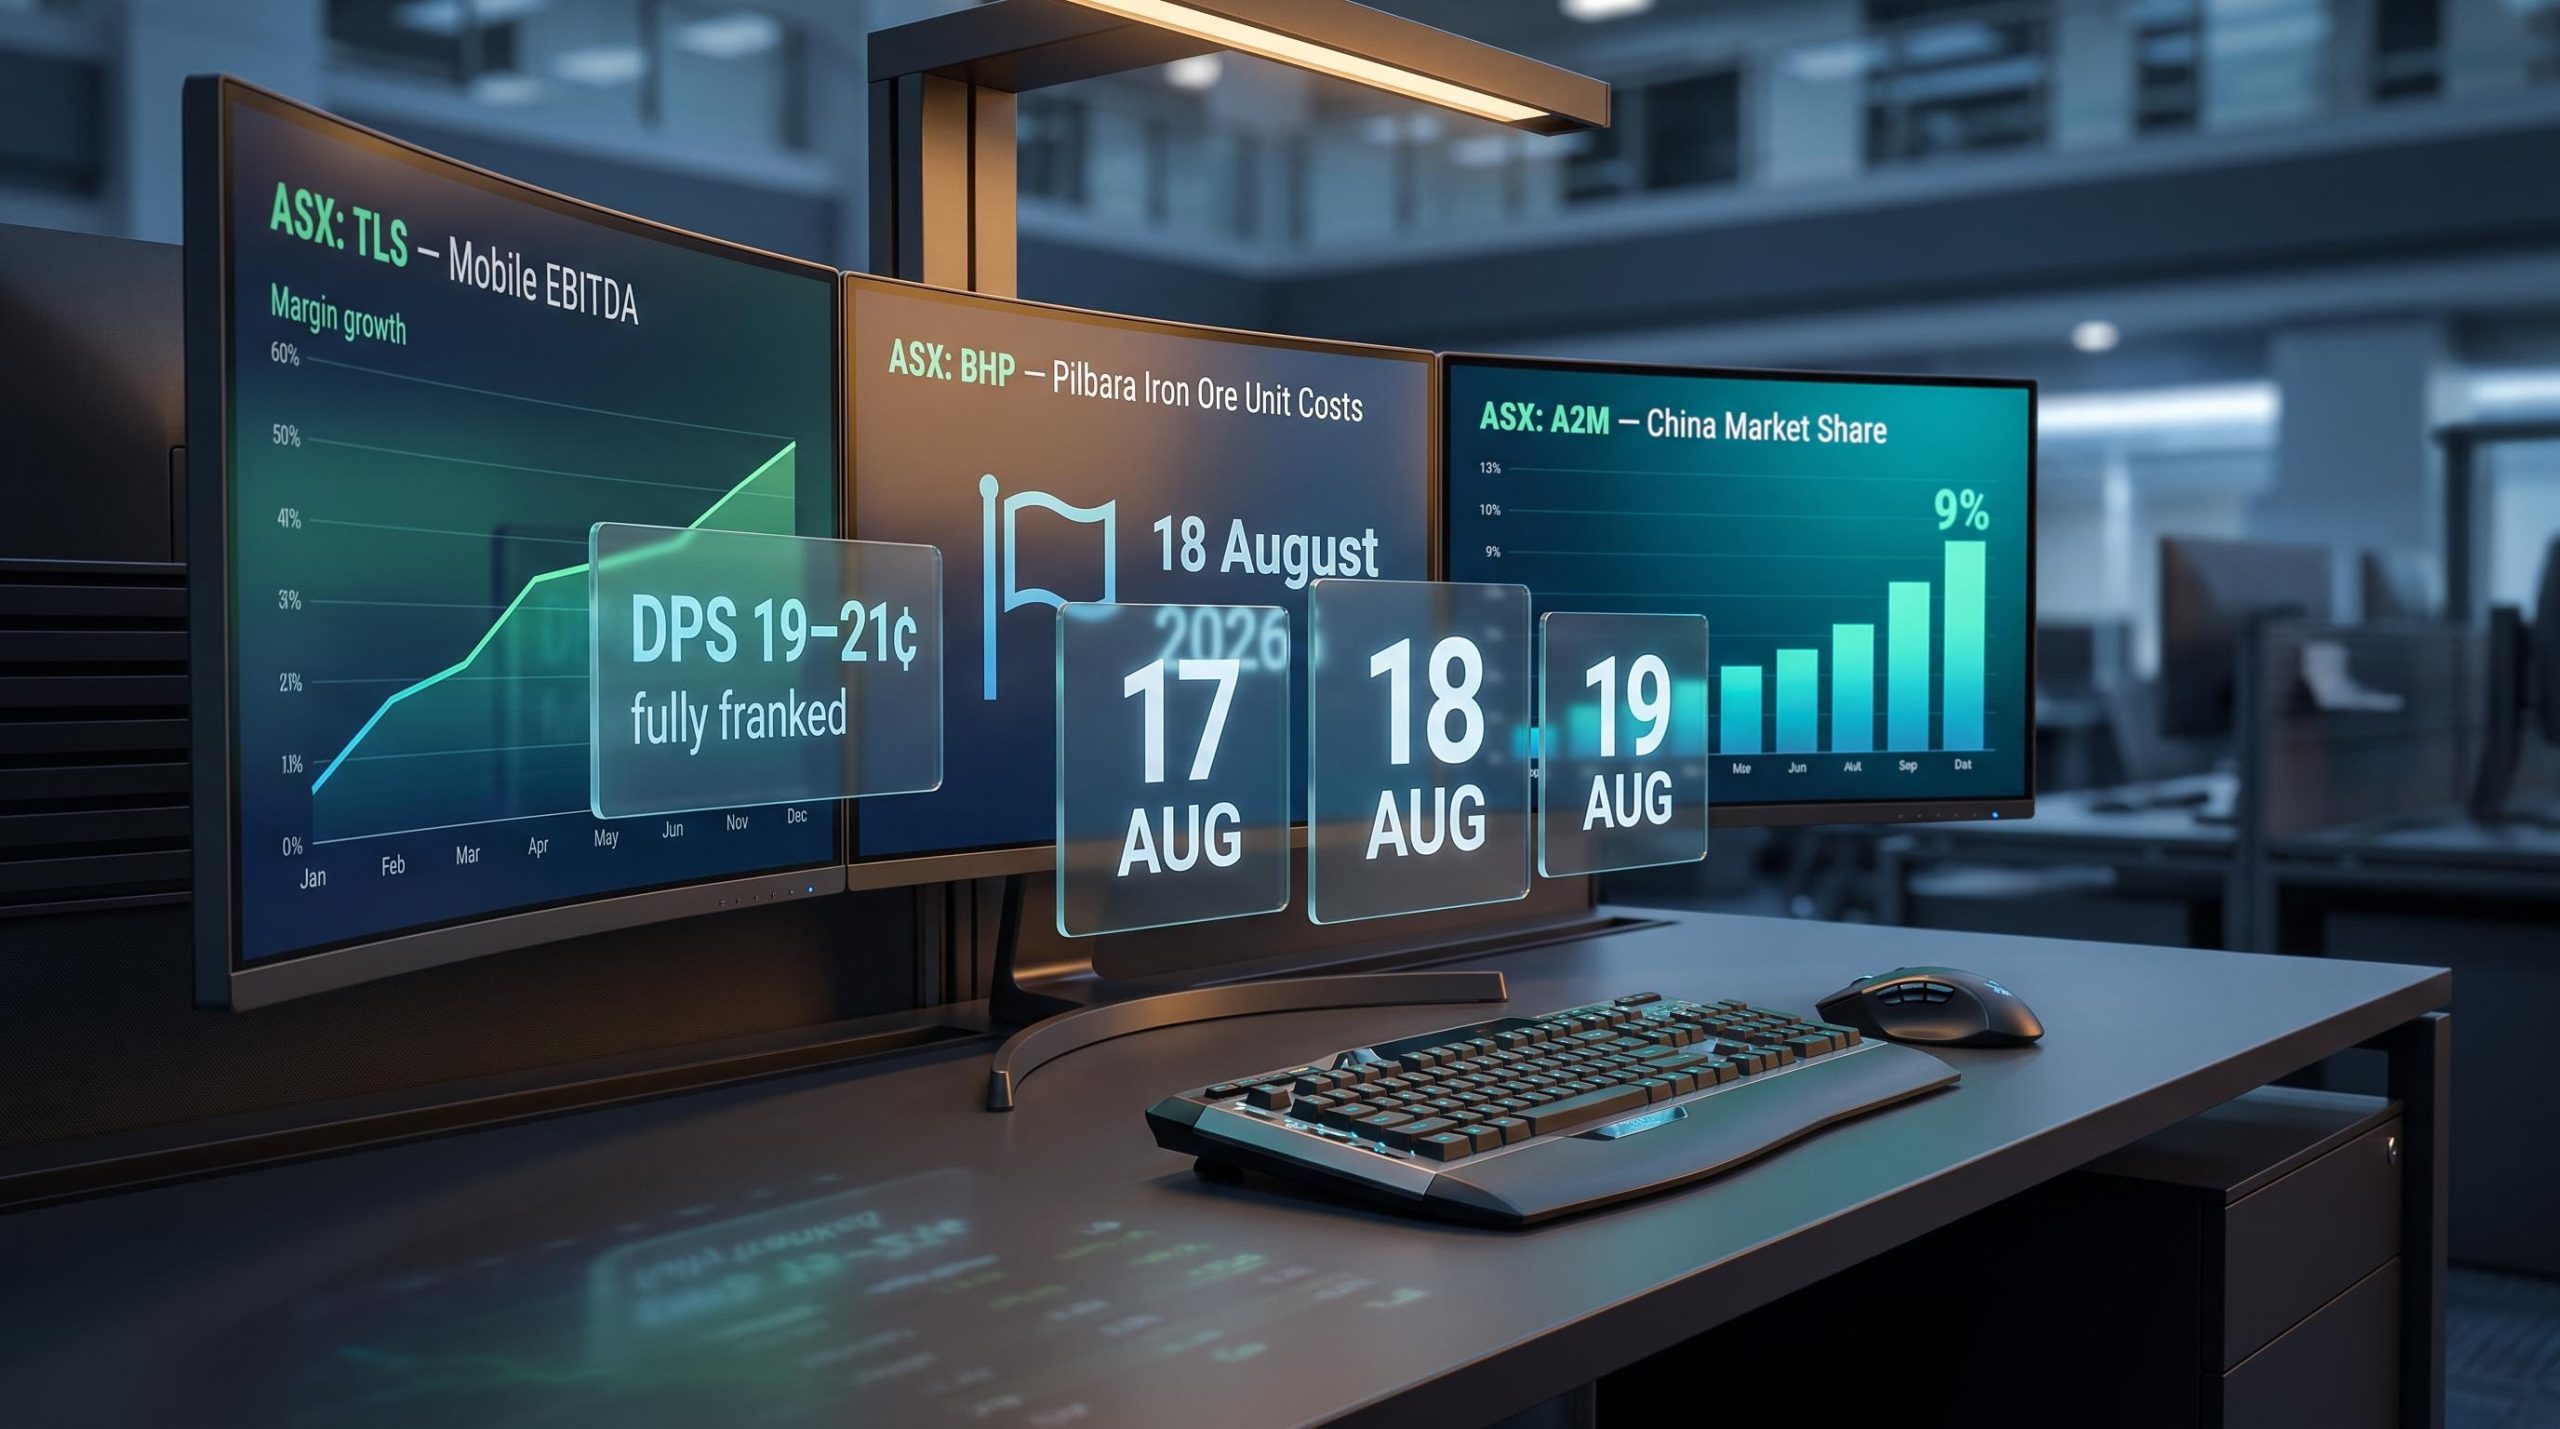
The August 2026 ASX reporting window opens in under three weeks, and within a five-day span, three companies that sit in a significant number of Australian retail portfolios will publish their full-year results. What you do with those results depends entirely on whether you are watching the right numbers.
Telstra, BHP, and A2 Milk each report between 17 and 19 August 2026, covering FY26 ending 30 June. Each operates in a structurally different sector, which means each requires a different analytical lens. The headline profit figures will dominate news coverage, but Morningstar equity analysts have identified the specific underlying metrics that carry the most signal for investors making hold, add, or reduce decisions.
Here is a company-by-company framework, built from institutional analyst guidance, so you can assess each result as it lands and judge whether the market’s reaction is tracking genuine fundamental information or short-term sentiment.
Why beating consensus is not the whole story
Market expectations ahead of a result are shaped by more than last year’s numbers. Broker consensus forecasts, recent segment-level trend data, and each company’s stated capital allocation strategy all feed into what the market is pricing before a single line of the earnings release is published. The beat, meet, or miss verdict is a function of how results compare to that full range of expectations, not a single point estimate.
ASX confession season 2026 has already produced a concentrated wave of profit warnings from consumer-facing companies, which means several of the macro headwinds shaping Telstra, BHP, and A2 Milk’s FY26 results — including rate pressure, a stronger Australian dollar, and disrupted supply chains — were flagged well before the August reporting window opened.
Before each company reports, identify the four standard measures analysts track:
- Revenue (top-line growth trajectory)
- EBITDA (operating earnings before non-cash charges)
- NPAT (net profit after tax, the bottom line)
- DPS (dividend per share, the cash return to shareholders)
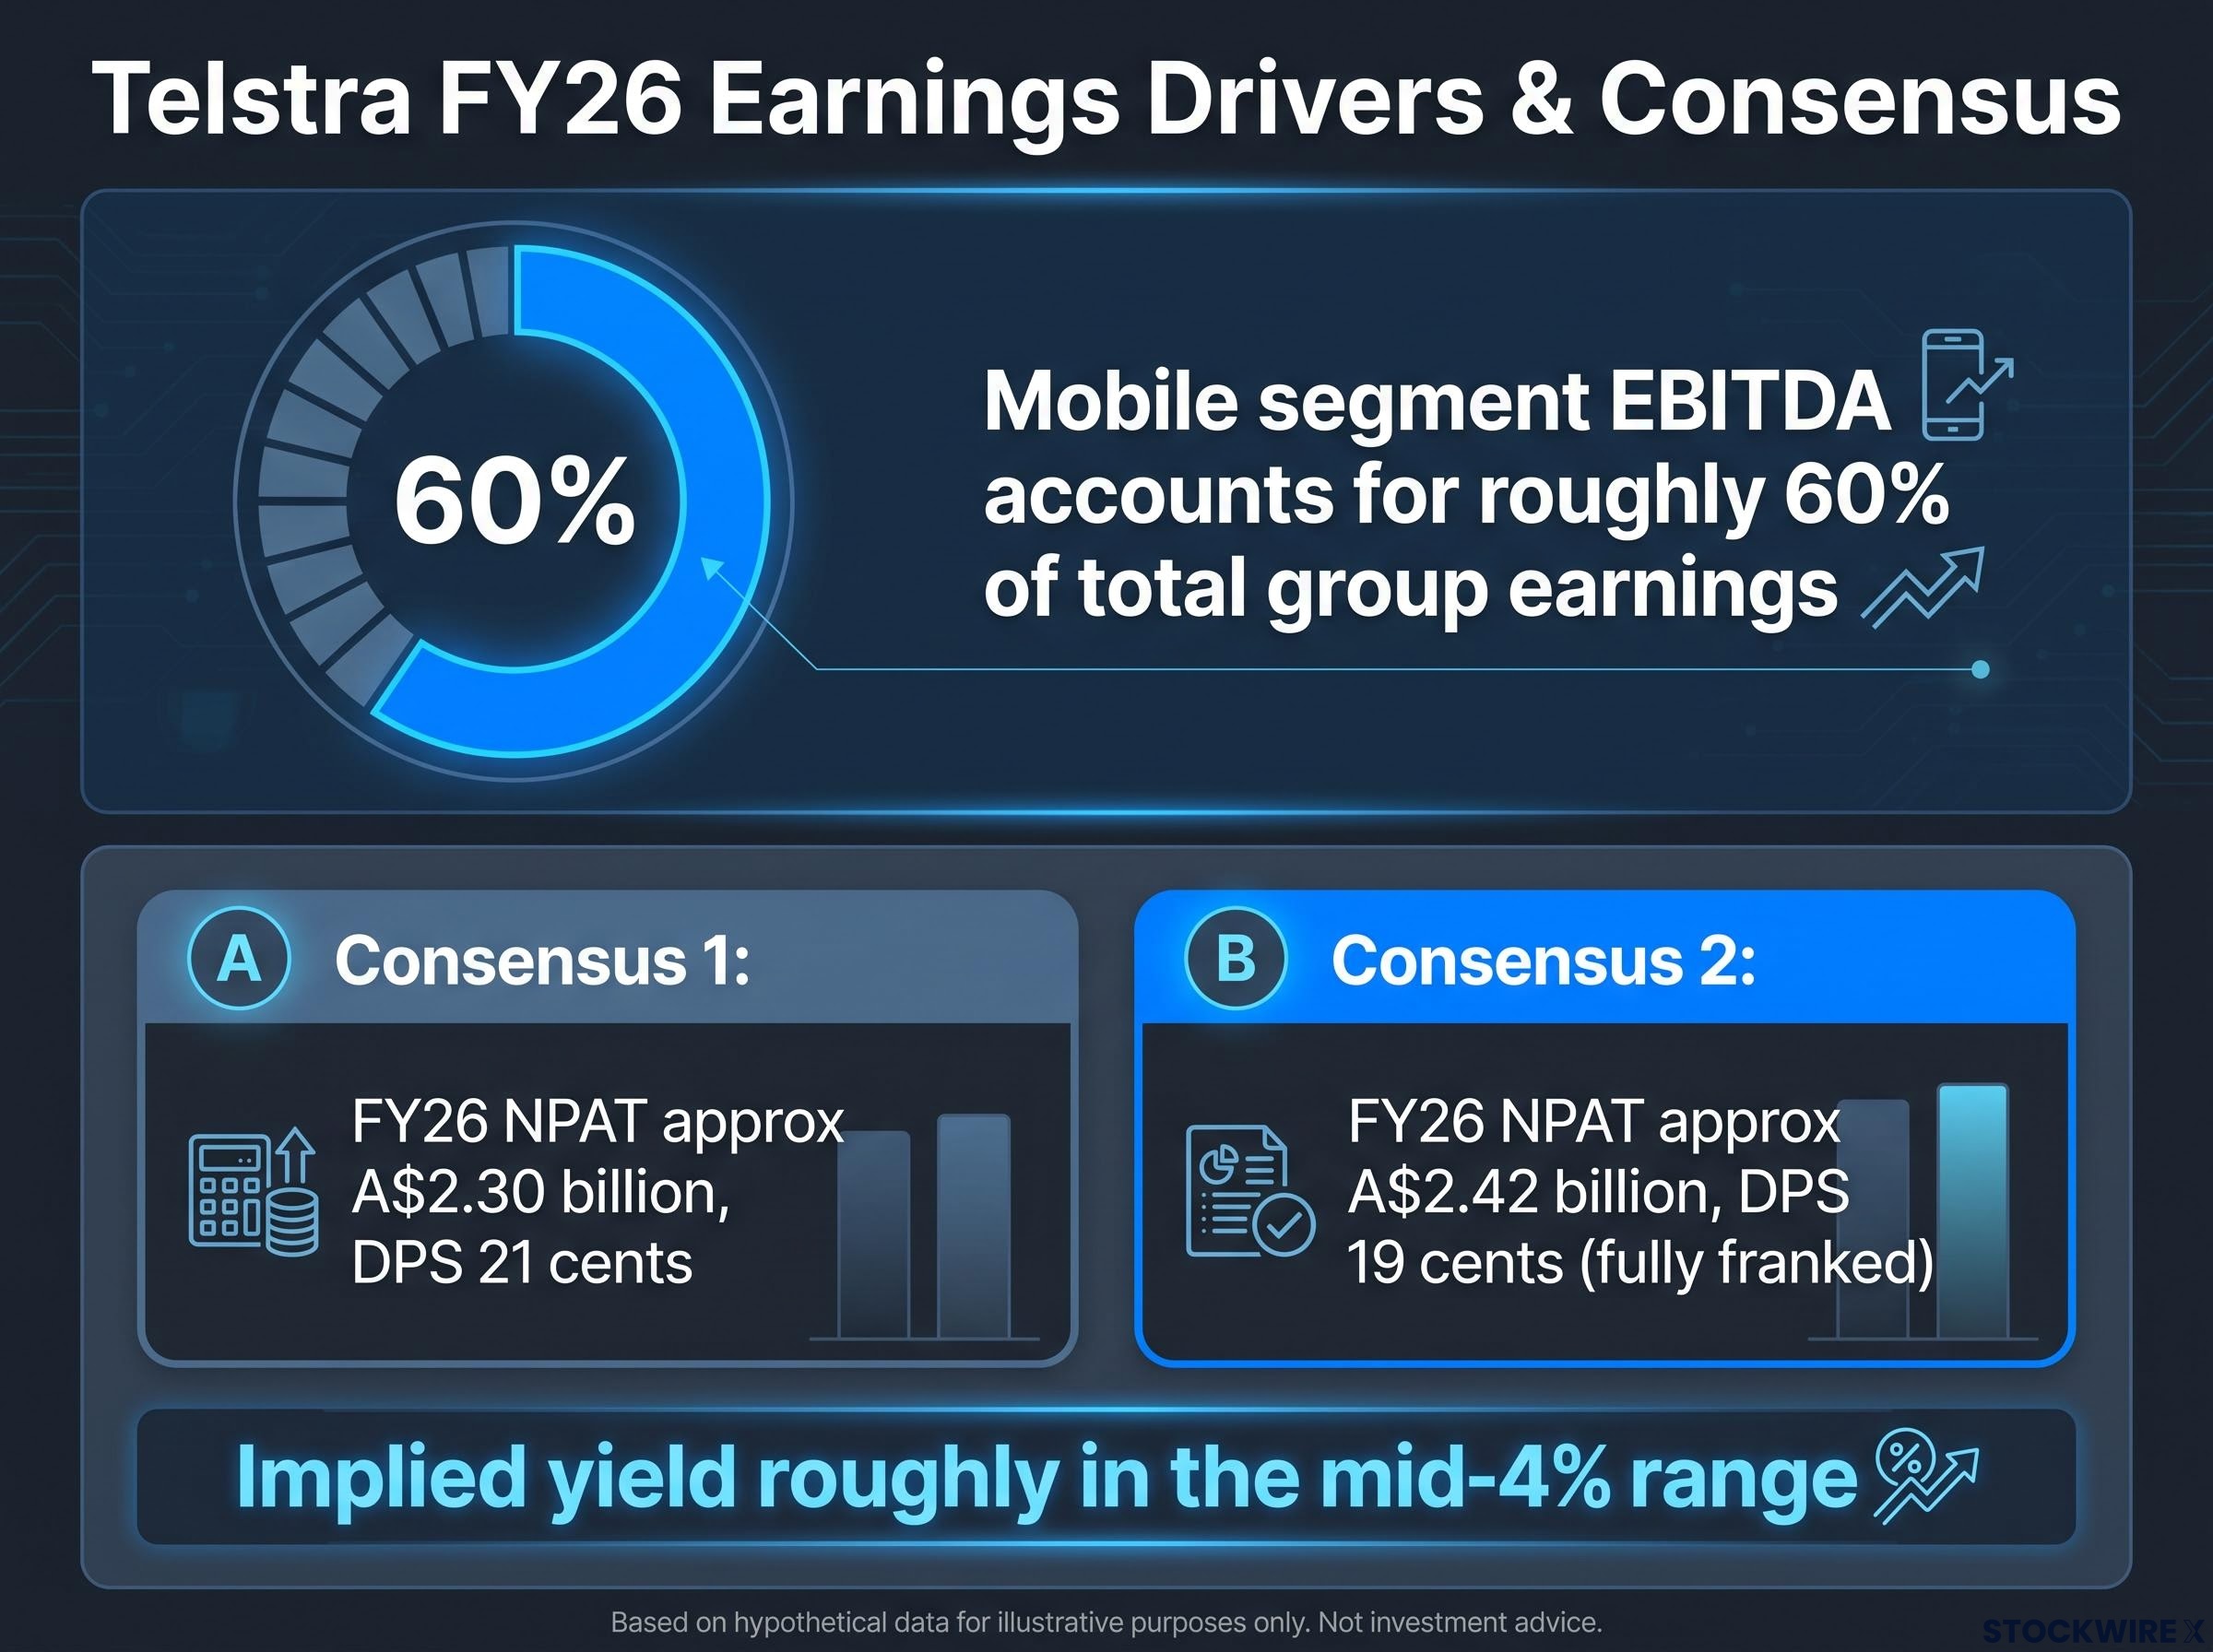
For Telstra specifically, two distinct forecast sets illustrate why ranges matter more than targets. One consensus snapshot places FY26 NPAT at approximately A$2.30 billion with DPS of 21 cents; another shows NPAT closer to A$2.42 billion with DPS of 19 cents, fully franked. That variance tells you the market is not locked onto a single outcome, which means a result anywhere within that band should not, on its own, move the share price dramatically.
BHP narrows this problem further. Because BHP pre-releases quarterly production data, including a July 2026 report, the market has already absorbed volume and price information before the formal result. The remaining uncertainty sits in a narrower band than for Telstra or A2 Milk.
Guidance can matter as much as historical results. A technical earnings “meet” that comes with constructive FY27-28 guidance can trade like a beat, and vice versa. Watch where the company says it is going, not just where it has been.
When big ASX news breaks, our subscribers know first
Telstra (ASX: TLS): what to watch on 19 August
According to Morningstar analyst Brian Han, mobile segment EBITDA is the figure that commands the most attention, given that it accounts for roughly 60% of total group earnings and therefore anchors both the valuation case and how investors respond to the announcement. If Telstra’s mobile margins compress, even if partially explained by one-off promotions, that tells you competitive positioning against Optus and TPG Telecom is under genuine pressure, which changes the medium-term earnings trajectory, not just the FY26 number.
The second layer centres on cost reduction. Because Telstra’s legacy fixed-line revenue is in structural decline, any evidence that savings are running ahead of schedule indicates management is successfully compensating for headwinds it has little ability to reverse. When that cost discipline falters, the drag from fixed-line products becomes harder to absorb.
The dividend validates everything above. Consensus places FY26 DPS at 19-21 cents, fully franked, implying a yield roughly in the mid-4% range at recent prices. Telstra is predominantly owned by investors seeking reliable income, so even a modest deviation from the expected payout carries a significance that extends well beyond the raw cents-per-share figure.
| Metric | Beat signal | Miss signal |
|---|---|---|
| Mobile EBITDA / margin | Solid growth, stable or rising margins, rational pricing commentary | Margin compression from aggressive discounting or high acquisition costs |
| Cost reduction | Savings running ahead of guidance, especially in fixed enterprise | Limited progress or new fixed-line pressures not offset by savings |
| Dividend (DPS) | At or above 21 cents, confident language on sustaining payouts | Any reduction versus FY25 or language hinting at future constraints |
Separate the noise from the signal. While commentary about a recent mobile network outage may command significant attention in the press, Han takes the view that it will not result in any permanent damage to Telstra’s underlying earnings capacity. The core financial metrics above are where the information sits.
Understanding what drives an ASX miner’s result, and why BHP is different
Because BHP releases quarterly production data ahead of its formal financial results, the earnings announcement on 18 August is unlikely to deliver the kind of volume or price revelation that can catch investors off guard in other sectors. Key figures including output volumes and average realised commodity prices enter the public domain well before the annual result, so the market has already had the opportunity to update its top-line assumptions by the time the full accounts are published.
ASX Guidance Note 8 sets out the continuous disclosure obligations that govern when and how listed companies must release material information — the regulatory framework that makes pre-result data releases like BHP’s quarterly production reports a formal requirement rather than voluntary disclosure.
That narrows the genuine uncertainty to two areas:
- Pre-known: Production volumes and realised commodity prices (already disclosed in quarterly reports)
- Genuinely uncertain: The final dividend declaration and Pilbara iron ore unit costs
- Strategic context: The Jansen potash project update (long-duration, not a near-term earnings driver)
According to Morningstar analyst Jon Mills, iron ore and copper are the commodities that do the heavy lifting for BHP’s share price, while coal and potash contribute less to overall valuation. On cost competitiveness, BHP holds the top position among global iron ore producers, with Rio Tinto (ASX: RIO) sitting in second place.
The cost picture deserves close attention. Global supply chain disruptions tied to Middle Eastern conflict have pushed freight and diesel expenses higher, while labour costs have also climbed across the Pilbara as wage pressures take hold. If BHP’s unit costs move materially above guidance and above what Rio Tinto reports around the same time, that signals a BHP-specific operational issue rather than a sector-wide headwind, which has different implications for your valuation view.
| Uncertainty metric | Beat / miss signals |
|---|---|
| Final dividend | Beat: Upper end of payout range, supported by strong free cash flow. Miss: Below expectations without compelling strategic rationale. |
| Pilbara iron ore unit costs | Beat: Stable or improving despite macro headwinds. Miss: Cost increases well above guidance or peer trends, suggesting BHP-specific issues. |
Jansen potash: a long-duration bet, not a near-term earnings driver
Situated in Canada and targeted for first production in 2027, Jansen is a large-scale potash project built around a low-cost, long-life operating model. Because the asset’s value is grounded in decades of future output rather than near-term cash flows, a modest rise in current capex does not fundamentally alter the investment case. What matters on 18 August is whether the project update keeps the long-run cost and production assumptions credible, not whether the project contributed to FY26 earnings.
A2 Milk (ASX: A2M): how China share and pricing data determine the medium-term growth case
A2 Milk reports on 17 August, and the investment story comes down to one proposition: can a foreign-owned infant formula brand sustain and grow a premium position in China, the world’s largest infant formula market? For Morningstar analyst Angus Hewitt, the metric that sits above all others is A2 Milk’s share of the Chinese labelled infant formula market, the single largest growth opportunity available to the company.
The headline consolidated profit figure is a lagging indicator. Hewitt does not anticipate a material deviation from consensus on overall earnings. The information that actually determines the company’s medium-term trajectory sits underneath it, in the China-specific data.
A2 Milk’s FY26 guidance downgrade in April, driven by five converging supply chain constraints including Synlait manufacturing backlogs and elevated Chinese customs inspection rates, shifted a material portion of expected revenue recognition into FY27 — which means the August consolidated earnings figure will understate the underlying demand picture that China share and pricing data can clarify.
A2 Milk’s SAMR approval for two new infant formula product registrations, secured in June 2026, removed a significant regulatory overhang and triggered the expected $300 million special dividend, but the more consequential question for August is whether the new China label products and the Pokeno supply chain transition are translating into the market share gains the growth premium demands.
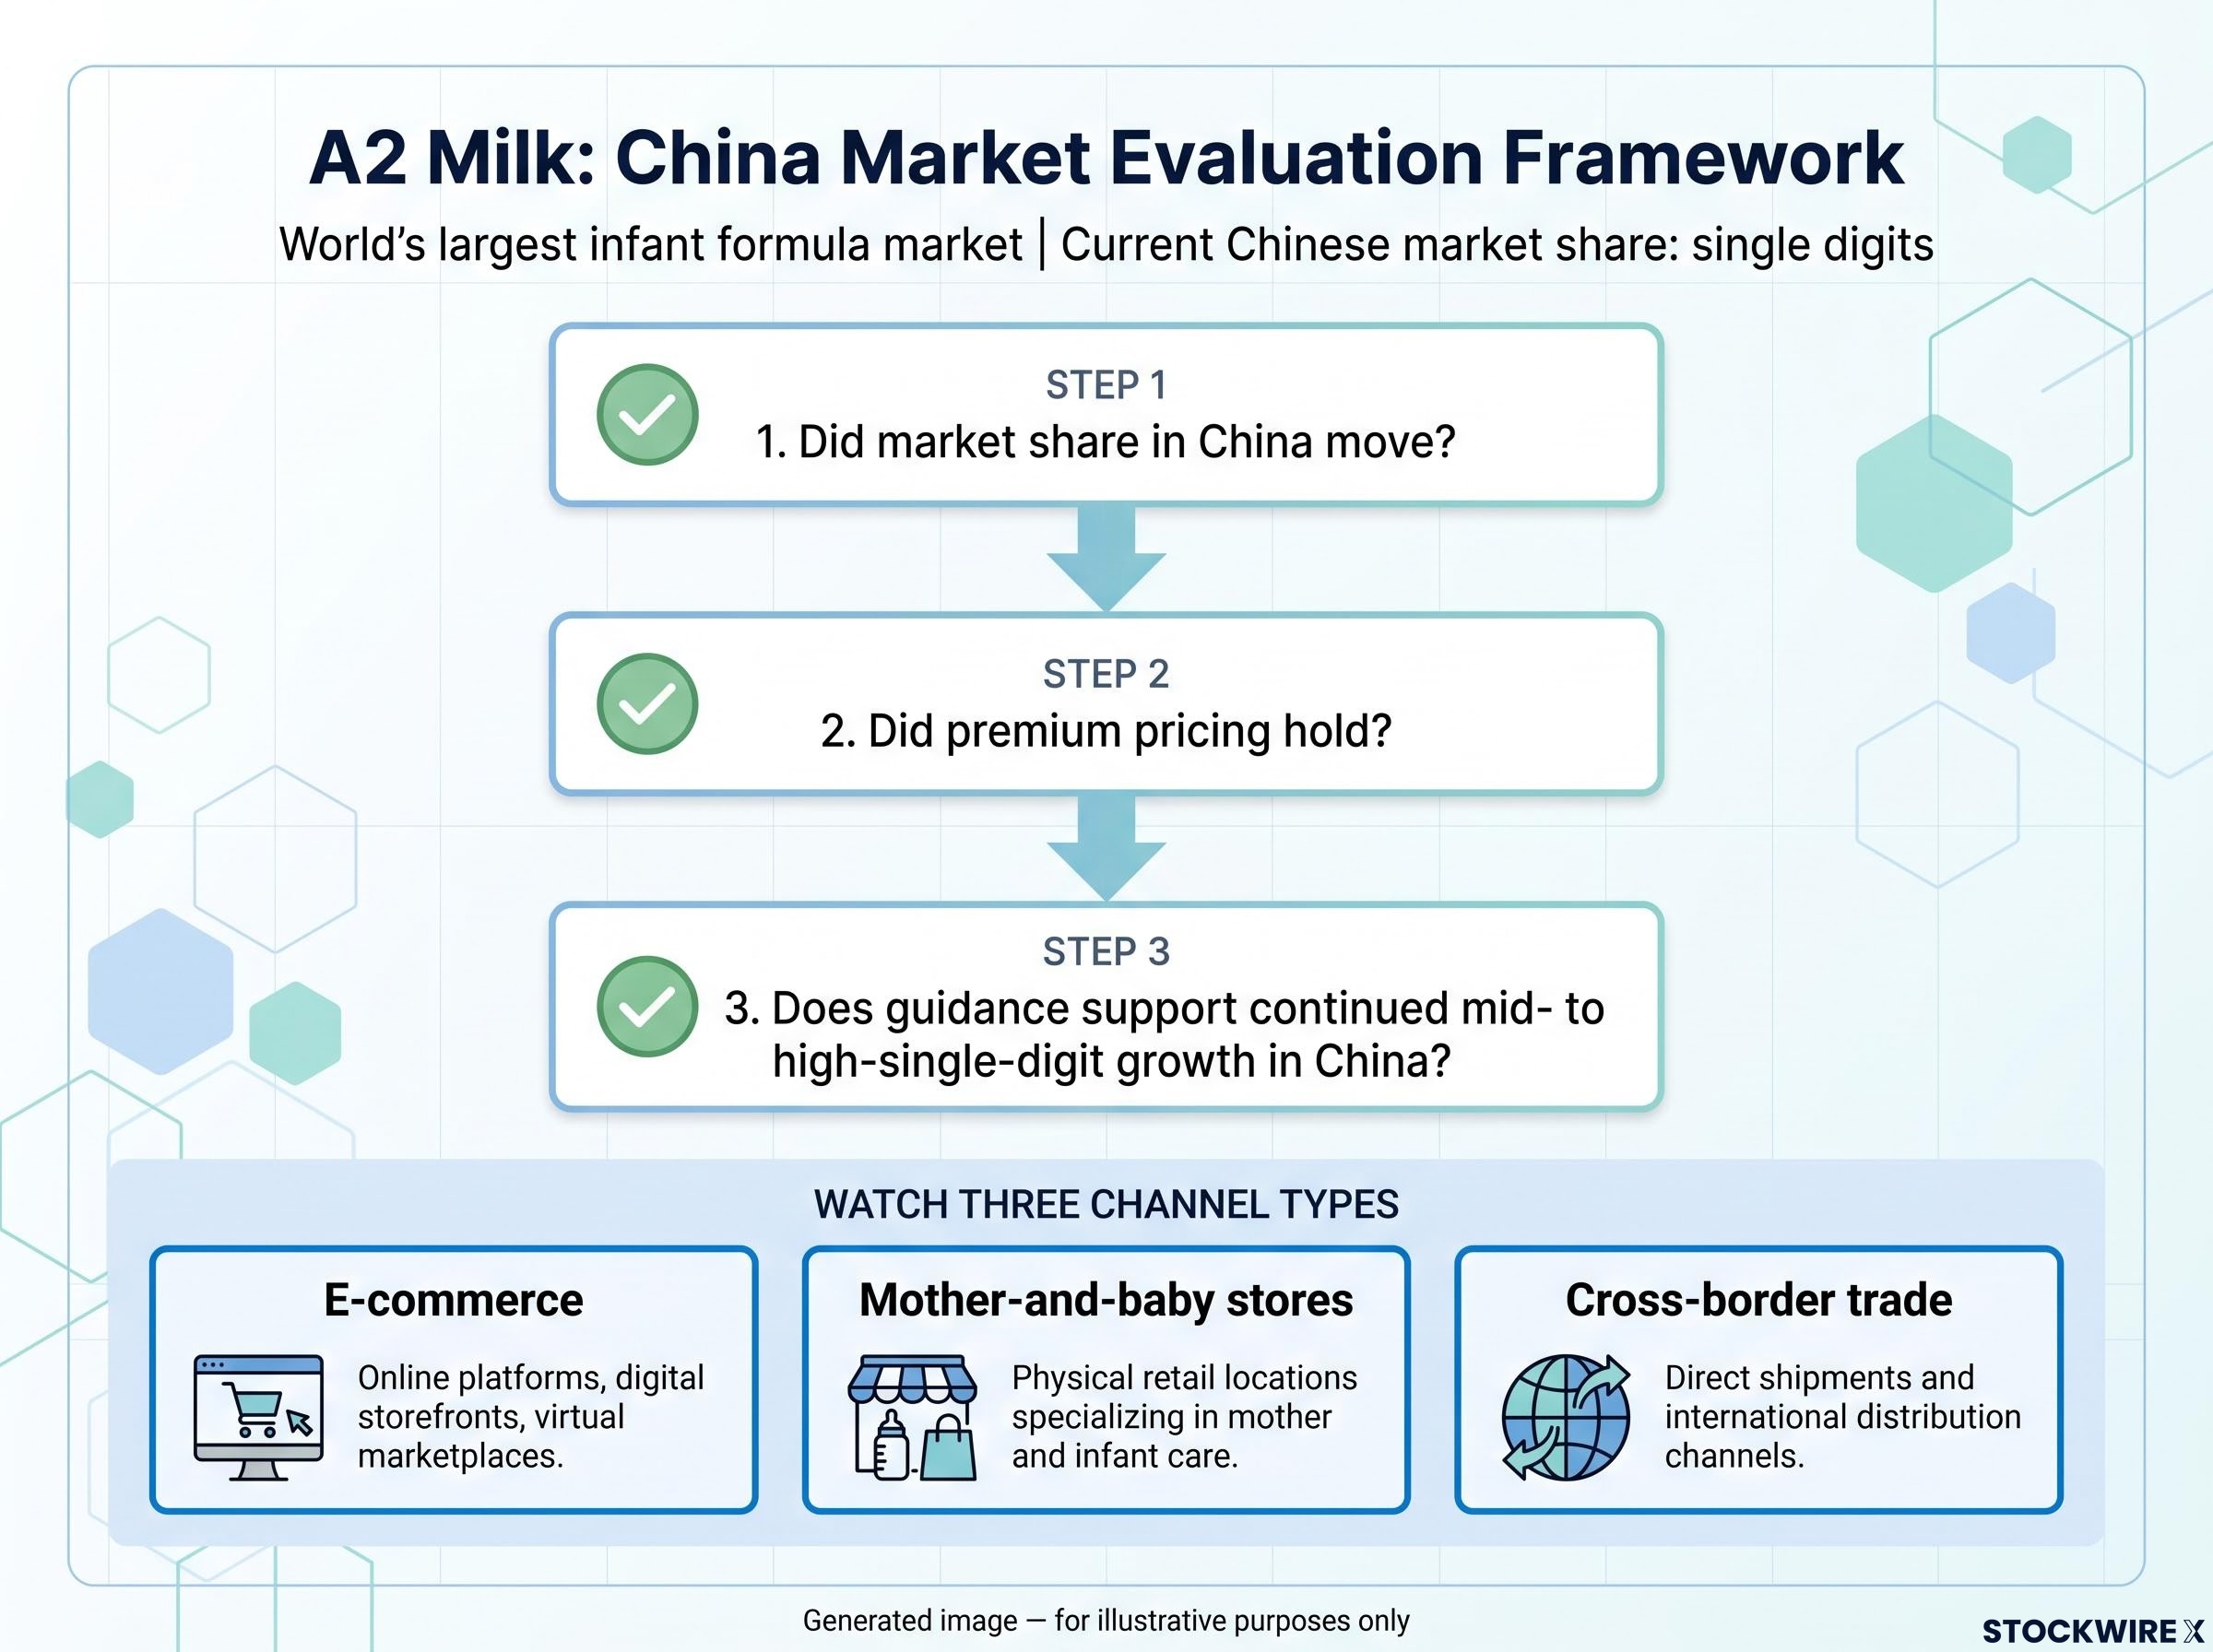
Apply this three-question framework when the result lands:
- Did market share in China move? With A2 Milk’s Chinese market share still measured in single digits, the potential for further gains and the risk of competitive erosion are both very much in play. Share losses attributed to stronger domestic Chinese competitors carry a structurally different signal from losses caused by temporary channel disruption, and the management commentary on 17 August is where you find which one is actually happening.
- Did premium pricing hold? A2 Milk’s competitive position rests on its brand strength in a segment where China’s rigorous regulatory framework has raised the barriers to entry and reinforced trust in recognised names. When pricing comes under pressure without a corresponding lift in volumes, that is a structural concern rather than a temporary one.
- Does guidance support continued mid- to high-single-digit growth in China? Watch the three channel types: e-commerce, mother-and-baby stores, and cross-border trade. Forward guidance will shape how investors update their medium-term growth models far more than the backward-looking FY26 number.
The stock trades on a growth premium relative to ASX consumer staples peers. That premium is only defensible if the China share and pricing thesis is intact. A headline earnings meet that comes with deteriorating China data is not a meet; it is a warning.
Reading the market’s reaction across 17-19 August
When results land in quick succession, the instinct is to react to price moves. The more useful discipline is to check whether the price move tracks the priority metric for each company, or whether it is responding to the headline number or media framing.
Three cross-sector comparison checks to perform after each result:
- BHP’s cost and dividend stance should be read against other major miners reporting in the same window. If costs are rising sector-wide, that is a different signal from BHP-specific pressure.
- Telstra’s mobile margins should be compared against broader Australian telco trends. If the entire sector is compressing, it is a market-structure issue, not a Telstra-specific failure.
- A2 Milk’s China narrative should be read against what peers and regulators are signalling about the infant formula market. Isolated share loss is more concerning than a market-wide slowdown.
| Company | Result date | Primary signal to watch | Common noise to ignore |
|---|---|---|---|
| A2 Milk | 17 August | China market share and premium pricing sustainability | Consolidated EPS in isolation |
| BHP | 18 August | Final dividend and Pilbara iron ore unit costs | Short-term commodity price volatility |
| Telstra | 19 August | Mobile EBITDA, cost reduction, DPS | Network outage media coverage |
If all three companies report within consensus range but each provides constructive forward guidance, the appropriate response is to reassess your position sizing relative to your conviction on each company’s medium-term thesis, not to treat a “meet” as a reason to act or do nothing by default.
What each result will tell you about the next 12 months, not just FY26
The value of the 17-19 August reporting window is not in confirming what already happened. It is in updating the inputs to your medium-term thesis on each company.
- Telstra: Does mobile earnings sustainability and cost discipline support the dividend trajectory into FY27-28? Han’s view is that ASX telcos are on a path to lower capital expenditure and fixed costs through to 2030, which should translate into stronger free cash flows and more predictable distributions. The FY26 result tells you whether Telstra is on that trajectory or falling behind it.
- BHP: Does the cost structure and capital allocation stance at current commodity prices support the long-term case for iron ore and copper? And does the Jansen update confirm that first production in 2027 remains on schedule and that the project’s long-run cost competitiveness is still credible?
- A2 Milk: Does the China market share and pricing data give you enough confidence in the growth premium the stock trades on? Hewitt’s view is that A2 Milk’s competitive position rests on the strength of its brand in Chinese infant formula and Australian fresh milk, and the August result is the moment when the durability of that position comes under scrutiny.
For investors wanting to situate Telstra’s August dividend outcome within the broader income landscape, our full explainer on ASX dividend growth forecasts through FY28 covers Morningstar’s sector-by-sector projections, including why mining dividends are expected to decline as capex absorbs free cash flow.
The investors who use earnings season most effectively are the ones who enter with a specific question about each company’s medium-term thesis and leave with a clearer answer, not the ones who wait for the share price to tell them what to think.
This article is for informational purposes only and should not be considered financial advice. Investors should conduct their own research and consult with financial professionals before making investment decisions. Past performance does not guarantee future results. Financial projections are subject to market conditions and various risk factors.
—