Most investors typing “IVV ETF” into a search bar are actually asking two different questions at once. One group wants to know if this is the cheapest, cleanest way to own the world’s dominant companies. The other wants to know if it can pay them an income they can live on.
Those are not the same question, and IVV answers them very differently.
The gap matters right now for Australian retail investors weighing where their next dollar should go. The fund has delivered an average annualised total return of 12.96% over the five years to September 2026, which makes it a serious growth engine. Yet its trailing yield sits at roughly 1.04%, unfranked and paid quarterly, meaning it takes around $96,000 invested just to produce $1,000 a year in distributions.
Here is what the analysis below settles. By the end, you will know which of those two questions IVV answers well, which it answers poorly, and exactly where it belongs in a portfolio built for your situation rather than someone else’s.
What you are actually buying when you buy IVV
Strip back the marketing and IVV is not a fund in the way most people picture one. The ASX-listed unit is a feeder structure: it holds approximately 99.96-99.97% of its assets in the US-listed iShares Core S&P 500 ETF. You are buying an Australian-listed wrapper around the American original.
That underlying product tracks the S&P 500, an index of 500 of the largest US-listed companies chosen by market capitalisation and liquidity. Not by dividend yield. Not by payout policy. That single design choice determines almost everything about what IVV delivers, a point that matters enormously once the income question arrives.
What the reader gets in return is scale and access. The ASX-listed vehicle carries a market capitalisation of roughly $14,947 million as at late September 2026 (per InvestSMART), and it does the job at a cost that barely registers.
Management expense ratio: 0.04% per annum Confirmed as at 5 June 2026, this is among the lowest fees available to any Australian retail investor.
That 0.04% figure is not just a small number to admire. It means the structural drag on your returns is close to zero, and that accessing Nvidia, Apple, Microsoft and the other 490-odd names costs you almost nothing at scale. The fee is not what will decide your outcome here. The composition will.
Passive index investing carries a structural cost advantage that SPIVA data spanning more than 20 years consistently confirms: 79% of active large-cap US equity funds underperformed the S&P 500 over the year to December 2025, and the underperformance rate rises as the observation window lengthens.
The companies inside the fund
The names inside IVV are globally operating businesses, not narrow US-domestic outfits. When you own this fund, you own indirect exposure to worldwide economic activity through a single ASX ticker.
| Company | Weight (%) |
|---|---|
| NVIDIA Corp | 7.32% |
| Apple Inc | 6.63% |
| Microsoft Corp | 4.96% |
| Amazon.com Inc | 3.47% |
| Alphabet Inc Class A | 3.08% |
| Broadcom Inc | 2.56% |
| Alphabet Inc Class C | 2.46% |
| Meta Platforms Inc Class A | 2.40% |
| Tesla Inc | 1.92% |
| Berkshire Hathaway Inc Class B | 1.57% |
Source: BlackRock iShares S&P 500 ETF Australian fact sheet, dated 31 August 2026. The top two names alone, Nvidia and Apple, account for nearly 14% of the entire fund. Keep that figure in mind, because it becomes the crux of the diversification question later.
When big ASX news breaks, our subscribers know first
The income reality: what IVV’s yield actually means in dollar terms
The cleanest way to understand IVV’s income problem is to let the numbers argue for themselves. Start with the yield, which varies across data providers depending on the trailing window each one uses.
- 1.01% — ASX product page, tied to a distribution with ex-date 29 September 2026
- 1.03% — Pearler, updated late September 2026
- 1.04% — Yahoo Finance and Motley Fool Australia, late September 2026
- 1.06% — BlackRock global page, 12-month trailing to 31 August 2026
- 1.11% — BlackRock Australian page, 12-month trailing to 30 March 2026
That spread reflects methodology differences, not errors. Take 1.04% as the working figure. Pearler also reports a five-year average yield of 1.15%, so the current reading is broadly in line with the fund’s own history.
Now translate that into dollars, because a percentage tells you nothing about your kitchen table.
Generating $1,000 per year in distributions from IVV at the current 1.04% yield requires approximately $96,000 invested.
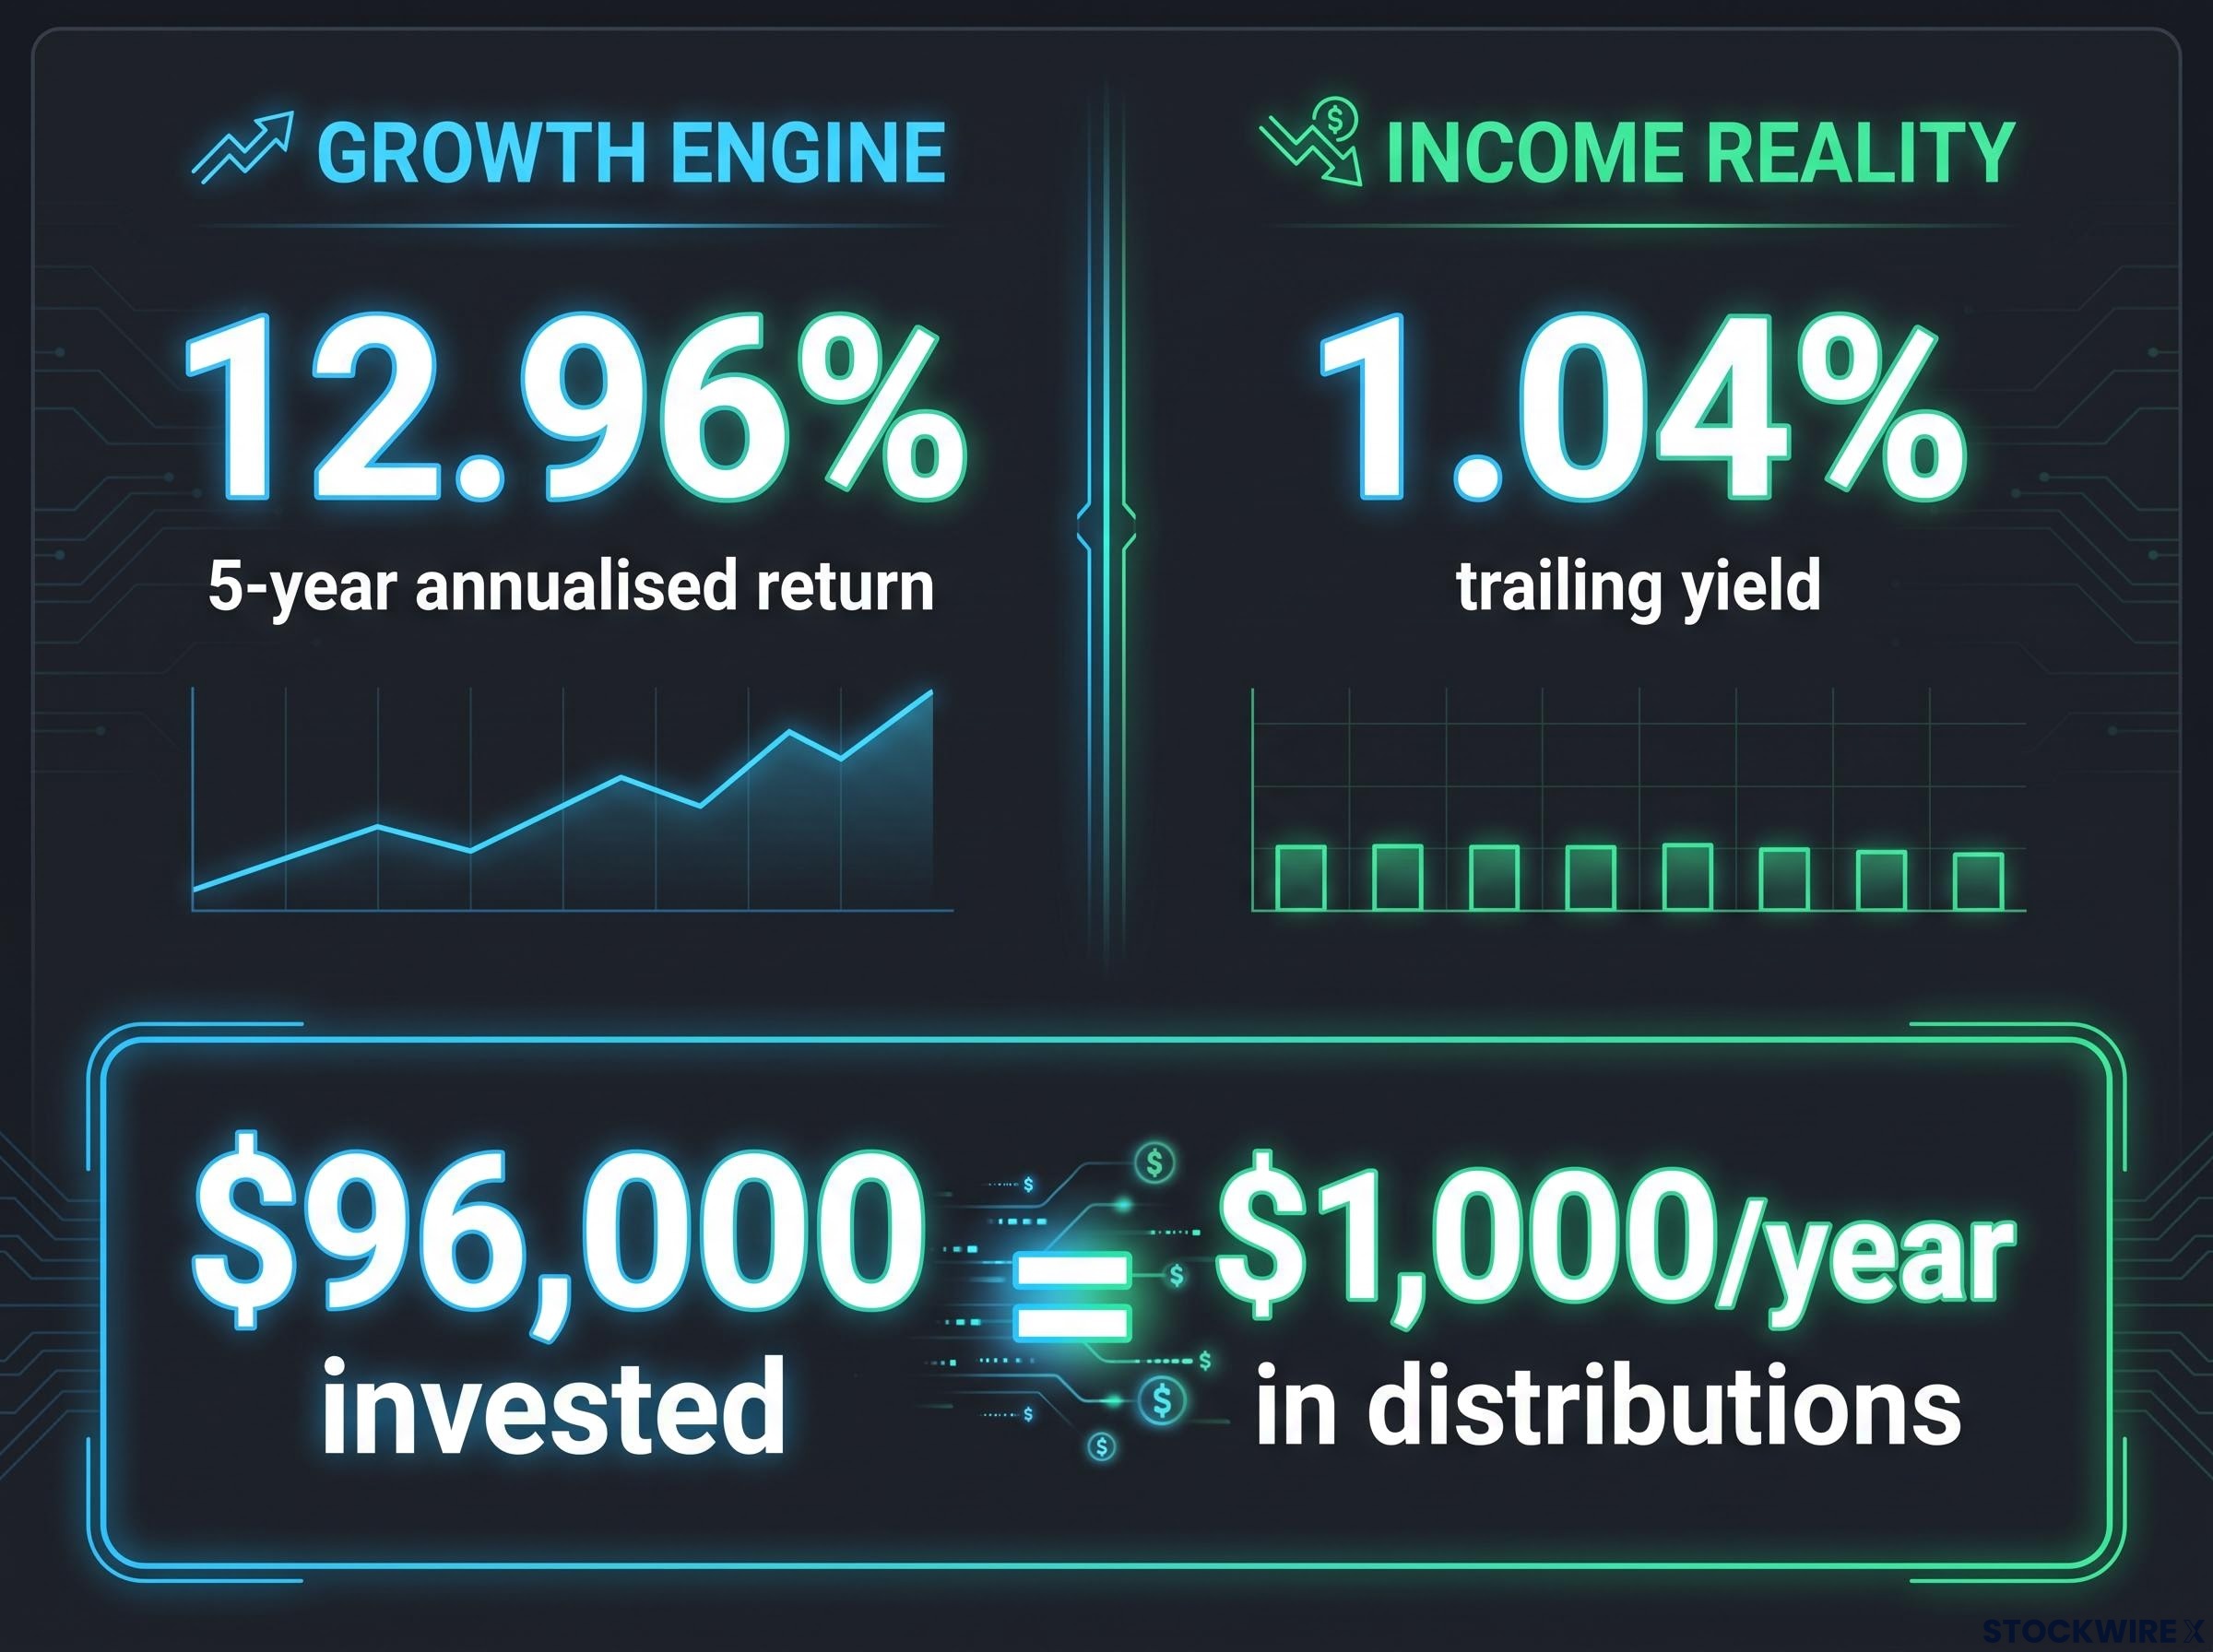
For anyone hoping IVV might cover living costs or meaningfully top up an income, that figure is the clearest signal available that the fund was not built for the job. Understanding this upfront prevents a common and expensive mismatch between what the product does and what you actually need it to do.
The recent per-unit distributions confirm the pattern rather than contradict it: 13.95 cents (ex-date 30 March 2026), 23.3 cents (ex-date 1 July 2026), and an upcoming 17.35 cents (ex-date approximately late September 2026). Real cash, but modest against the capital required to earn it.
One more point Australian investors cannot ignore. Every one of those distributions carries 0% franking. There are no franking credits attached, which is a material disadvantage relative to domestic equity ETFs that pass tax-effective income back to you.
Why does the S&P 500 yield so little?
The low yield is not a flaw in IVV. It is a direct consequence of how the index is built.
S&P 500 constituents are selected by market capitalisation and liquidity, not by how much they pay shareholders. High-yield sectors such as utilities and real estate investment trusts (property-owning companies that must distribute most of their income) make up only small slices of the index, so their generous payouts barely lift the overall figure.
Meanwhile the giants at the top, the Nvidias and Apples of the world, tend to retain earnings for reinvestment or buy back their own shares rather than paying large cash dividends. Their shareholder returns arrive mostly as capital growth.
For an accumulation-phase investor, that is arguably a feature, not a fault. Earnings retained inside high-quality businesses can compound into stronger long-term capital growth, which is precisely what the return record suggests has happened.
Diversification claims and concentration realities
Five hundred companies sounds like the definition of diversification. It is the number most investors anchor to, and it is where the assumption starts to wobble.
By count, IVV is broad. By weight, it is not. The top 10 holdings alone represent a large chunk of the entire portfolio, and they cluster in the same corner of the market.
The top 10 holdings alone account for 36.37% of the portfolio as at 31 August 2026.
Add the concentration by style and it sharpens further. Nvidia and Apple together make up roughly 13.95% of the fund, and the heaviest weightings sit in information technology, communication services and consumer discretionary. The “500 stocks” headline can quietly mislead anyone expecting balanced sector exposure.
What IVV genuinely diversifies is worth stating plainly, because it does real work. It diversifies country risk, giving Australian investors exposure well beyond an ASX dominated by banks and miners, and it provides access to global leaders that simply are not listed here. That access is the fund’s strongest argument.
What it does not diversify is style. The concentration creates a specific risk profile:
- Valuation risk: if mega-cap tech valuations compress, IVV feels it disproportionately despite holding 500 names
- Sector concentration risk: heavy technology and adjacent exposure means far less balance across the economy than the headline count implies
- Growth style factor risk: the fund is tilted toward growth and can lag when value or high-dividend stocks lead the market
There is a fourth dimension for Australian holders specifically. IVV is unhedged, so your returns in dollar terms move with the AUD/USD exchange rate. A stronger Australian dollar can erode strong US equity gains before they reach your account. The AUD-hedged counterpart, IHVV, removes that currency exposure, though hedging changes both the risk profile and the income dynamics and is a different decision entirely.
The hedged vs unhedged ETF decision is not a minor footnote: HNDQ returned 40.2% against NDQ’s 27.2% over a single year to May 2026, a 13-percentage-point gap driven entirely by AUD/USD movements rather than any difference in underlying fund holdings.
Here is the read that matters for your own portfolio. If you already hold ASX-listed technology, growth or global thematic ETFs, adding IVV does not reduce your style-factor concentration. It may amplify it. Audit what you already own before treating this fund as a diversifier.
Where IVV fits in an Australian portfolio, and where it does not
By this point the two audiences in the search bar can see themselves clearly. The fund suits one of them well and the other poorly, and the dividing line is not subtle.
For the long-term accumulation investor, IVV earns a place as a core global growth holding, provided you are comfortable with US market concentration, growth-style risk and unhedged currency exposure.
For the income-focused investor or retiree, the case is far weaker. The yield is low, there are no franking credits, and AUD/USD swings add uncertainty to the dollar value of every distribution.
IVV suits:
- Long-term investors building wealth through capital growth
- Those comfortable with US mega-cap and technology concentration
- Investors who can tolerate currency movements without needing the income now
IVV is less suitable for:
- Retirees who need reliable cash flow today
- Investors who prioritise franking credits for tax-effective income
- Anyone wanting low volatility in the Australian-dollar value of their distributions
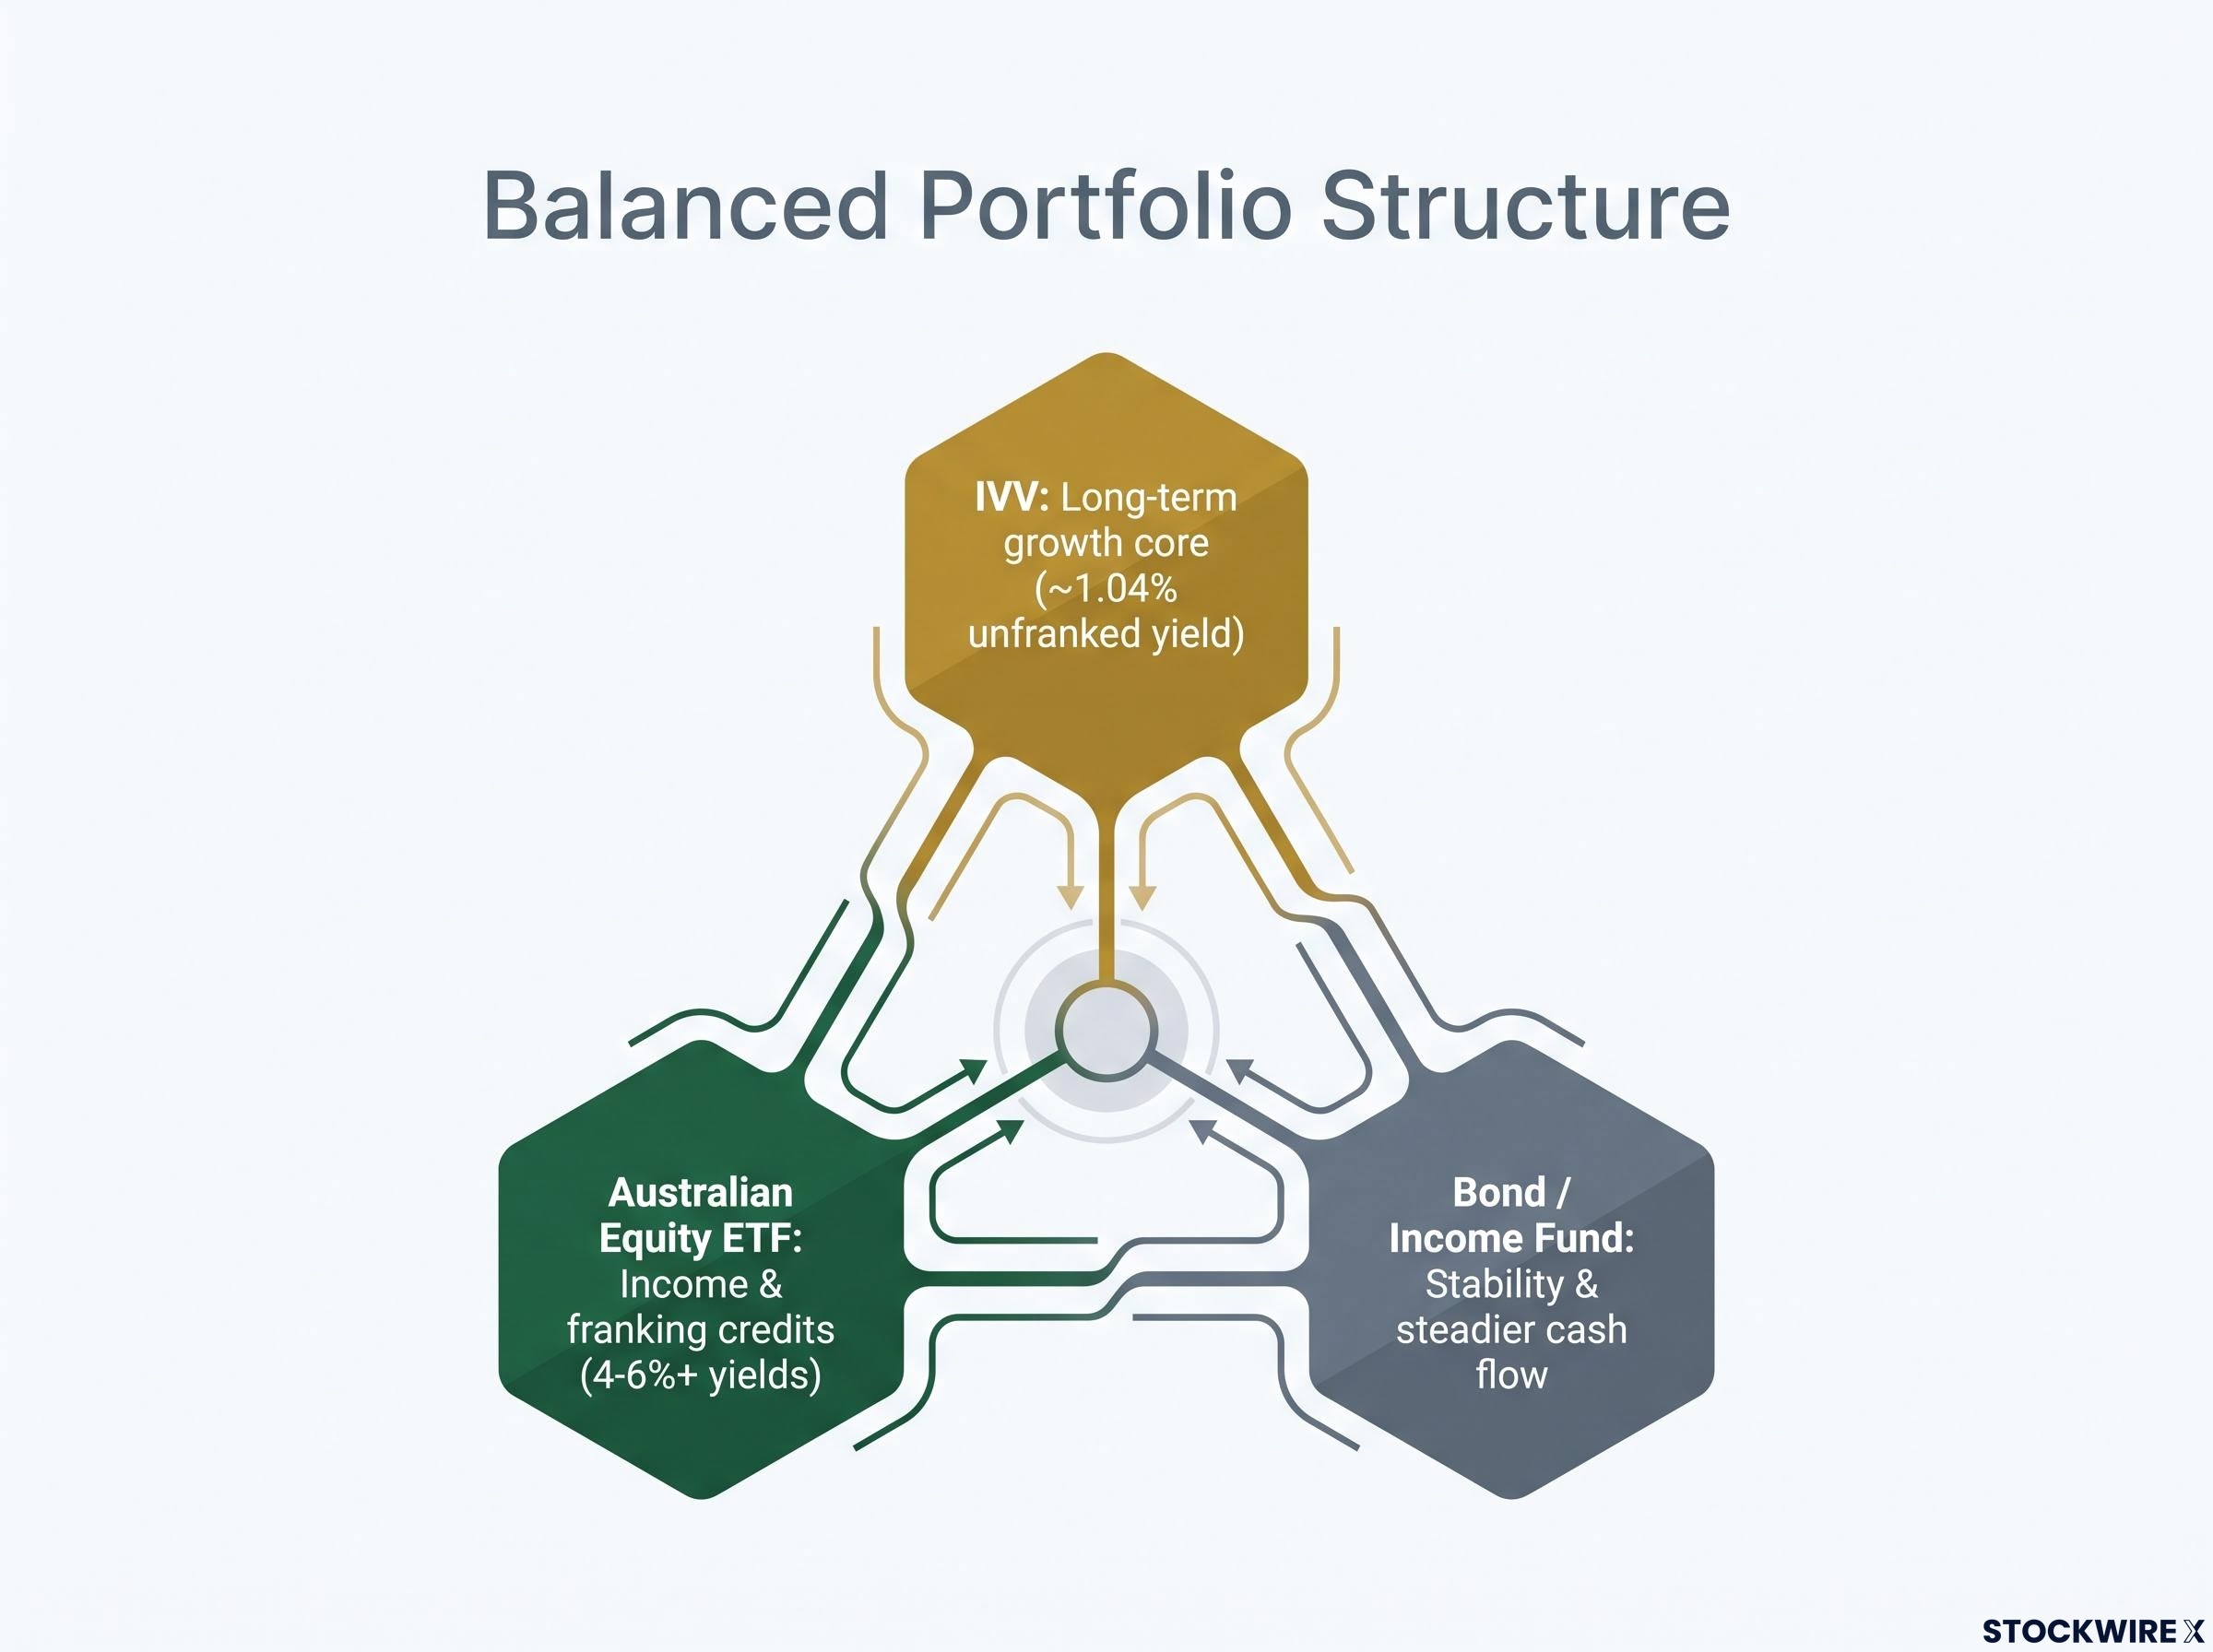
Where income matters, the common fix is not to abandon IVV but to surround it. A balanced structure often runs in three parts:
A balanced structure often runs in three parts: IVV as the long-term growth core, ASX dividend ETFs such as VHY or SYI to provide franked income in the 5-6% range, and a bond or income-focused fund for stability and steadier cash flow.
- IVV as the long-term growth core
- A higher-yield franked Australian equity ETF for income and franking credits, where domestic funds commonly offer 4-6%+ yields against IVV’s ~1.04% unfranked
- A bond or income-focused fund for stability and steadier cash flow
There is also a quieter option many accumulators overlook. You can sell units periodically to manufacture a cash stream from capital gains rather than waiting on distributions, which suits IVV’s growth orientation far better than treating its yield as income.
The two numbers to hold side by side are the 12.96% five-year annualised total return, which tells the accumulation investor what IVV is actually delivering, and the 1.04% yield, which tells the income investor what they will actually receive in cash. Read together, at a fee of just 0.04% per annum, they make the honest portfolio decision obvious.
Growth engine or income tool? Making the honest call on IVV
The evidence points one way. IVV is primarily a long-term growth vehicle, and its income dimension, while real, is secondary. The distributions are best understood as a by-product of owning quality businesses, not the reason to own them.
The cost structure is the quiet advantage that compounds. At 0.04% per annum, IVV is one of the most cost-effective ways an Australian investor can participate in global business growth, and near-zero fees keep working in your favour for as long as you hold.
S&P 500 return projections from Bank of America’s valuation model suggest cap-weighted annualised returns of -3% to +2% over the coming decade, a range that sits well below the 10% historical average IVV’s five-year track record reflects, and a gap that matters for any accumulation investor modelling long-term outcomes.
So the decision is not “is IVV good or bad.” It is “does IVV match the return I actually need from this allocation.” If you are building long-term wealth and can tolerate US market and currency risk, it earns its place as a core holding. If you need reliable income today, pair it with income-generating alternatives or reconsider whether it belongs at the centre of your portfolio at all.
The variable most likely to change IVV’s income story over time is market leadership. If it rotates away from growth toward higher-yielding sectors, the underlying S&P 500 yield profile could shift, altering IVV’s distributions without any action required from you.
This article is for informational purposes only and should not be considered financial advice. Investors should conduct their own research and consult with financial professionals before making investment decisions. Past performance does not guarantee future results. Financial projections are subject to market conditions and various risk factors.