One of the strongest earnings seasons in memory just wrapped up. Nearly all S&P 500 companies cleared analyst forecasts, with upside surprises averaging 24% and full-year earnings growth running close to 50% on a year-over-year basis. By any historical standard, those are extraordinary numbers.
And yet, Bank of America is warning that investors in the cap-weighted S&P 500 may face negative real returns over the next decade. The apparent contradiction makes sense once you look at the valuation arithmetic: strong trailing earnings have compressed the forward price-to-earnings multiple somewhat, but the index still trades above its 10-year historical average. The earnings that just arrived were exceptional. They are also already in the price.
The question this raises is not whether the market had a good quarter. It did. The question is whether the S&P 500 exposure you already hold is actually the diversified, long-term position you think it is, or whether it is something more concentrated, more expensive, and more dependent on a single thesis than most investors realise. Here is the framework for working that out.
Why record earnings and a decade of potential losses can both be true at the same time
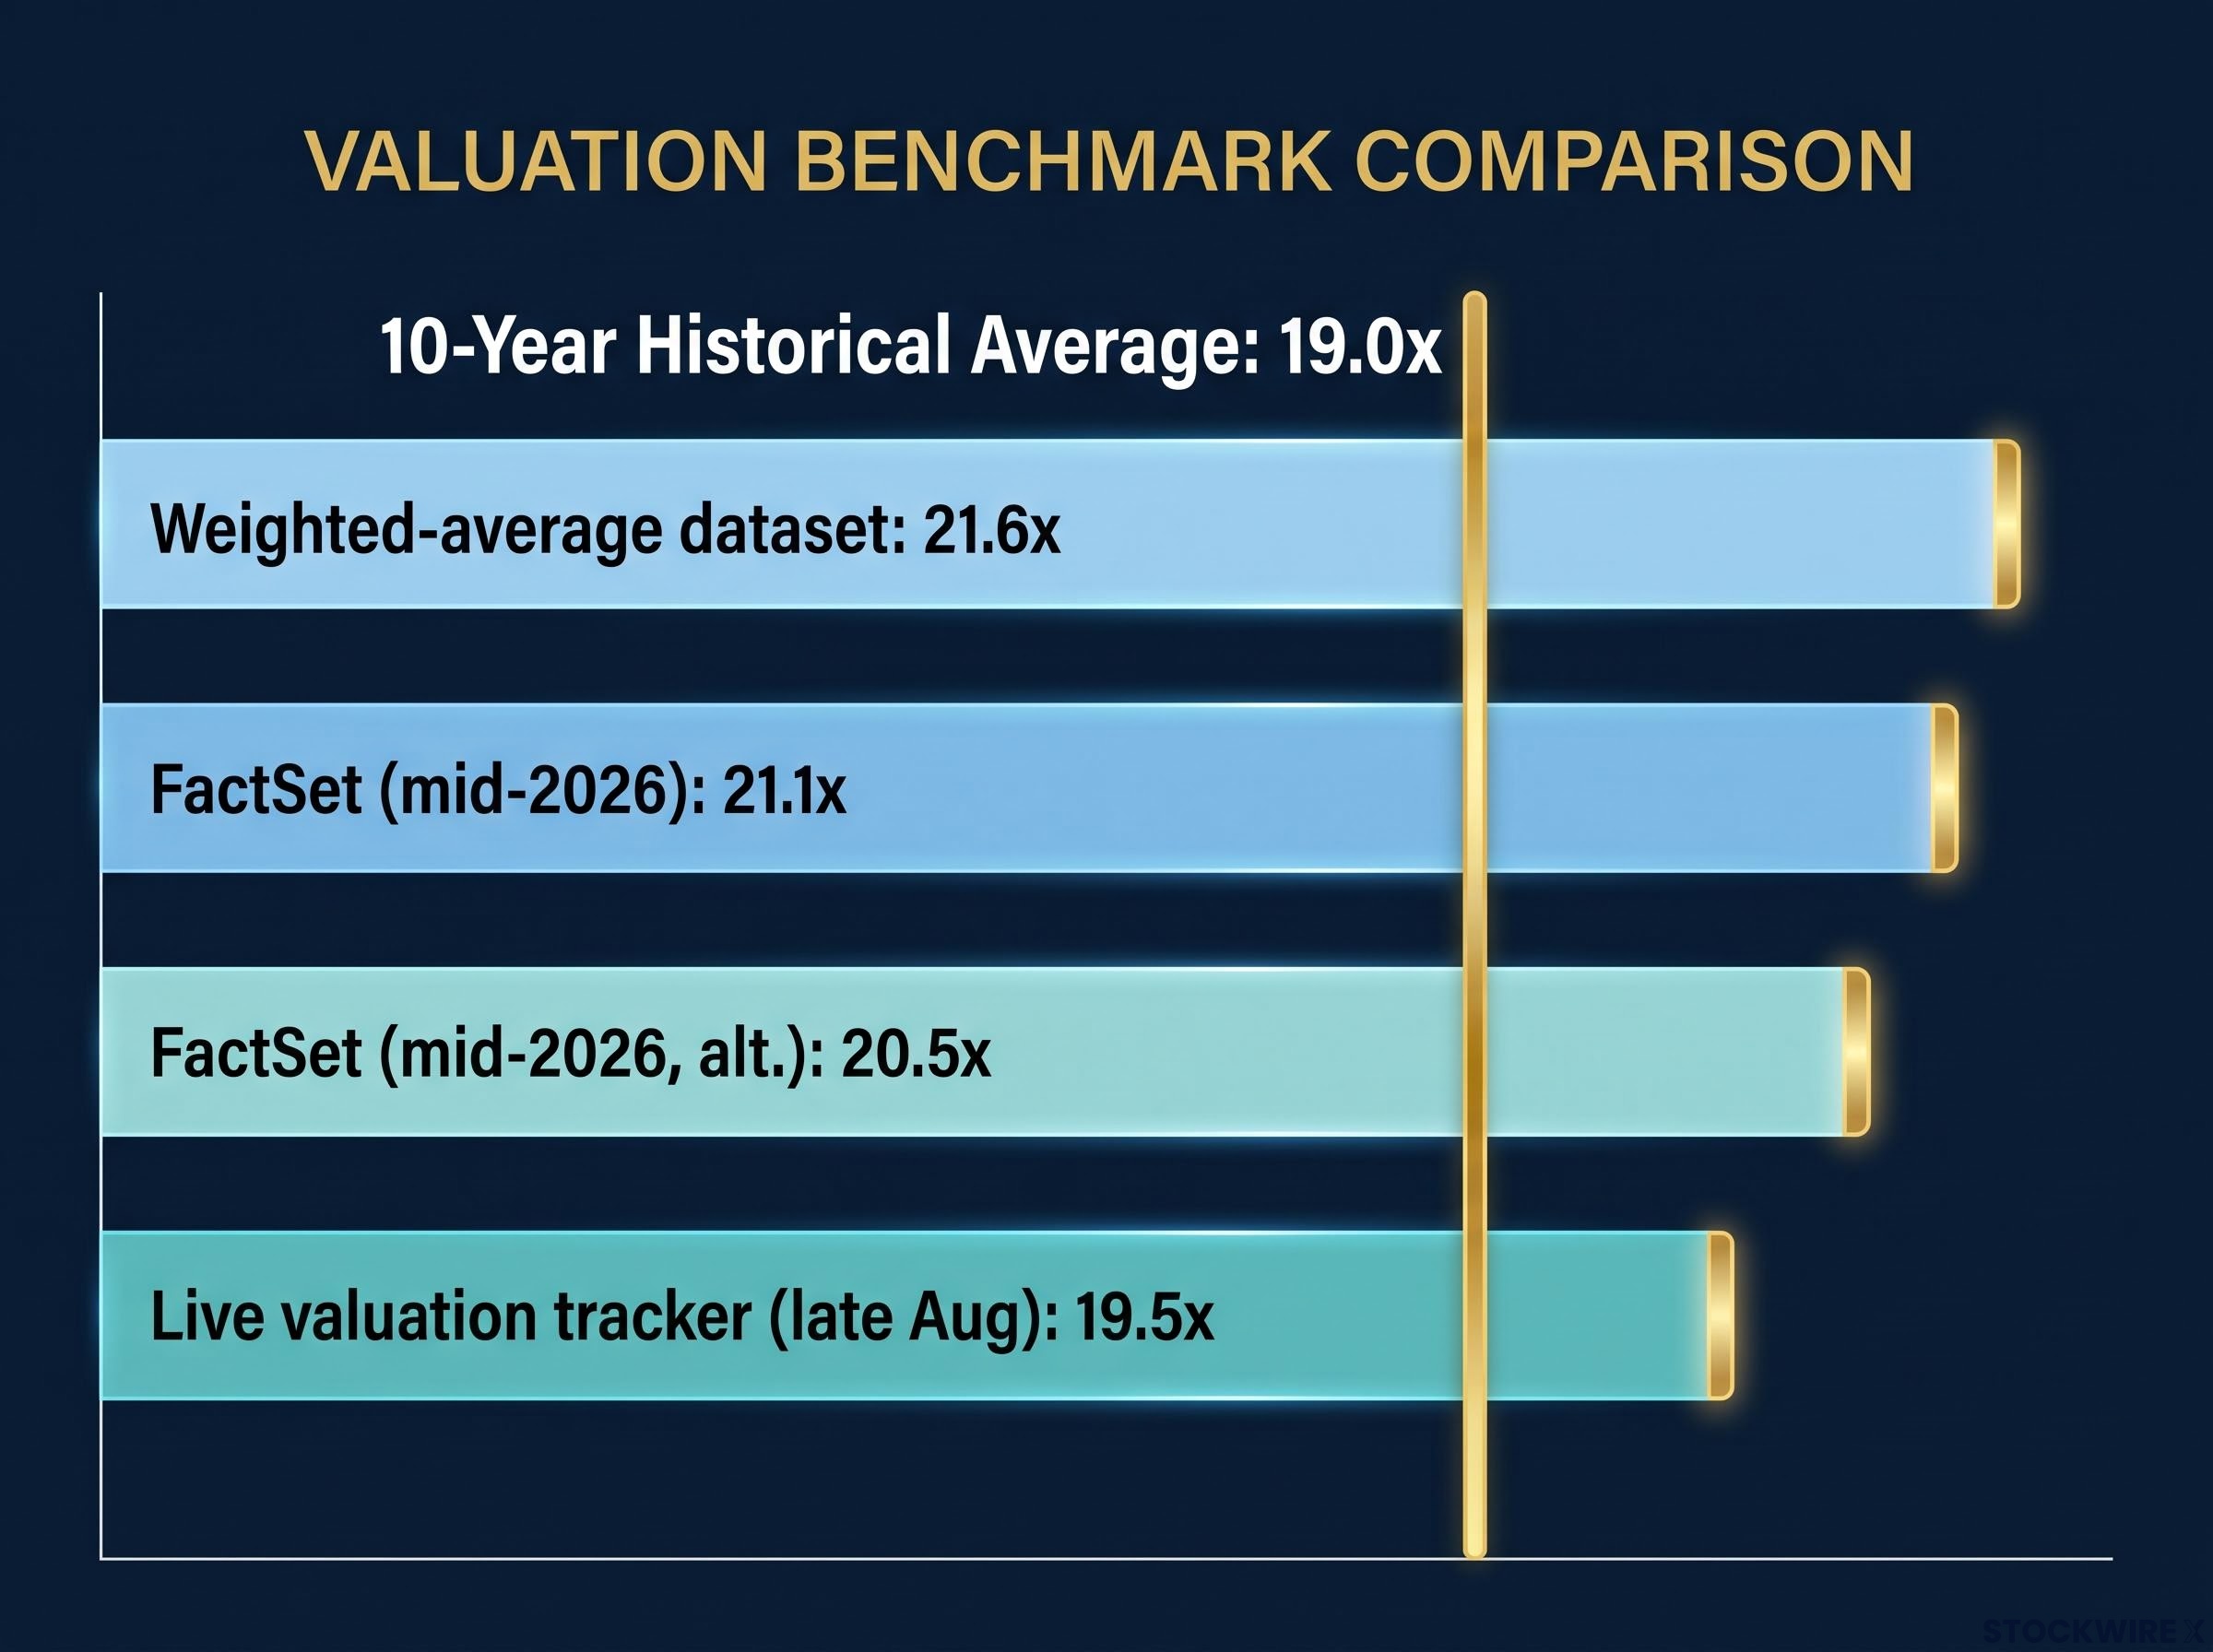
Start with the multiple. Depending on the dataset, the S&P 500’s forward price-to-earnings ratio (the price investors pay today per dollar of expected future earnings) sits between 19.5x and 21.6x as of mid-2026. FactSet’s 12-month forward P/E readings of 21.1x and 20.5x both exceed the 10-year historical average of 19.0x.
| Dataset | Current Forward P/E | 10-Year Historical Average | Premium to Average |
|---|---|---|---|
| FactSet (mid-2026) | 21.1x | 19.0x | +11% |
| FactSet (mid-2026, alt.) | 20.5x | 19.0x | +8% |
| Weighted-average dataset | 21.6x | 19.0x | +14% |
| Live valuation tracker (late Aug) | 19.5x | 19.0x | +3% |
BofA observed that the forward multiple moved from around 22x at the beginning of 2026 down to roughly 20x by August 2026. That sounds like progress, but the driver was earnings rising faster than share prices rather than any outright price decline. The bar for future earnings just moved higher.
Q2 2026 earnings season: the vast majority of S&P 500 companies surpassed EPS forecasts, delivering upside surprises averaging 24% and posting year-over-year earnings growth of approximately 50%, according to Evercore ISI.
Those numbers are not being dismissed. They are being contextualised. Strong past earnings are embedded in today’s price. The return you earn from here depends entirely on what happens next, and what happens next is being purchased at a premium to a decade of historical norms.
Meanwhile, Evercore ISI identified the 10-year Treasury yield at around 4.75% as a level that creates meaningful pressure on equity valuations. A risk-free rate at that level compresses the premium investors can expect from equities, making a 20x-plus multiple harder to justify than it was when rates sat near zero.
The headline euphoria and the structural concern are not in conflict. They are produced by the same set of facts.
When big ASX news breaks, our subscribers know first
What Bank of America’s valuation model is actually projecting, and how to read the numbers honestly
BofA’s long-term valuation model has produced several published outputs, and they do not all land on the same number. Rather than pretending otherwise, here is the range:
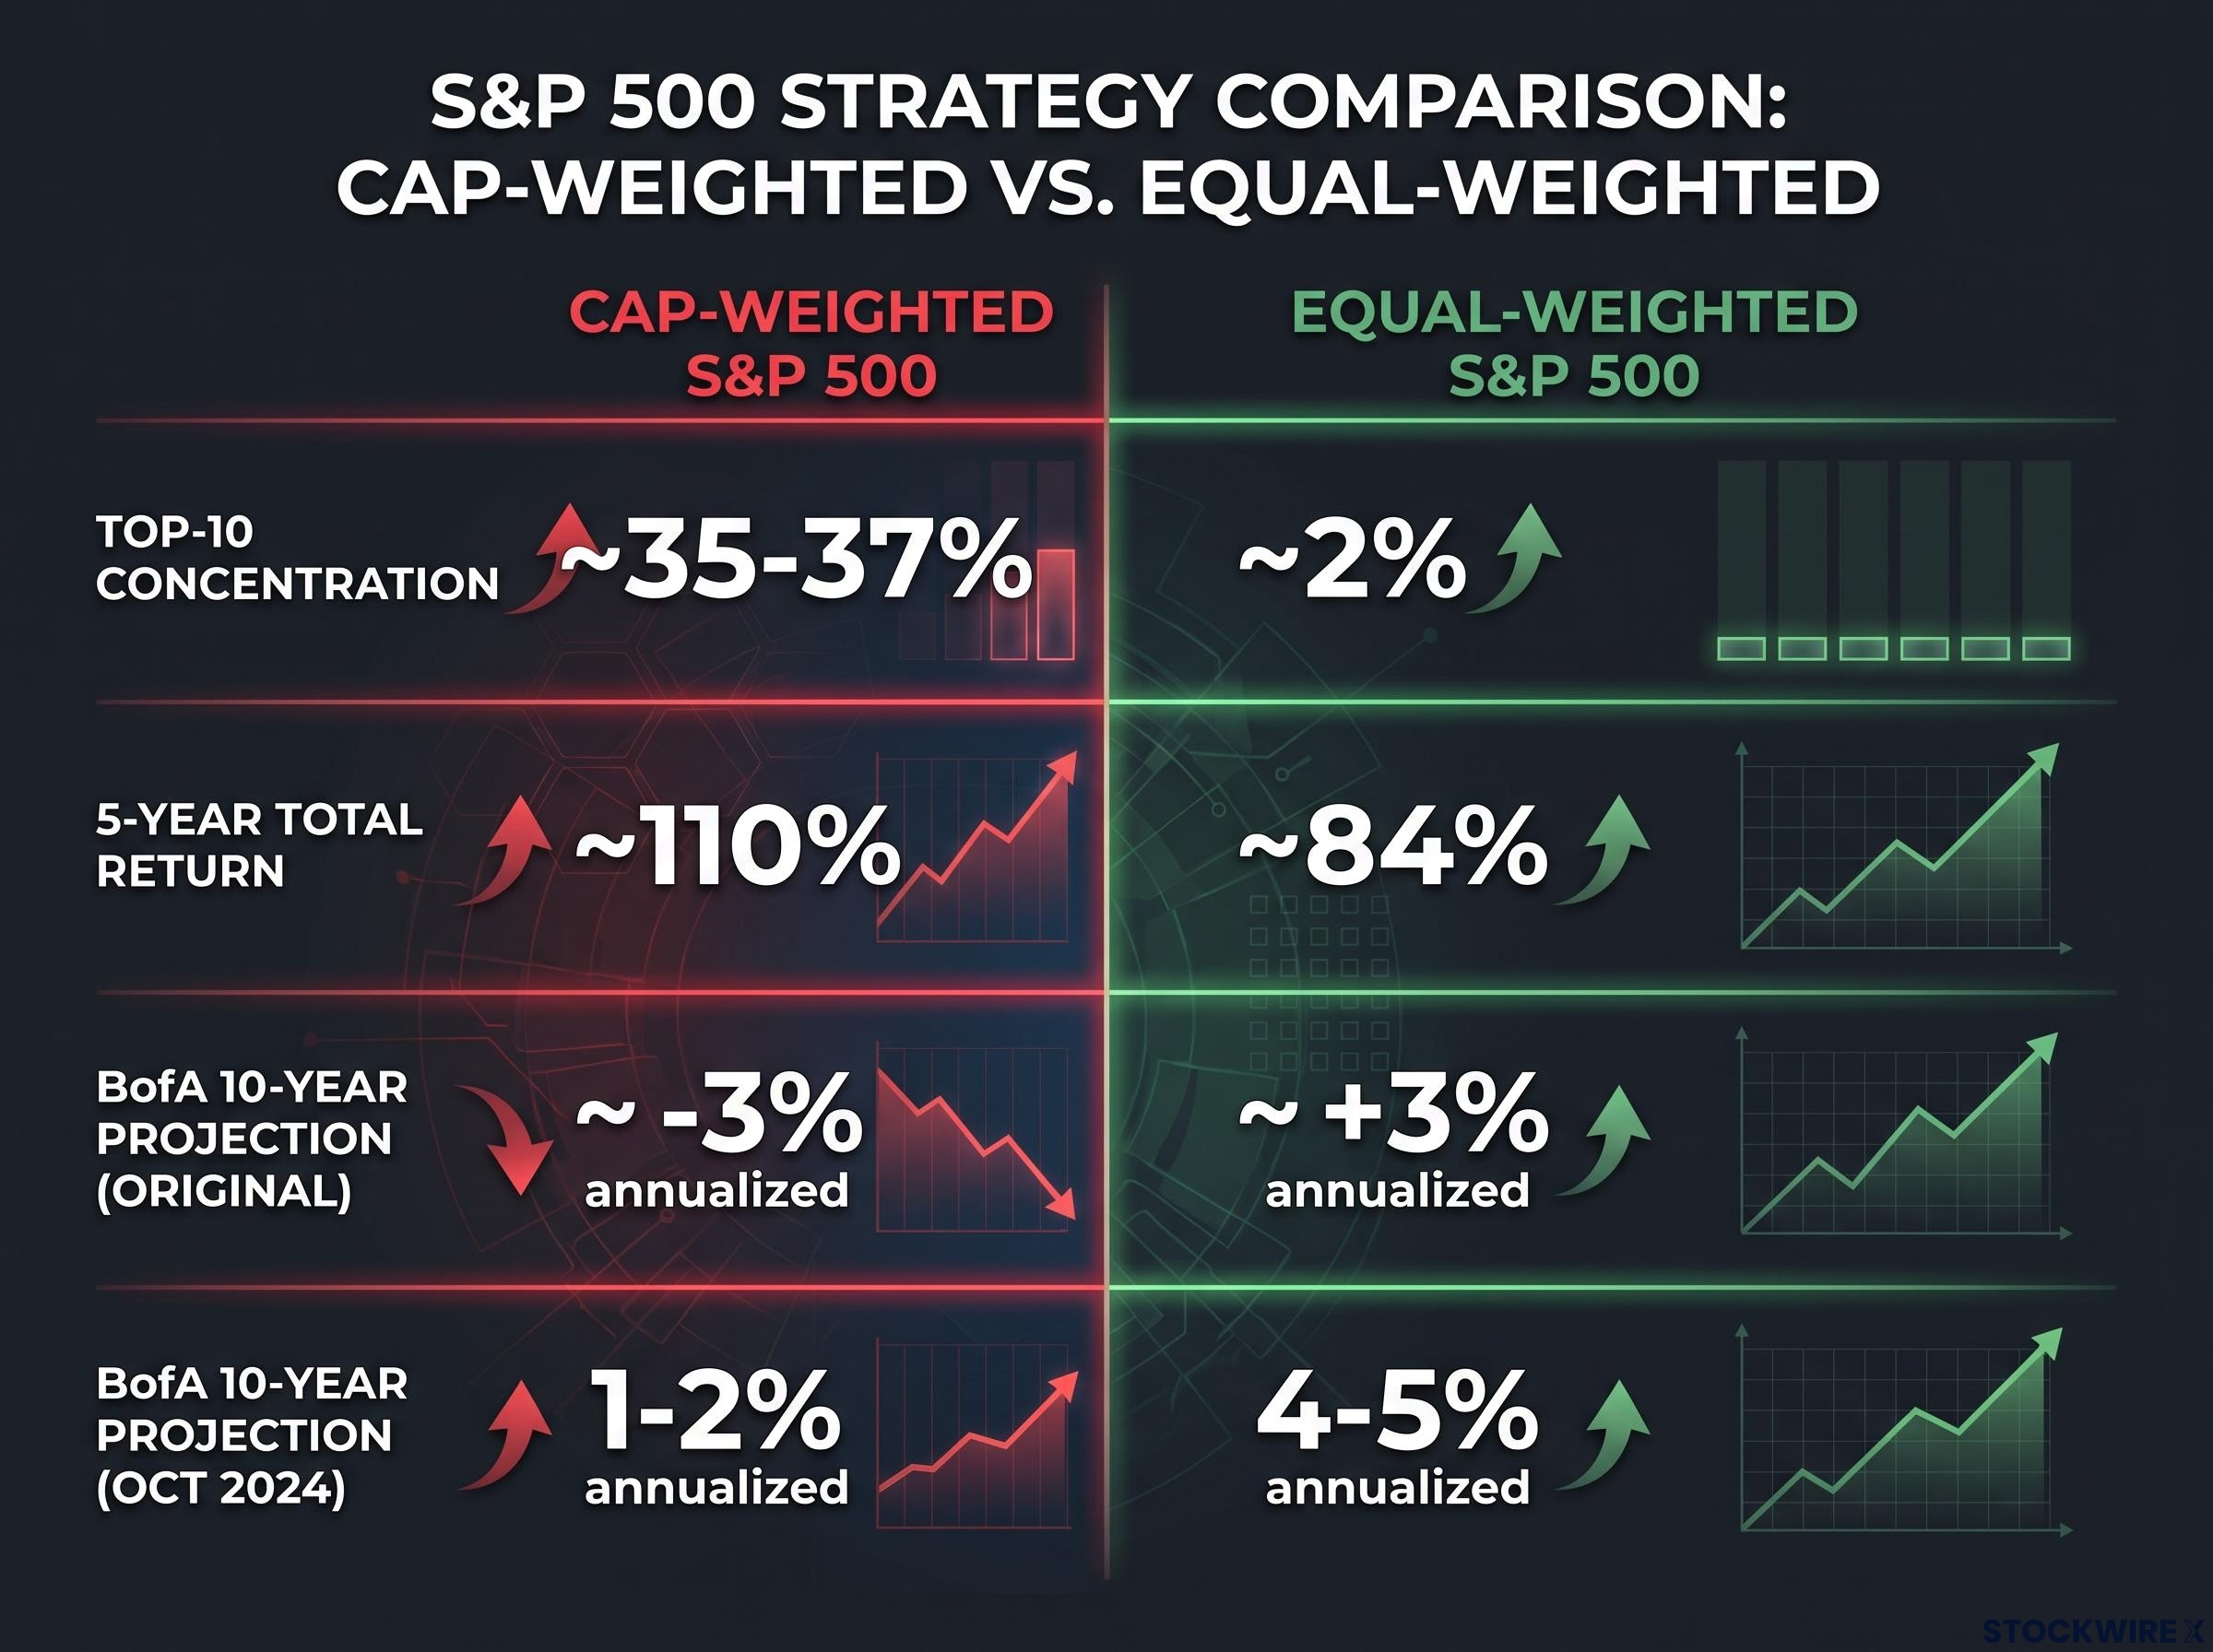
- Original source scenario: BofA’s model points to annualised losses of around -3% for the cap-weighted S&P 500 over a ten-year horizon, with the equal-weighted version faring considerably better at roughly +3% annualised
- BofA public notes (October 2024): approximately 1-2% annualised price return (cap-weighted); approximately 4-5% (equal-weighted)
- BofA “lost decade” framing (December 2025): approximately -0.1% annual total return for the cap-weighted index
- Separate institutional estimate: approximately 3% nominal / approximately 1% real annualised for the S&P 500 over the coming decade
The -3% figure likely reflects a more aggressive mean-reversion scenario, plausible if valuations normalise more fully than BofA’s base case assumes. The near-zero figure represents something closer to a central estimate. The distinction between real and nominal matters here: low single-digit nominal returns can represent genuinely negative purchasing-power returns after inflation.
What the numbers mean in real terms
The range of figures is not a reason to dismiss the projection. It is a reason to understand what even the most optimistic version implies. If BofA’s base case lands at 1-2% annualised price return, that is 6-8 percentage points below the historical 10% annualised average that most U.S. retirement planning models assume. Over a decade, that gap compounds into a material shortfall.
The directional message is consistent across every variant of the model: cap-weighted S&P 500 returns from current valuations are projected to be dramatically lower than the historical average, with better relative prospects in the equal-weighted version. Whether the precise number is -3%, 0%, or +2%, the planning implications point in the same direction.
For investors ready to act on the equal-weight reallocation case, our full explainer on equal-weight ETF trade-offs covers the rebalancing mechanics, fee drag, and currency exposure variables that determine whether the structural benefit translates into net returns for your specific situation.
The concentration problem hiding inside your index fund
Most investors who own an S&P 500 index fund think of it as a bet on the broad U.S. economy. It is not. Cap-weighting means each company’s share of the index is proportional to its market capitalisation (total share price multiplied by shares outstanding). The larger the company, the larger the allocation it commands in your portfolio.
The result is that a small group of megacap names, primarily in technology and AI-related sectors, now represent a substantial share of total index weight. When those few names rise, the index rises. When they fall, the index falls. The other 490-odd companies become supporting actors.
Market concentration at the top of the S&P 500 has reached levels with no modern historical precedent: five companies now control roughly 30% of total U.S. equity market capitalisation, a figure that Goldman Sachs and Morgan Stanley both describe as extreme, and one that amplifies the valuation risk the current multiple already embeds.
The equal-weighted S&P 500 gives each constituent the same allocation regardless of size. Same 500 companies, genuinely diversified exposure.
Why the last five years make the next ten harder to predict
Over the last five years, the cap-weighted index delivered a total return of approximately 110%, compared with approximately 84% for equal-weight. That gap exists because the megacap growth names that dominate the cap-weighted index outperformed everything else.
| Dimension | Cap-Weighted S&P 500 | Equal-Weighted S&P 500 |
|---|---|---|
| 5-year total return | ~110% | ~84% |
| Long-term edge (since 1990) | Lower | Higher |
| Return concentration | Driven by a handful of megacaps | Spread across all 500 names |
| Top-10 concentration (approx.) | ~35-37% of index weight | ~2% of index weight |
Here is the circularity problem: the outperformance that made cap-weighted look superior over the last five years was driven by megacap concentration. That concentration pushed those names to higher valuations, which is precisely what makes the next decade’s prospective return lower. Equal-weight’s recent underperformance is not a structural failure of the strategy; it is a sign that the megacap cycle has been exceptional. Exceptional cycles mean-revert.
BofA noted that the factors previously used to justify elevated megacap multiples, principally robust corporate balance sheets and reliable earnings visibility, have since weakened. If you hold a cap-weighted S&P 500 fund, a very large share of your bet is a single concentrated thesis about a small group of companies continuing to outperform at elevated prices.
What the near-term environment adds to a long-term concern
The structural valuation case does not depend on a near-term catalyst. But the current macro environment does not argue against caution either.
Evercore ISI identified several near-term headwinds following the conclusion of the Q2 2026 earnings season:
- Once exceptional year-over-year earnings growth begins to fade, markets typically enter a period of choppiness
- A 10-year Treasury yield sitting around 4.75% squeezes the return premium available from equities over bonds
- Ongoing military tensions involving Iran are lifting energy costs and introducing uncertainty into earnings forecasts
- Elevated investor complacency as autumn seasonality approaches, compounded by uncertainty around the midterm elections
The 4.75% 10-year Treasury yield is particularly significant for valuation theory. When the risk-free rate is near 5%, investors can earn a meaningful return from bonds without taking equity risk. That makes a 20x-plus forward P/E on stocks harder to justify; the premium you earn for accepting equity volatility has thinned considerably.
None of these factors change the decade-long valuation arithmetic on their own. What they do is remove several of the conditions that previously made elevated multiples defensible. Investors waiting for a clear signal before reconsidering their allocation may be making a structural error: the long-term return headwind is already baked into prices, and near-term noise is unlikely to change the maths.
Portfolio moves that respond to the valuation math without abandoning equities
The evidence does not call for abandoning equities. It calls for examining whether the specific vehicle you use to hold equities is appropriate for the next decade’s starting conditions. Three categories of response move from most direct to broadest:
- Equal-weight reallocation within U.S. large-cap. The same 500 companies, stripped of megacap concentration. BofA’s models project +3% to +4-5% annualised for equal-weight over the next decade, depending on the scenario, a materially better starting point than cap-weighted. The honest trade-offs: higher turnover, slightly higher volatility, and you need the willingness to accept years of relative underperformance when megacap cycles run, as the last five years demonstrated.
- International developed market diversification. International developed markets trade at materially lower multiples than the cap-weighted U.S. large-cap index. Institutional research consistently cites these markets as offering comparatively better long-term return prospects at current price levels.
International diversification offers a quantitative foundation beyond the general principle: the MSCI Europe Index trades at roughly a 31% discount to the S&P 500 on forward earnings multiples, and STOXX Europe 600 companies are projected to distribute approximately 454 billion euros in dividends in 2026, providing a materially different starting valuation and income profile than the concentrated U.S. large-cap index.
- Value and quality tilts within U.S. equities. U.S. value segments also trade at lower multiples and provide exposure to different earnings drivers than the growth-heavy cap-weighted index.
A note for investors near retirement
The prospect of 1-3% nominal annual returns, with potentially negative real returns, creates a specific problem for investors near or in retirement. Sequence-of-returns risk (the risk that early losses during the withdrawal phase permanently reduce a portfolio’s longevity) is elevated when starting valuations are high and expected returns are compressed.
A retirement plan built on 10% annualised equity returns looks very different if the next decade delivers 1-3% nominal. That is not a reason to panic. It is a reason to pressure-test your withdrawal rate, your rebalancing schedule, and your bond allocation against a more conservative equity return assumption.
This article is for informational purposes only and should not be considered financial advice. Investors should conduct their own research and consult with financial professionals before making investment decisions. Past performance does not guarantee future results. Financial projections are subject to market conditions and various risk factors.
What investors should actually take from BofA’s decade warning
The gap between cap-weighted and equal-weighted projected returns is not an argument for leaving the market. It is an argument for looking inside the vehicle you use to access it. Whether BofA’s model lands at -3%, 0%, or +2% annualised for the cap-weighted index, every variant produces a number dramatically below the 10% historical average that most U.S. investors implicitly rely on.
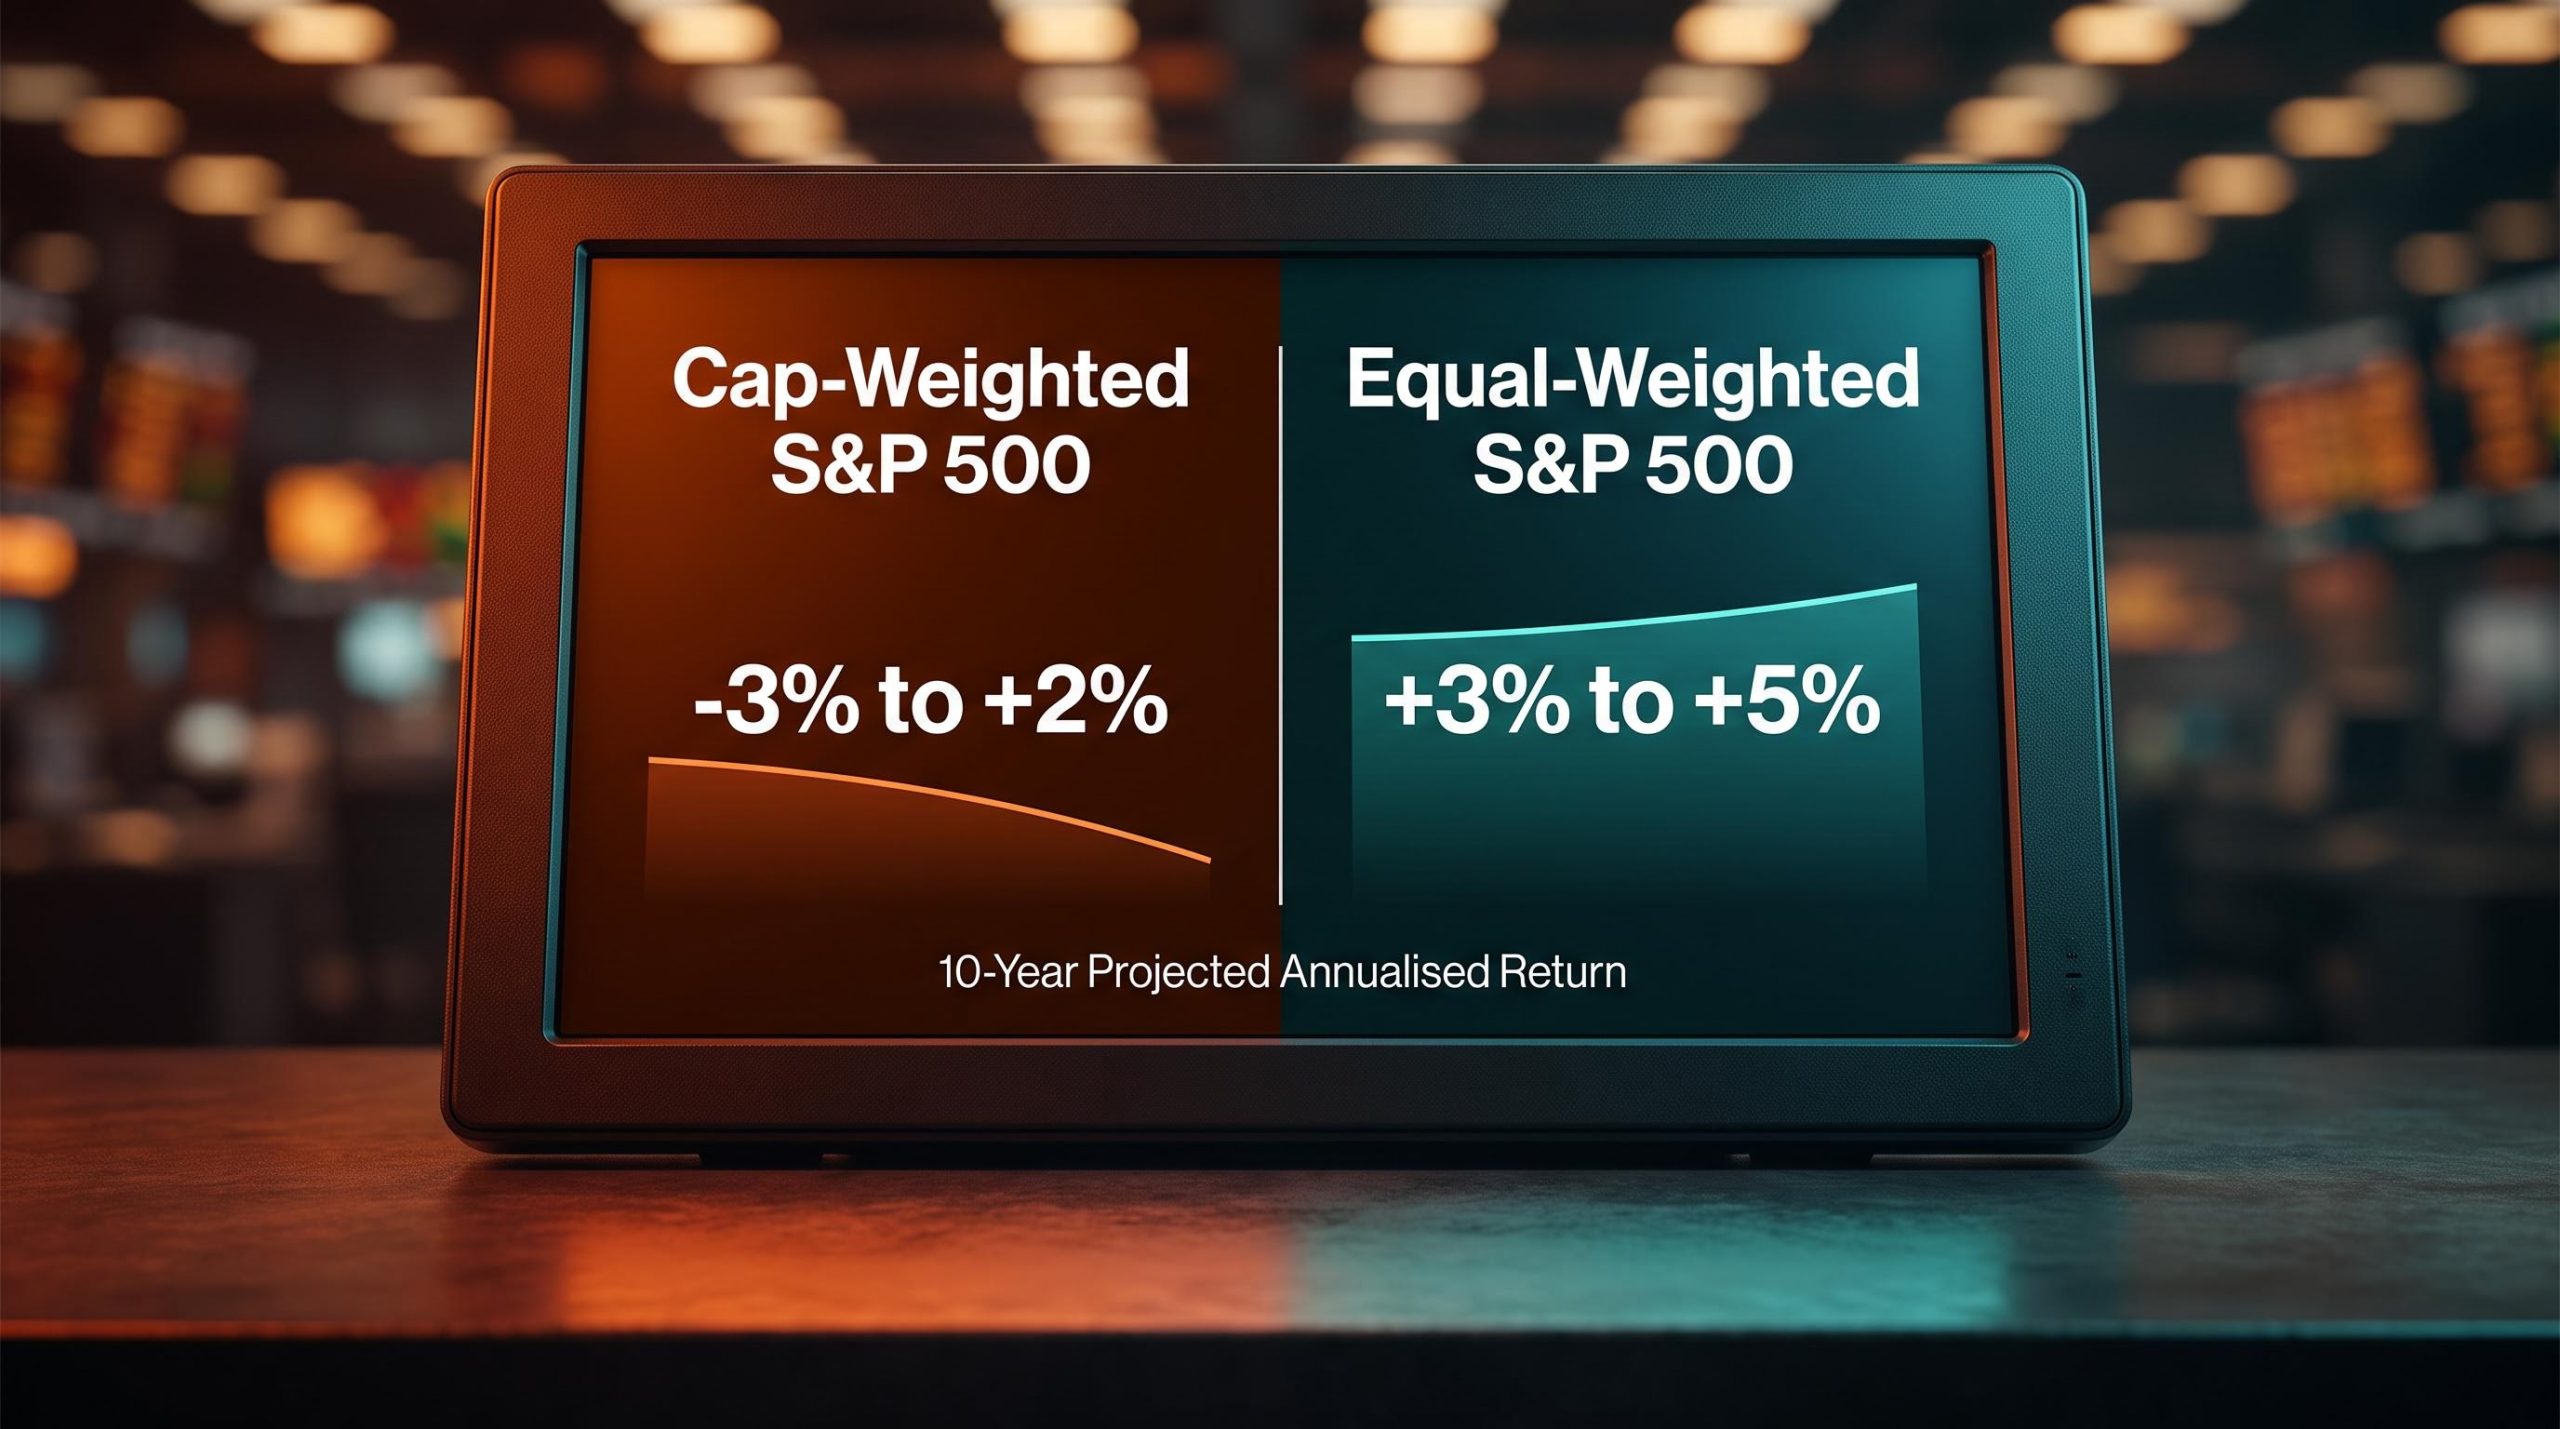
The core spread: BofA’s long-term model points to cap-weighted S&P 500 annualised returns ranging from -3% to +2% over the coming decade, compared with +3% to +5% for the equal-weighted version. The gap, not the precise number, is the actionable finding.
No 10-year model can anticipate every variable that will shape actual outcomes. The range of published figures reflects genuine scenario uncertainty, not analytical error. The question for you is not whether BofA’s model is precisely right, but whether your portfolio would remain adequate if it is approximately right.
If your equity returns over the next decade are 1-3% nominal rather than 8-10%, what does that mean for your specific plan? If you have not explicitly thought about that, the valuation maths suggests now is a reasonable time to start.