The US labour market just posted its sixth straight month of payroll growth, unemployment is holding at 4.1%, and companies are still hiring. Yet consumer sentiment is sour, personal consumption expenditures inflation is sitting above the Federal Reserve’s target, and Brent crude has punched above $100 on Middle East war risk. Three signals, three directions.
For investors trying to read US economic data, that divergence is the whole problem. Strong jobs point one way, sticky inflation another, and a geopolitical oil spike a third. Treat any one of them as the master signal and the other two will mislead you.
The timing sharpens the stakes. August PCE lands on 1 October 2026 and September payrolls follow on 2 October, so these releases will hit in real time. You need the interpretive frame before the numbers arrive, not after the headlines have already moved the market.
Here is how to read each of these signals without confusing a lagging confirmation for a forward forecast, and how to hold all three together when the data starts landing this week.
Six months of job growth tells you where the economy has been, not where it is going
The headline is genuinely strong. August non-farm payrolls expanded by 162,000 positions, according to the US Bureau of Labor Statistics Employment Situation report released on 4 September 2026, with unemployment steady at 4.1%. That is six consecutive months of expansion, and the September figures arrive on 2 October.
The problem is what that streak can and cannot tell you.
Payrolls are a lagging indicator. Fisher Investments characterises jobs data as reflecting conditions that have already occurred rather than forecasting where the economy is heading.
The lag that trips up investors Fisher Investments frames employment data as backward-looking: it confirms where the cycle currently stands, but it does not predict future direction. Strong payrolls can persist right up until a contraction begins.
The mechanism matters. Businesses typically slow hiring and trim hours before they cut headcount, which means payrolls can keep growing modestly even as the economy loses momentum underneath. A six-month streak confirms the economy was expanding through August. It does not tell you September or the fourth quarter will look the same, and if you treat it as forward-looking permission to overweight cyclicals, you are reading the wrong signal.
Why sentiment surveys and payroll reports can diverge sharply
Households report pessimism while continuing to spend, and companies keep hiring to meet that demand. Three plain mechanisms explain the gap.
First, the hiring-before-firing sequence: firms cut hours and freeze recruitment long before layoffs, so headline payrolls stay positive even as confidence sinks. Second, spending endures because households draw on accumulated savings, wage growth, and credit, sustaining demand and, by extension, labour demand. Third, sectoral rebalancing does the rest, with strength in services and government employment offsetting softness in interest-sensitive sectors.
Research teams at Goldman Sachs and JPMorgan have stressed that sentiment indicators are noisy and coloured by inflation and politics, whereas hard data on employment and spending reflect what people actually do. Resilient jobs and a sour mood can coexist.
That said, some economists argue the strength is thinner than it looks. Beneath the headline, these are the sub-surface signals worth watching:
- Rising underemployment, where workers take roles below their skill or hours preference
- Elevated multiple-job-holding, a sign households are stretching to maintain income
- A deteriorating job-openings trend, which softens before headline payrolls do
- Downward earnings revisions, which flag corporate caution ahead of hiring cuts
Watch those, not the headline, for where the labour market is heading next.
When big ASX news breaks, our subscribers know first
Inflation is cooling, but the last mile from 3.7% to 2% is where the debate lives
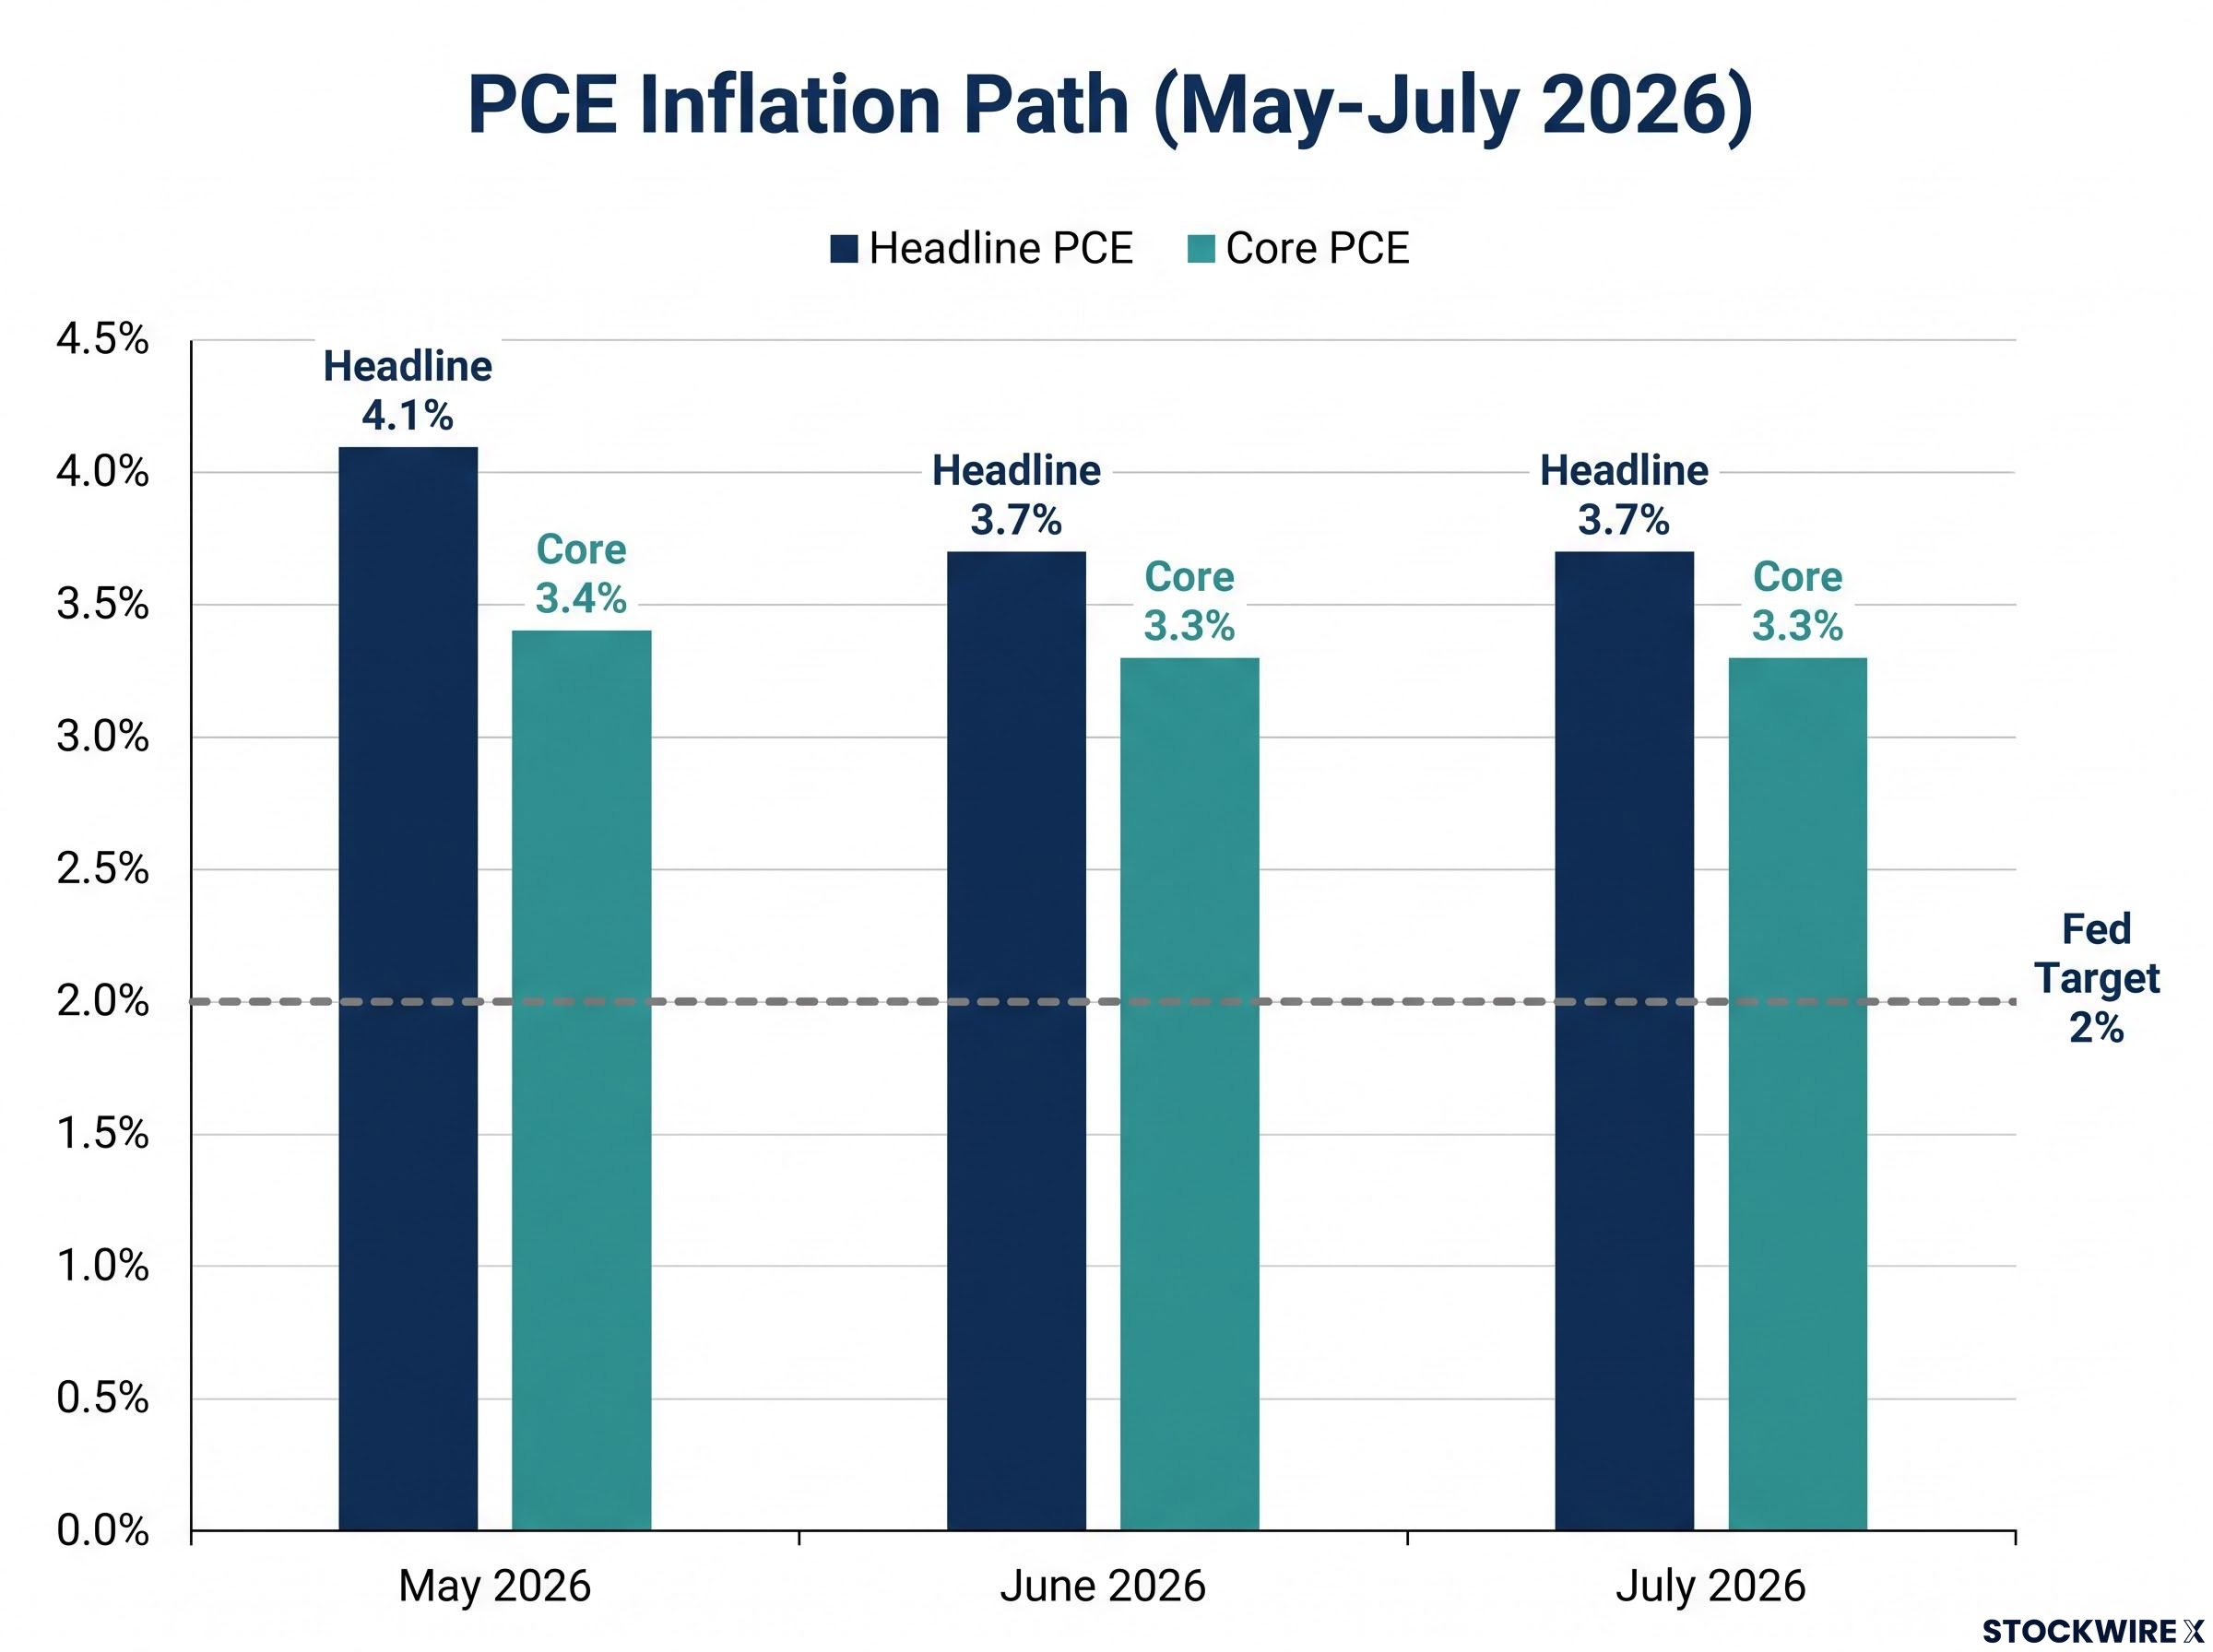
The disinflation is real. Headline PCE fell from 4.1% in May 2026 to 3.7% in July, unchanged from June. Core PCE, which strips out volatile food and energy prices to show the underlying trend, eased to 3.3% in July, flat with June and just below May’s 3.4%.
| Month (2026) | Headline PCE YoY | Core PCE YoY |
|---|---|---|
| May | 4.1% | 3.4% |
| June | 3.7% | 3.3% |
| July | 3.7% | 3.3% |
The direction is clear. The disagreement is over the last leg, the stretch from 3.7% down to the Fed’s 2% target, and that is where professional forecasters split into two camps.
The soft-landing camp reads the moderating readings as proof that restrictive policy worked without breaking the economy. Slowing wage growth and easing shelter and core goods inflation, on this view, show the underlying dynamics moving the right way, with the lagged effects of past rate hikes still filtering through. Hold rates, then ease later, and the landing sticks.
The higher-for-longer camp counters that 3.7% headline and 3.3% core remain well above target, and that elevated energy prices could re-accelerate the headline number. Ease too soon, they warn, and you reignite inflation that has only partly cooled.
The genuine points of contention come down to three questions:
- How much weight to give energy-driven swings in headline inflation versus the trend in core measures
- Whether a resilient labour market is compatible with a durable return to 2%, or implies demand that keeps prices sticky
- How far structural shifts, from geopolitics to deglobalisation, have changed the inflation regime itself
This is not a US-only debate. Eurozone inflation registered 3.2% in August 2026, showing the same last-mile pattern across the Atlantic.
Why the exact Fed move may matter less than you think Fisher Investments considers incremental Federal Reserve rate adjustments, up or down, as unlikely to be decisive for market performance on their own.
The August PCE release on 1 October is the immediate test. Approach it knowing which direction of surprise matters: a downside print extends the disinflation story, while an upside surprise, especially in core, hands the higher-for-longer camp its evidence.
What oil above $100 actually means, and what it does not
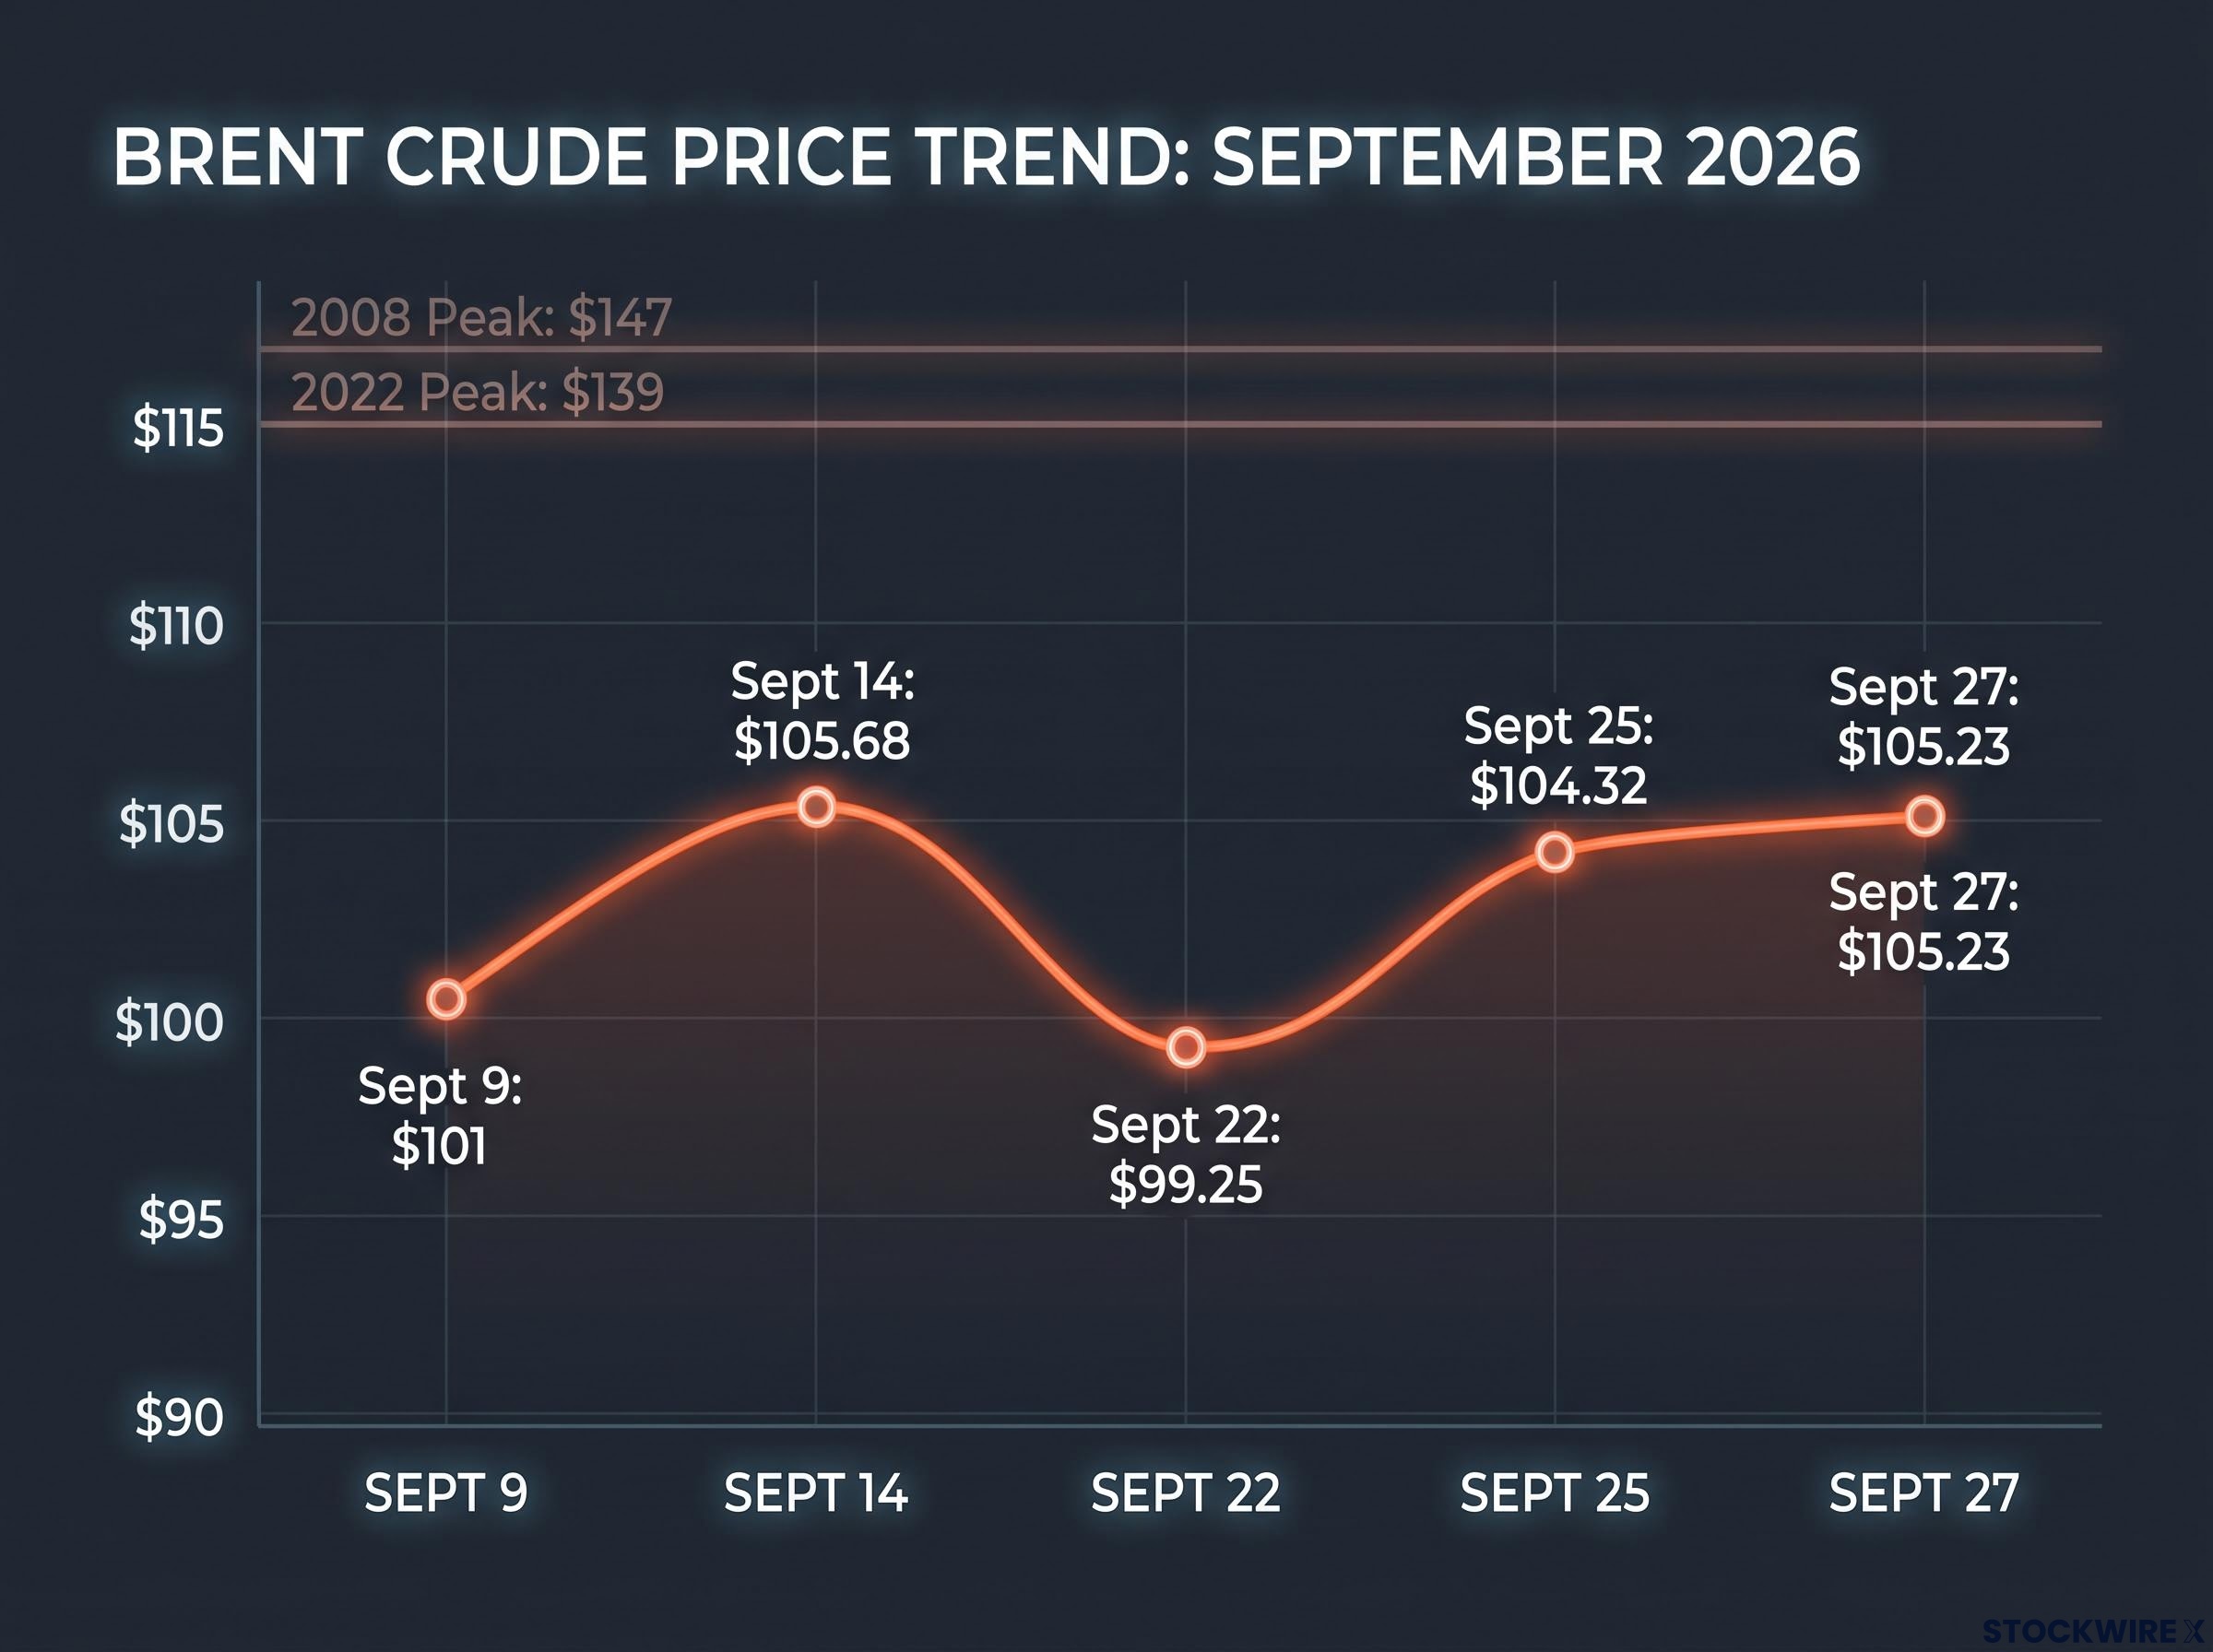
The price action has been dramatic. On 9 September, Iran and the US struck tankers in what Reuters described as the biggest wave of attacks on shipping since the war began, pushing Brent above $100 to around $101. Five days later, fresh strikes on Saudi energy infrastructure sent Brent to roughly $105.68 and WTI to about $101.39.
Prices then settled into the low-to-mid $100s, swinging on truce hopes and supply news.
| Date (2026) | Brent Approx. Price | Key Driver |
|---|---|---|
| 9 September | $101 | Iran-US tanker exchange |
| 14 September | $105.68 | Strikes on Saudi energy infrastructure |
| 22 September | $99.25 | Truce hopes, easing back below $100 |
| 25 September | $104.32 | Renewed supply-risk pricing |
| 27 September | $105.23 | Sustained Gulf tension |
Alarming in isolation. Less so in context. Brent peaked near $147 in 2008 and $139 in 2022, so today’s levels, while elevated, sit below both nominal prior peaks. Adjusted for inflation, the real burden is lighter still.
More importantly, the pass-through to broader inflation has been limited. Credible anti-inflation policy keeps expectations anchored, so wage-setting does not fully absorb the energy shock and second-round effects stay contained. Energy’s share of total consumption, while meaningful, is not large enough to propagate the whole shock into the wider price level. And Fisher Investments notes that businesses have limited capacity to pass elevated fuel costs on to consumers at scale.
What the market is actually pricing Reuters reported that oil topping $100 “raised fears of inflationary pressures and higher energy costs for consumers and businesses,” even as the spike has not yet produced durable core inflation acceleration.
So the price level is not the right question. The right question is whether the disruption is transient or structural, because there are specific scenarios where the limited pass-through would break down:
- A prolonged Strait of Hormuz disruption that pushes Brent well beyond recent levels and holds it there, feeding energy costs into wages and non-energy prices
- A sustained supply shock that forces central banks to choose between defending inflation targets and supporting growth, directly complicating the soft-landing story
- Emerging-market financial stress from a lasting shock, propagating back into developed markets through trade and financial links
Fisher Investments observes that markets have increasingly adjusted to Gulf supply disruptions, which helps explain why the 2026 spikes above $100 have not held. That is the calibrated read: watch the duration, not the daily number.
How to read all three signals together without confusing confirmation for prediction
Here is where the analysis becomes a process you can use. The foundational principle is simple: labour data tells you where the cycle has been, leading indicators tell you where it is going, and each should be used only for its correct job.
For energy, the distinction is between geopolitically driven moves, which are often transient and warrant a measured response, and supply-structurally driven moves, which are persistent and warrant genuine portfolio reassessment.
When a release lands, run it through this sequence:
- Classify the signal type. Is it a lagging confirmation (payrolls), a leading indicator, a transient shock, or a structural shift?
- Assess the directional thesis. Does it actually change the view you already hold, or merely confirm it?
- Assess proportionality. How large a response, if any, does the change justify?
- Act or hold. Adjust in proportion to what genuinely changed, or do nothing.
For step one, these are the leading indicators to monitor as the forward-looking counterweight to lagging payroll data:
- New orders, which signal demand ahead of production and hiring
- Credit conditions, which shape borrowing and investment
- Earnings revisions, which flag corporate expectations
- The job-openings trend, which softens before headline payrolls do
Fisher Investments frames the practical response as maintaining diversification across sectors and regions, and treating inflation-hedging assets and energy exposure as risk-management tools calibrated to the duration of a shock, not the size of any single day’s price move.
The two symmetric errors that cost investors most
Both directions of overreaction cost money. Treat every spike as a new regime and you over-trade, taking whipsaw losses as prices retreat, exactly the trap the September oil sequence set for anyone who chased Brent above $100 only to watch it slip back below within two weeks.
Ignore energy entirely and you leave the portfolio exposed if the shock proves lasting. The judgement call, transient versus structural, is the whole game. Get the classification right and the position sizing follows.
What the next two weeks will clarify, and what they will not
The framework meets its first live test almost immediately. Three releases land in three days, and each answers a narrow question rather than the big one.
| Date (2026) | Release | What It Can Clarify |
|---|---|---|
| 1 October | August PCE (Bureau of Economic Analysis) | Whether July’s 3.7% was a further leg down or a plateau |
| 2 October | September Employment Situation (BLS) | Whether the 162,000 run-rate held into September |
| 3 October | Eurozone September preliminary inflation | Whether the transatlantic last-mile pattern persists |
September payrolls will add one data point to the six-month trend, but they will not solve the lagging indicator problem. A strong print does not confirm durability, and a weak one does not confirm deterioration. August PCE will show whether disinflation is still moving, with the core reading mattering more than the headline for policy.
Here is what these releases will not resolve:
- The lagging indicator problem, which no single payroll print can fix
- The structural inflation debate, which the last mile keeps alive
- The geopolitical oil trajectory, which depends on events, not data calendars
Stay in the analytical stance. Classify each signal before reacting to it, resist reclassifying in real time on a single number, and keep the integrated framework as the lens. Two weeks of data will sharpen the direction, but the deeper question, whether the soft landing holds, is the one that should organise portfolio thinking through the fourth quarter.
This article is for informational purposes only and should not be considered financial advice. Investors should conduct their own research and consult with financial professionals before making investment decisions.
Past performance does not guarantee future results. Financial projections are subject to market conditions and various risk factors. Forward-looking statements are speculative and subject to change based on market developments.
—