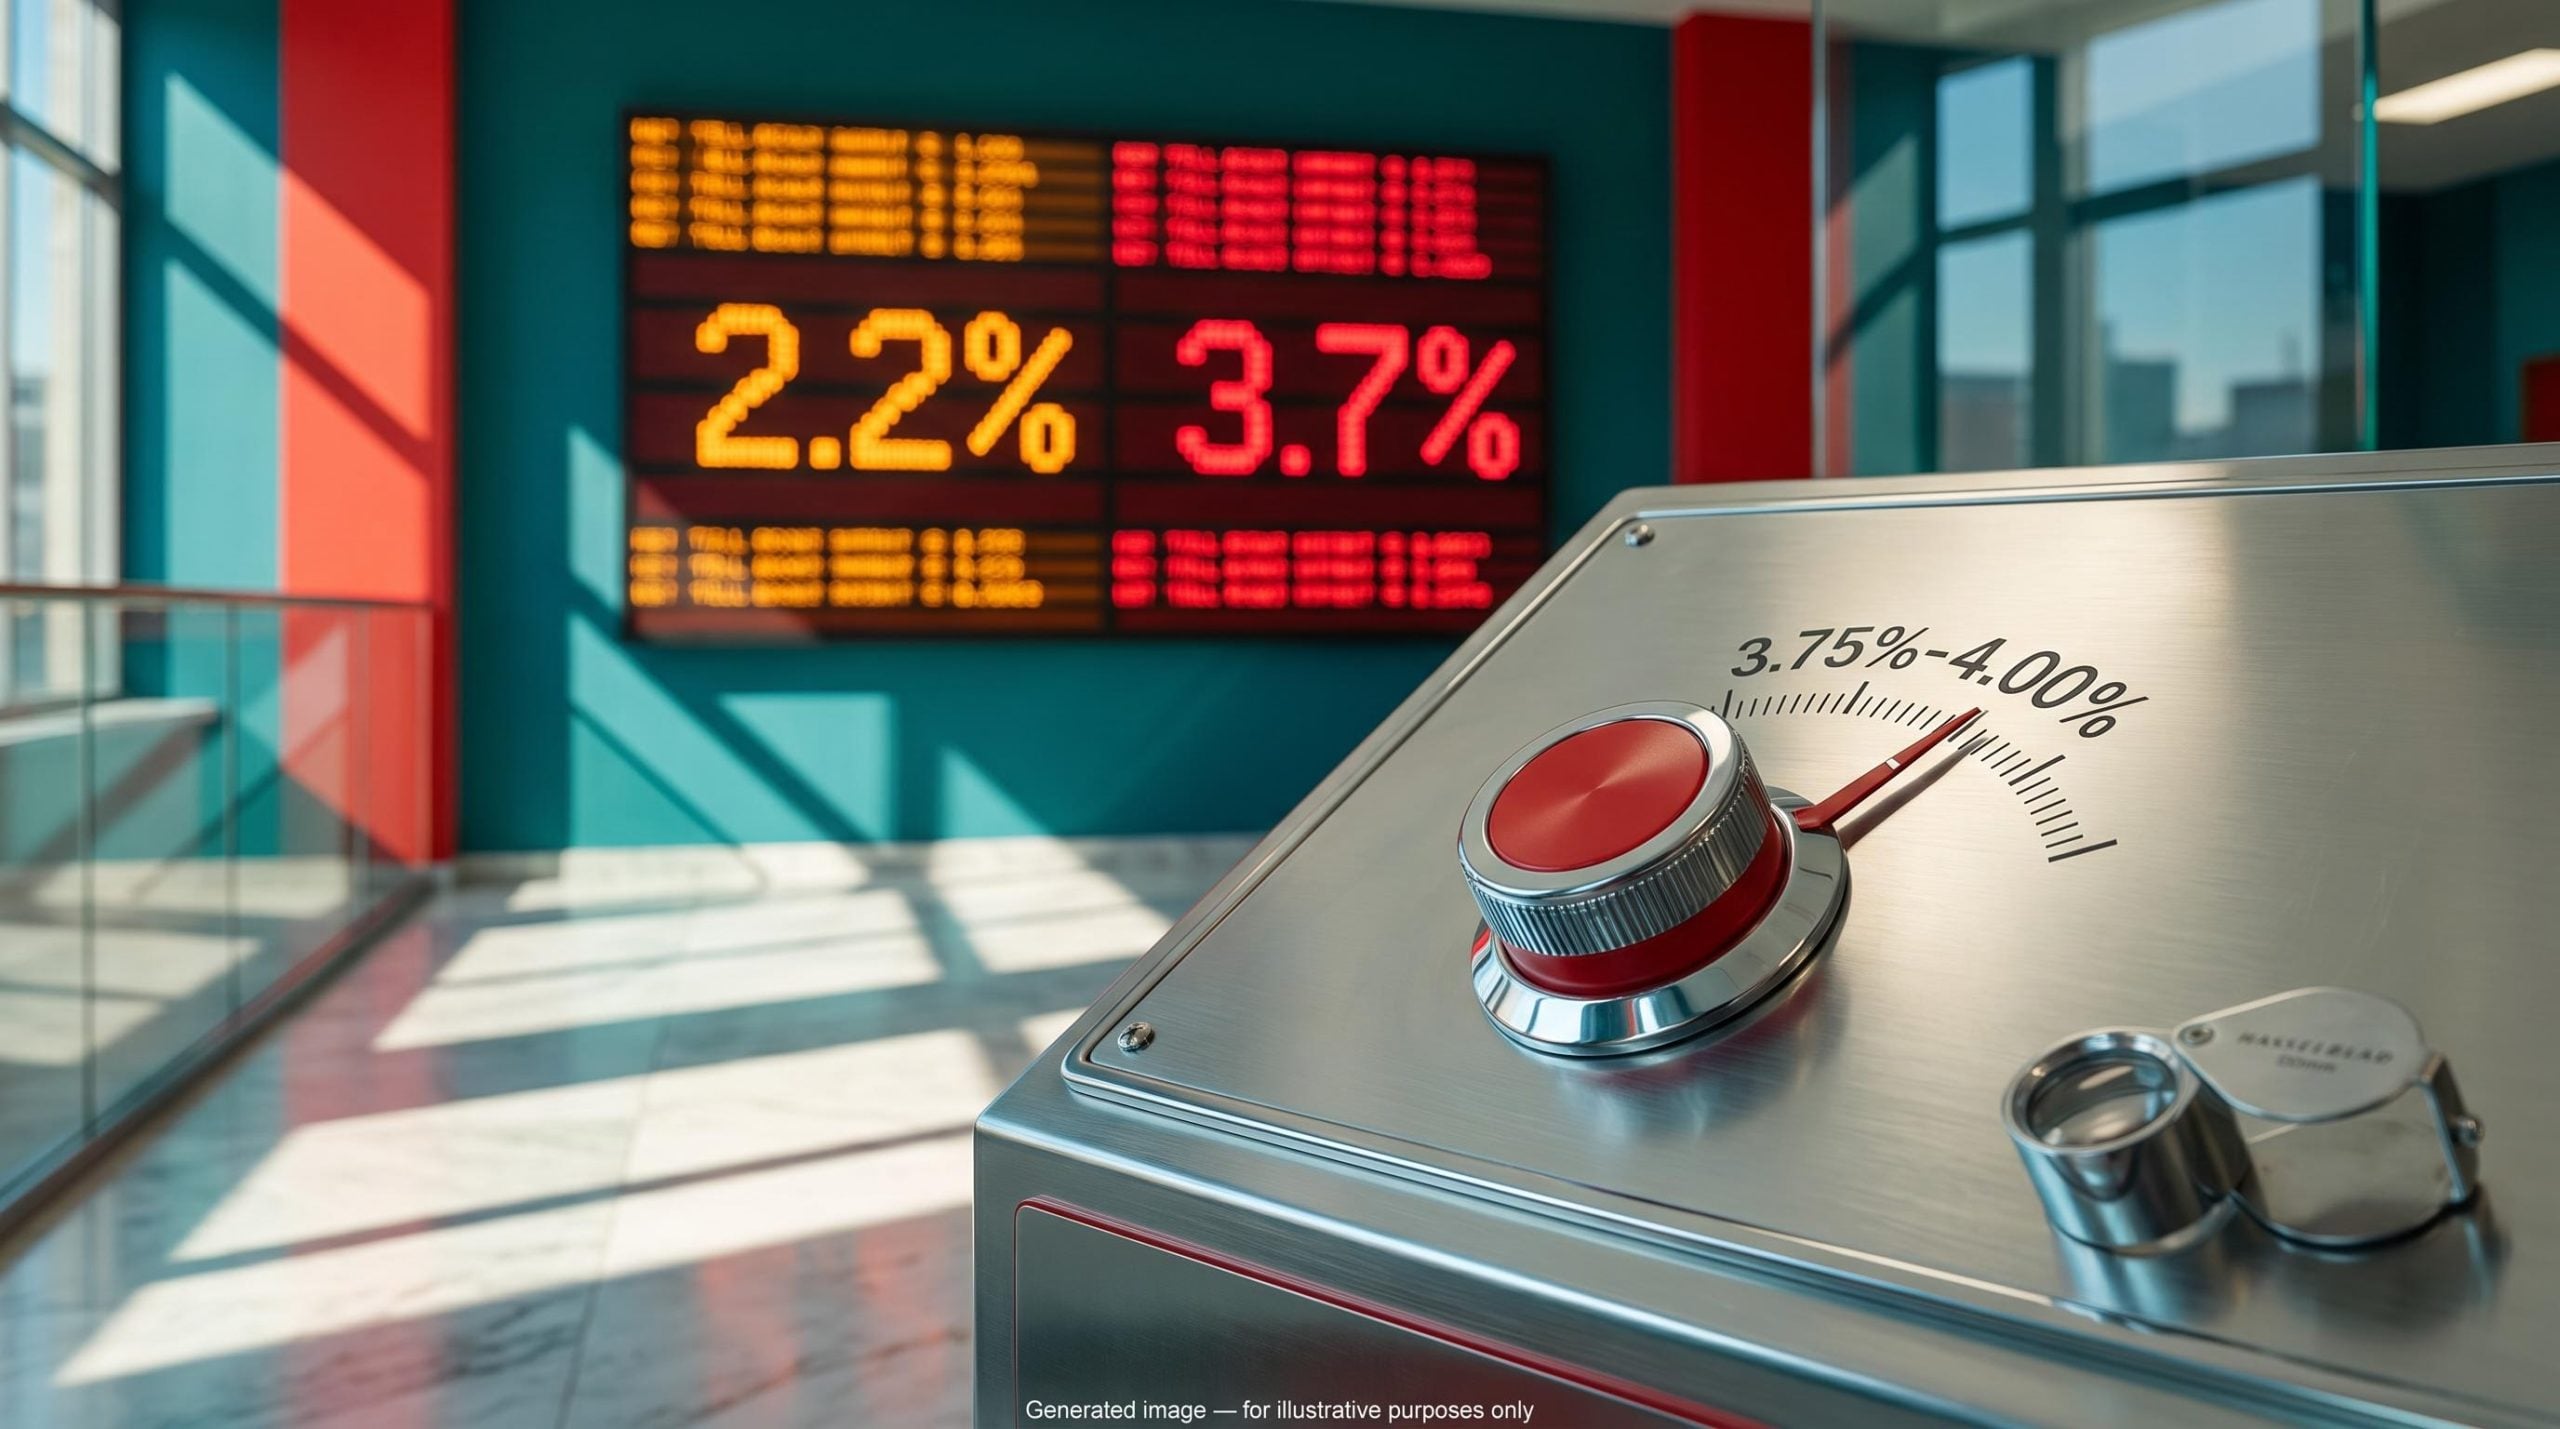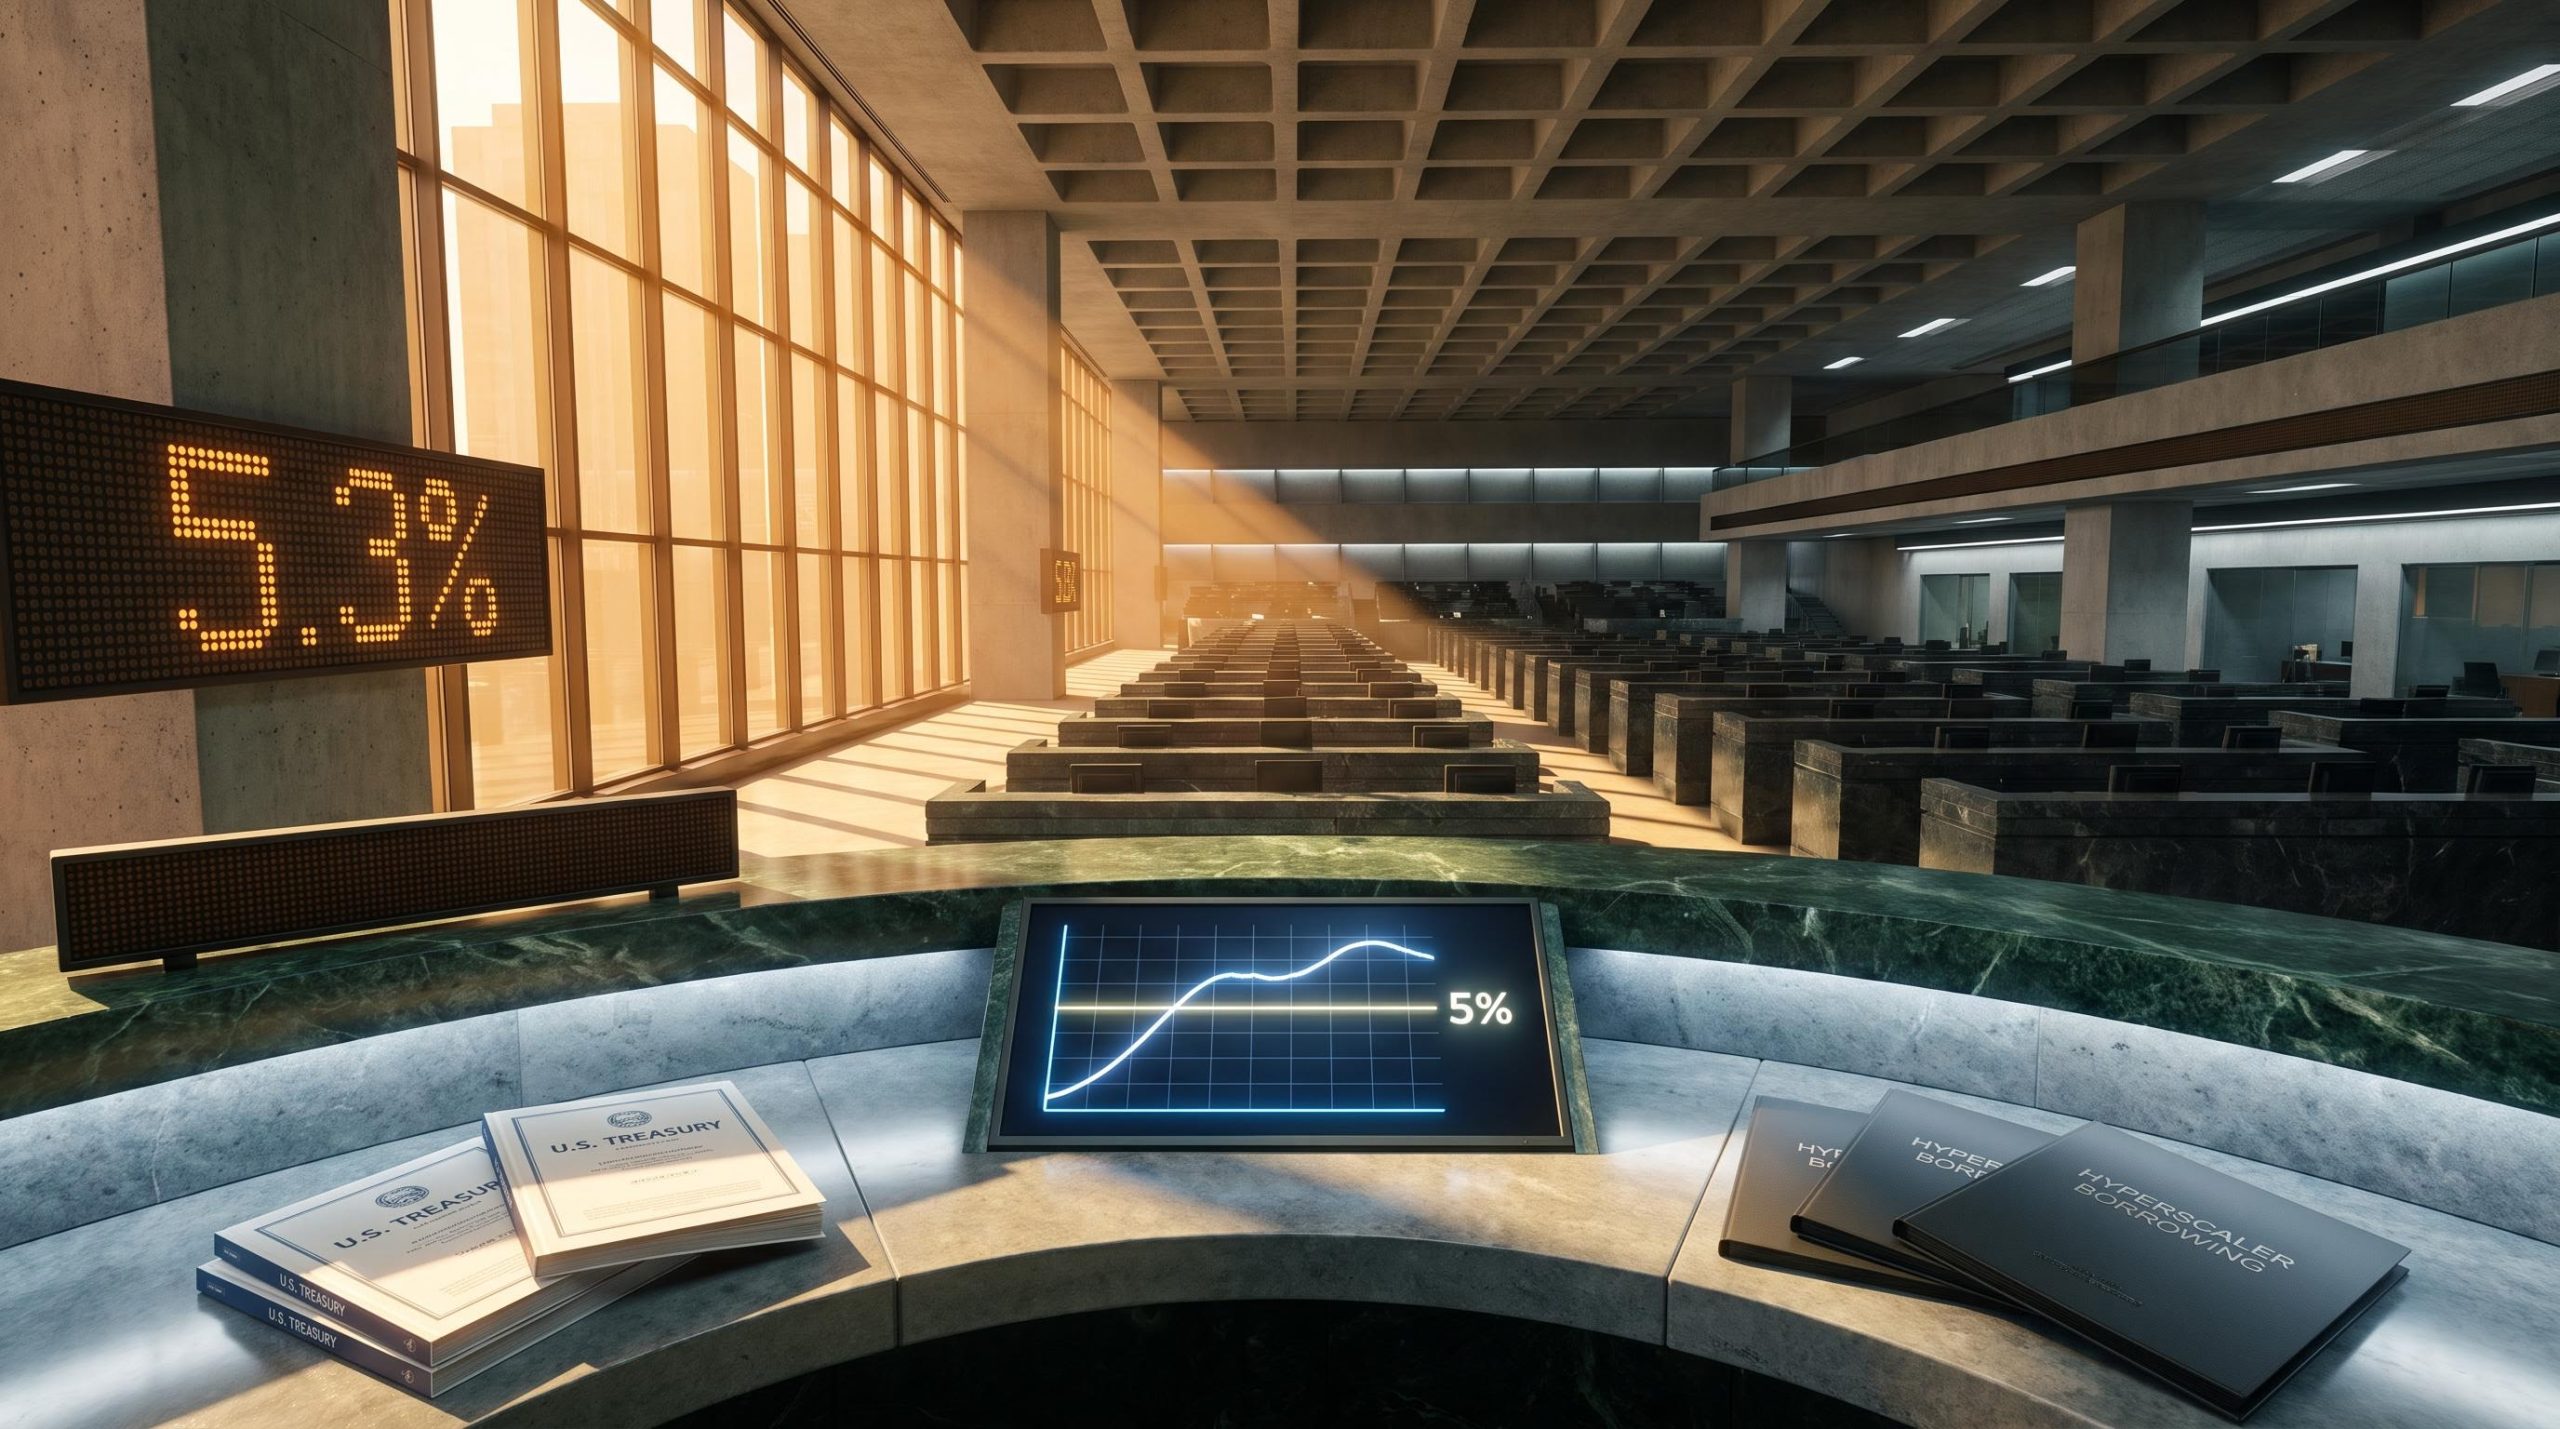
The 30-year Treasury yield sits above 5%, with a recent peak near 5.3%, levels the market has not seen since 2007. The 10-2 spread has widened to roughly 31 basis points. Most investors read those numbers and reach for the same conclusion: something is breaking. The more precise read is that something is being built, at enormous scale, and the bond market is being asked to finance it.
Two historically large borrowing programmes are arriving in the long end of the Treasury market at the same time. The U.S. government is running sustained deficits that require elevated issuance across 10-, 20-, and 30-year maturities. Simultaneously, AI hyperscalers have shifted from funding infrastructure off their balance sheets to raising hundreds of billions through the bond market. The collision of those two forces in the same pool of long-duration capital is what makes this steepening episode feel unfamiliar to anyone relying on older analytical frameworks.
Here is a framework for distinguishing between a yield curve steepening driven by capital demand and one driven by capital dysfunction, grounded in the specific evidence shaping the 2026 long end, and anchored by three live variables you can monitor from this point forward.
The two borrowing waves pushing long-end yields to 20-year highs
Government debt supply: deficits, duration, and the absorption problem
The U.S. fiscal deficit is not a new story. What has changed is the sustained volume of issuance concentrated at the long end of the curve. Treasury supply remains elevated across 10-, 20-, and 30-year maturities simultaneously, forcing investors to absorb more duration at progressively higher yields.
That absorption problem pushes long-end yields higher even without a new inflation shock. When the government needs to sell more long-dated bonds than the market comfortably wants to hold, the price clears lower and the yield rises. It is a supply-clearing mechanism, not a crisis signal, though the distinction matters only if you understand what is doing the pushing.
Long-end yields have now reached 20-25-year highs across all three tenors. The 30-year breached 5% and touched 5.3% before pulling back slightly after official intervention. Those are numbers that carry psychological weight, and they arrived before the second borrowing wave is even factored in.
AI hyperscaler borrowing: from self-funded to externally financed
Big Tech used to build data centres off its own balance sheet. That model has changed. The scale of AI infrastructure spending in 2025-2026 has pushed hyperscalers into the bond market in volume, raising approximately $220 billion in 2026 as of mid-August data, roughly doubling prior-year totals.
That shift from internally funded to externally financed means AI capital expenditure now competes directly with Treasury issuance for the same pool of long-duration investor capital. Bank of America estimates this corporate debt surge has pushed 10-year Treasury yields up by roughly 0.3 percentage point this year alone.
Hyperscaler capital expenditure, projected at $630-700 billion for 2026 and representing approximately 2% of US GDP, has produced what analysts describe as a historic semiconductor supercycle, with the SOX index gaining 38% by mid-April 2026, illustrating the scale of the demand wave now competing with Treasury issuance for long-duration capital.
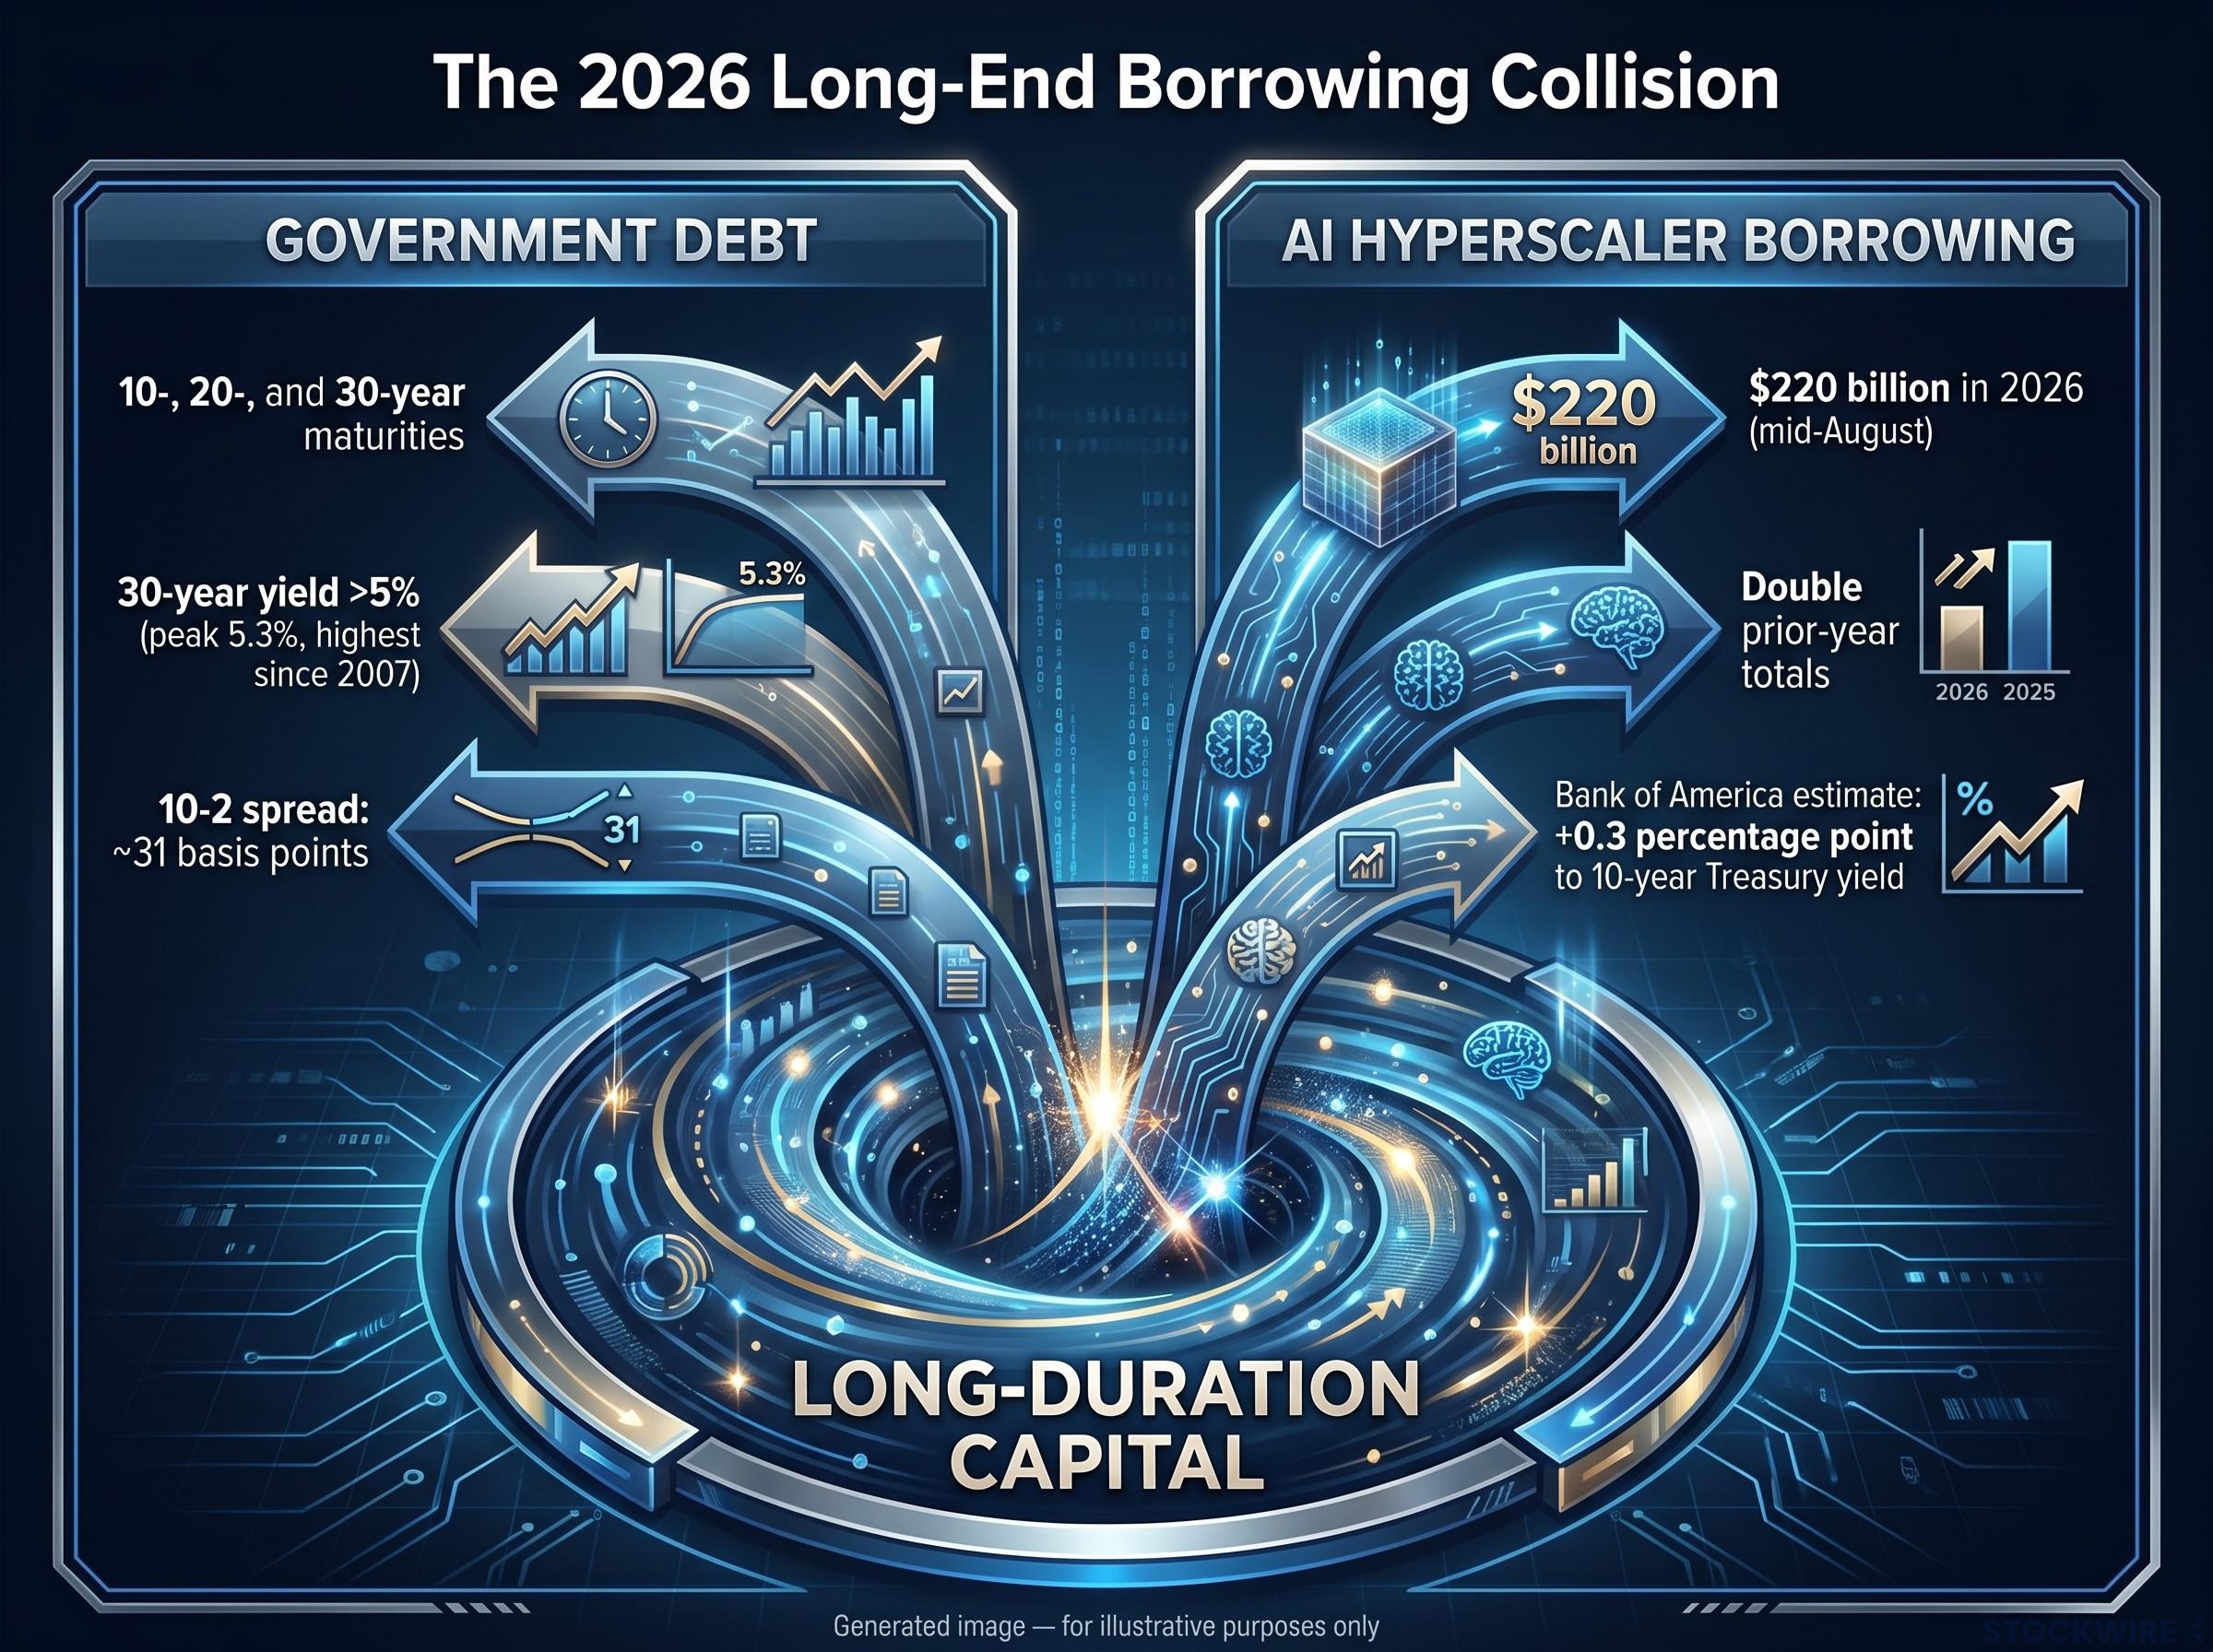
Bank of America estimates the AI-related corporate debt surge has added approximately 0.3 percentage point to the 10-year Treasury yield in 2026, a direct crowding-out effect from hyperscaler bond issuance competing with government debt for the same long-duration capital.
When two massive borrowers arrive in the same market simultaneously, yields rise to clear supply even without any deterioration in credit quality or policy credibility. That distinction changes how you should read the current numbers. A 30-year yield above 5% is not automatically a fiscal distress signal. It may simply be the price of clearing an unprecedented volume of long-duration paper.
When big ASX news breaks, our subscribers know first
What JPMorgan calls it, and why that framing matters
JPMorgan strategist Fabio Bassi, in a client note dated 24 August 2026, offered a framing that cuts against the instinctive alarm: the long-end selloff reflects increased demand for capital and expanding investment opportunity, not monetary policy failure.
The core distinction the bank is drawing is between capital demand and capital dysfunction.
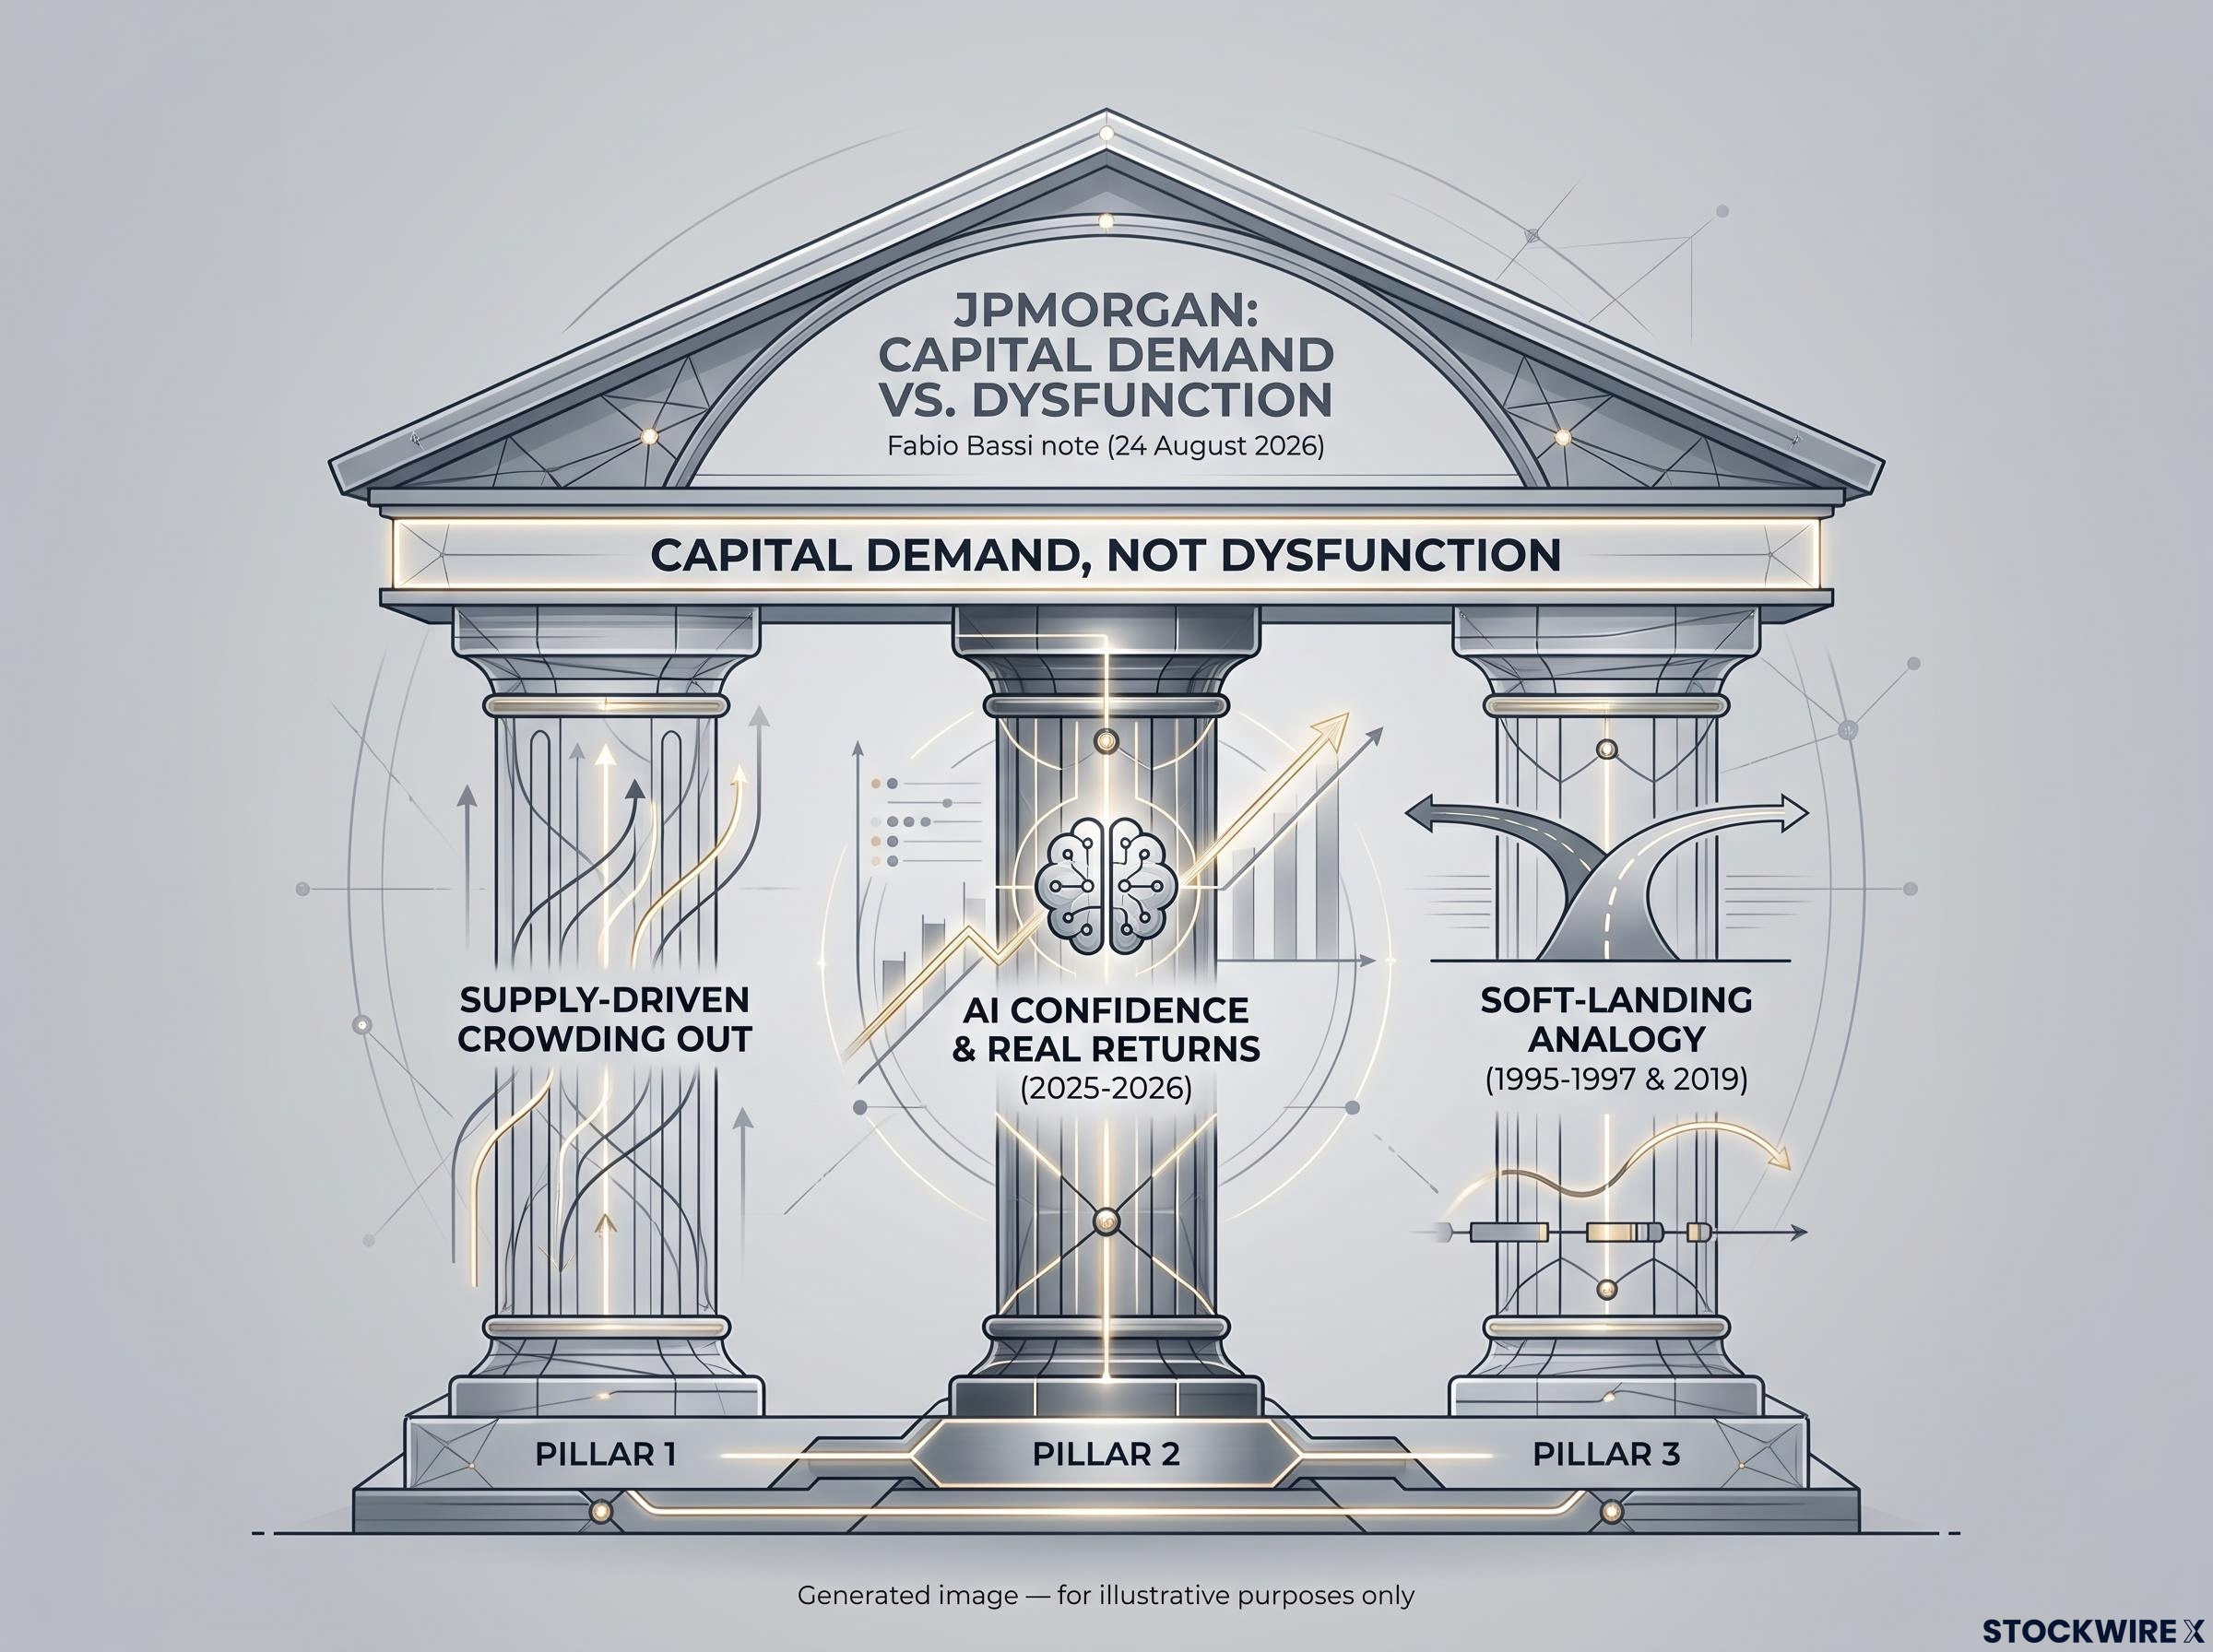
“Capital demand, not capital dysfunction.” That is how JPMorgan frames the current bear steepener, a reading that changes the investor’s task from reducing duration defensively to evaluating whether the growth thesis underlying AI capex actually holds.
Bassi’s logic rests on three pillars:
- Supply-driven crowding out: Hyperscaler capital expenditure and government debt issuance are competing for long-duration capital, pushing yields higher through volume rather than through deteriorating creditworthiness.
- AI confidence raising real return expectations: Improved confidence in the ability to monetise artificial intelligence is contributing to higher real returns on investment, which in turn justifies higher real long-term rates. Medium-term growth forecasts have been revised upward in response to the 2025-2026 AI investment acceleration.
- Soft-landing historical analogy: J.P. Morgan Asset Management has noted that the current 2s-10s slope resembles soft-landing periods in 1995-1997 and 2019, when the economy slowed but avoided recession.
If JPMorgan’s framing is correct, the investor’s task shifts. Rather than watching the Fed for the next signal, the more productive exercise is evaluating whether AI capex is generating real, monetisable returns, because that is what the bank says is doing the heavy lifting at the long end. The answer to that question determines whether today’s long-end yields are fairly priced or overshooting.
How yield curves have behaved before, and what makes 2026 different
The concern is legitimate on its face. Historically, a bear steepener, where long-term yields rise faster than short-term yields, has signalled one of two things: a policy error where the Fed has fallen behind the inflation curve, or deteriorating fiscal credibility where markets begin pricing in sovereign credit risk. Both are real historical outcomes with real consequences for portfolios.
Where 2026 departs from those episodes is in the composition of the forces at work. Analysts repeatedly highlight supply from AI-related corporate bonds and fiscal deficits as the leading drivers. According to JPMorgan, the steepening reflects expanded capital demand and improved return expectations rather than any sudden breakdown in macroeconomic or policy credibility. The bank’s base case anticipates only limited further term premium increases, under which elevated long-end yields are not seen as a catalyst for widespread risk aversion across markets.
| Dimension | Prior bear steepeners | 2026 episode |
|---|---|---|
| Primary driver | Inflation repricing or fiscal crisis concerns | Supply-driven: concurrent government deficit issuance and AI hyperscaler bond volume |
| Policy/fiscal credibility signal | Markets pricing Fed behind the curve or sovereign credit deterioration | No abrupt shift in inflation expectations or policy credibility; supply-clearing mechanism |
| Analyst assessment of systemic risk | Elevated; often preceded recessions or forced policy reversals | JPMorgan base case: modest additional term premium, no systemic risk aversion trigger |
The conditions that would flip the benign reading are specific and monitorable. A disorderly spike in inflation expectations or a sudden deterioration in macro credibility would change the assessment. But those would represent new facts, not features already embedded in the current supply-driven story. The practical question for you is not whether the long end looks expensive relative to history. It is whether the specific triggers that turned past steepeners into crises are present today. By the evidence available, they are not, but the tests are live.
Fiscal sustainability metrics matter here because the instinctive alarm response to a bear steepener typically anchors on debt-to-GDP, a measure that compares an accumulated stock of obligations to an annual flow of output rather than to government revenue, structurally overstating distress signals relative to the interest-payment ratios that markets actually price.
The Treasury’s buyback response and what it reveals about official comfort levels
On 19 August 2026, the U.S. Treasury announced it would at least double its buyback operations for longer-dated nominal coupon securities. The intervention was precise and the scale was significant enough to read as a policy signal rather than routine liquidity management.
- The announcement: Planned repurchases increased from approximately $2 billion to at least $4 billion per operation, covering both the 10-to-20-year and 20-to-30-year sectors. Operations are scheduled from 9 September through 4 November 2026.
- The immediate market response: The 10-year yield fell approximately 6 basis points and the 30-year dropped roughly 9 basis points following the announcement, offering a short-term reprieve from multi-decade highs.
- JPMorgan’s interpretation of the signal: The bank viewed the decision to scale up repurchases as a sign that policymakers had grown uneasy with the level long-end borrowing costs had reached.
The Treasury at least doubled its buyback size, from approximately $2 billion to at least $4 billion per operation, across both the 10-to-20-year and 20-to-30-year sectors, a scale that signals official discomfort with where long-end yields had settled.
That intervention changes the analytical picture. The Treasury is now an active variable in the long-end yield equation. Any further expansion of the buyback programme signals deepening official concern. Any scaling back or lapse signals that yields have retreated to an acceptable range. Either outcome updates the supply-demand picture in real time, and investors who monitor the programme’s trajectory have an informational edge over those watching only the Fed.
Reading the curve correctly from here: what the capital demand thesis changes for investors
Rates and duration: when the old heuristic misleads
The standard playbook says a steepening curve means recession risk; cut duration. In a supply-driven episode, that heuristic may lead you in the wrong direction. JPMorgan’s framework argues against reflexive duration cuts solely because the long end has backed up. If the rise in yields reflects expanded investment opportunity rather than policy failure, the risk of being underweight duration at the wrong moment is real.
The signals to monitor are specific. Watch the Treasury buyback programme through its 4 November 2026 end date for any scaling or reversal. Watch for fresh inflation data that would shift the regime assessment from supply-driven to inflation-driven. Those are the variables that would make the old heuristic correct again.
Long-duration Treasury positioning has already shifted among major institutions: BlackRock, JPMorgan, Goldman Sachs, and Bridgewater have independently reached convergent conclusions, all rotating away from long-end nominal exposure and toward real assets and inflation-linked strategies in response to the same structural deficit trajectory the current supply wave reflects.
Equities and credit: the bifurcated impact
If higher long-term yields reflect better long-run growth and monetisable AI investment, the equity impact is mixed rather than uniformly negative. Companies supplying AI infrastructure (chips, data centres, cloud platforms, grid upgrades) may benefit from the same capital-demand forces pushing yields higher. Rate-sensitive sectors outside the AI theme face a different calculus entirely.
The credit market carries a more specific risk. As benchmark long-end yields rise and investor balance sheets become more saturated with AI and Treasury paper, non-AI investment-grade issuers could face wider spreads simply because competition for duration is more intense, even without any deterioration in their credit quality.
The practical implications by asset class:
- Rates (duration positioning): Reflexive duration cuts on a supply-driven steepener may be premature. The monitoring signals are buyback trajectory and inflation data, not the Fed’s next statement.
- Equities (AI versus non-AI): AI infrastructure suppliers sit on the demand side of the same force pushing yields higher. Non-AI rate-sensitive sectors face headwinds without the offsetting benefit.
- Credit (non-AI investment-grade spreads): Crowding out from hyperscaler and Treasury issuance could widen spreads for non-AI borrowers regardless of their underlying creditworthiness.
This article is for informational purposes only and should not be considered financial advice. Investors should conduct their own research and consult with financial professionals before making investment decisions.
What the steepening is telling you, and what to watch next
The current bear steepener is best read as a post-AI-investment-cycle supply story. Government deficits and AI capex are simultaneously bidding for long-duration capital, driving up long-end yields through supply pressure and improved growth expectations rather than outright distress. JPMorgan’s capital demand framing gives you a specific and testable alternative to the default alarm reading.
Three live variables determine whether that reading holds. First, the trajectory of AI capex monetisation evidence: if hyperscaler spending starts generating demonstrable returns, the higher real yields are justified; if it does not, the market has mispriced the growth premium. Second, the Treasury buyback programme scale through 4 November 2026: any expansion signals deepening official concern, any pullback signals comfort with where yields have settled. Third, any disorderly move in inflation expectations: that is the regime-change trigger that would convert this supply story into the kind of bear steepener that has historically preceded genuine crises.
The benign reading holds under current conditions. Those conditions carry specific tests, and you now have the framework to apply them.
For investors wanting to evaluate whether the AI infrastructure investment thesis can generate the monetisable returns that justify today’s elevated real rates, our deep-dive into AI infrastructure stocks binding constraints examines the physical bottlenecks in power availability and cooling density that determine which companies will compound durable value from the buildout.
Past performance does not guarantee future results. Financial projections are subject to market conditions and various risk factors.