
When a stock rips higher on enormous call volume, the easy read is that traders are bullish. But about 90% of options trades have a market maker on the other side, and that market maker is not betting on direction at all. Their options dealer hedging can still move the stock you are watching, sometimes more than the original trade did.
That matters more every year. According to Cboe, more than 15.2 billion US options contracts traded in 2025, roughly 61 million a day.
Short-dated contracts now drive much of that activity. Zero-days-to-expiry options, which expire on the same day they trade, made up 60% of S&P 500 index (SPX) options volume last month, according to Cboe.
Here is how hedging flows turn into real buying and selling. You will also see how to read gamma and option “walls” with healthy scepticism, and how to match those signals to the time horizon you actually trade on.
What is options dealer hedging, and why does it move stocks?
Most people assume an options trade pits a bull against a bear. Usually it does not.
Who you are really trading against About 90% of options are traded against a market maker, according to Brent Kochuba of SpotGamma.
A market maker is a firm that quotes prices to buy and sell all day. It earns money from the bid-ask spread (the gap between its buying and selling price) and from time decay (the value options lose as expiry approaches). Its goal is to stay delta neutral. Delta measures how much an option’s price moves when the stock moves, and being delta neutral means the firm’s overall book neither gains nor loses from small price changes.
Because dealers hedge to stay delta neutral, how delta shifts as expiry approaches determines how much stock they must buy or sell; your own option’s delta is the same number the dealer is offsetting on the other side.
This business is concentrated among roughly six or seven large firms, including Citadel, Jane Street, Susquehanna and Wolverine. Single-stock options are less concentrated in their hands than index options.
The hedging loop in plain terms
Here is how a single call trade becomes stock buying:
- You buy a call option on a stock.
- A dealer sells you that call, taking on the risk that the stock rises.
- The stock starts climbing, so the dealer’s short call begins losing money.
- The dealer buys shares to flatten that exposure, adding buying pressure to the rising stock.
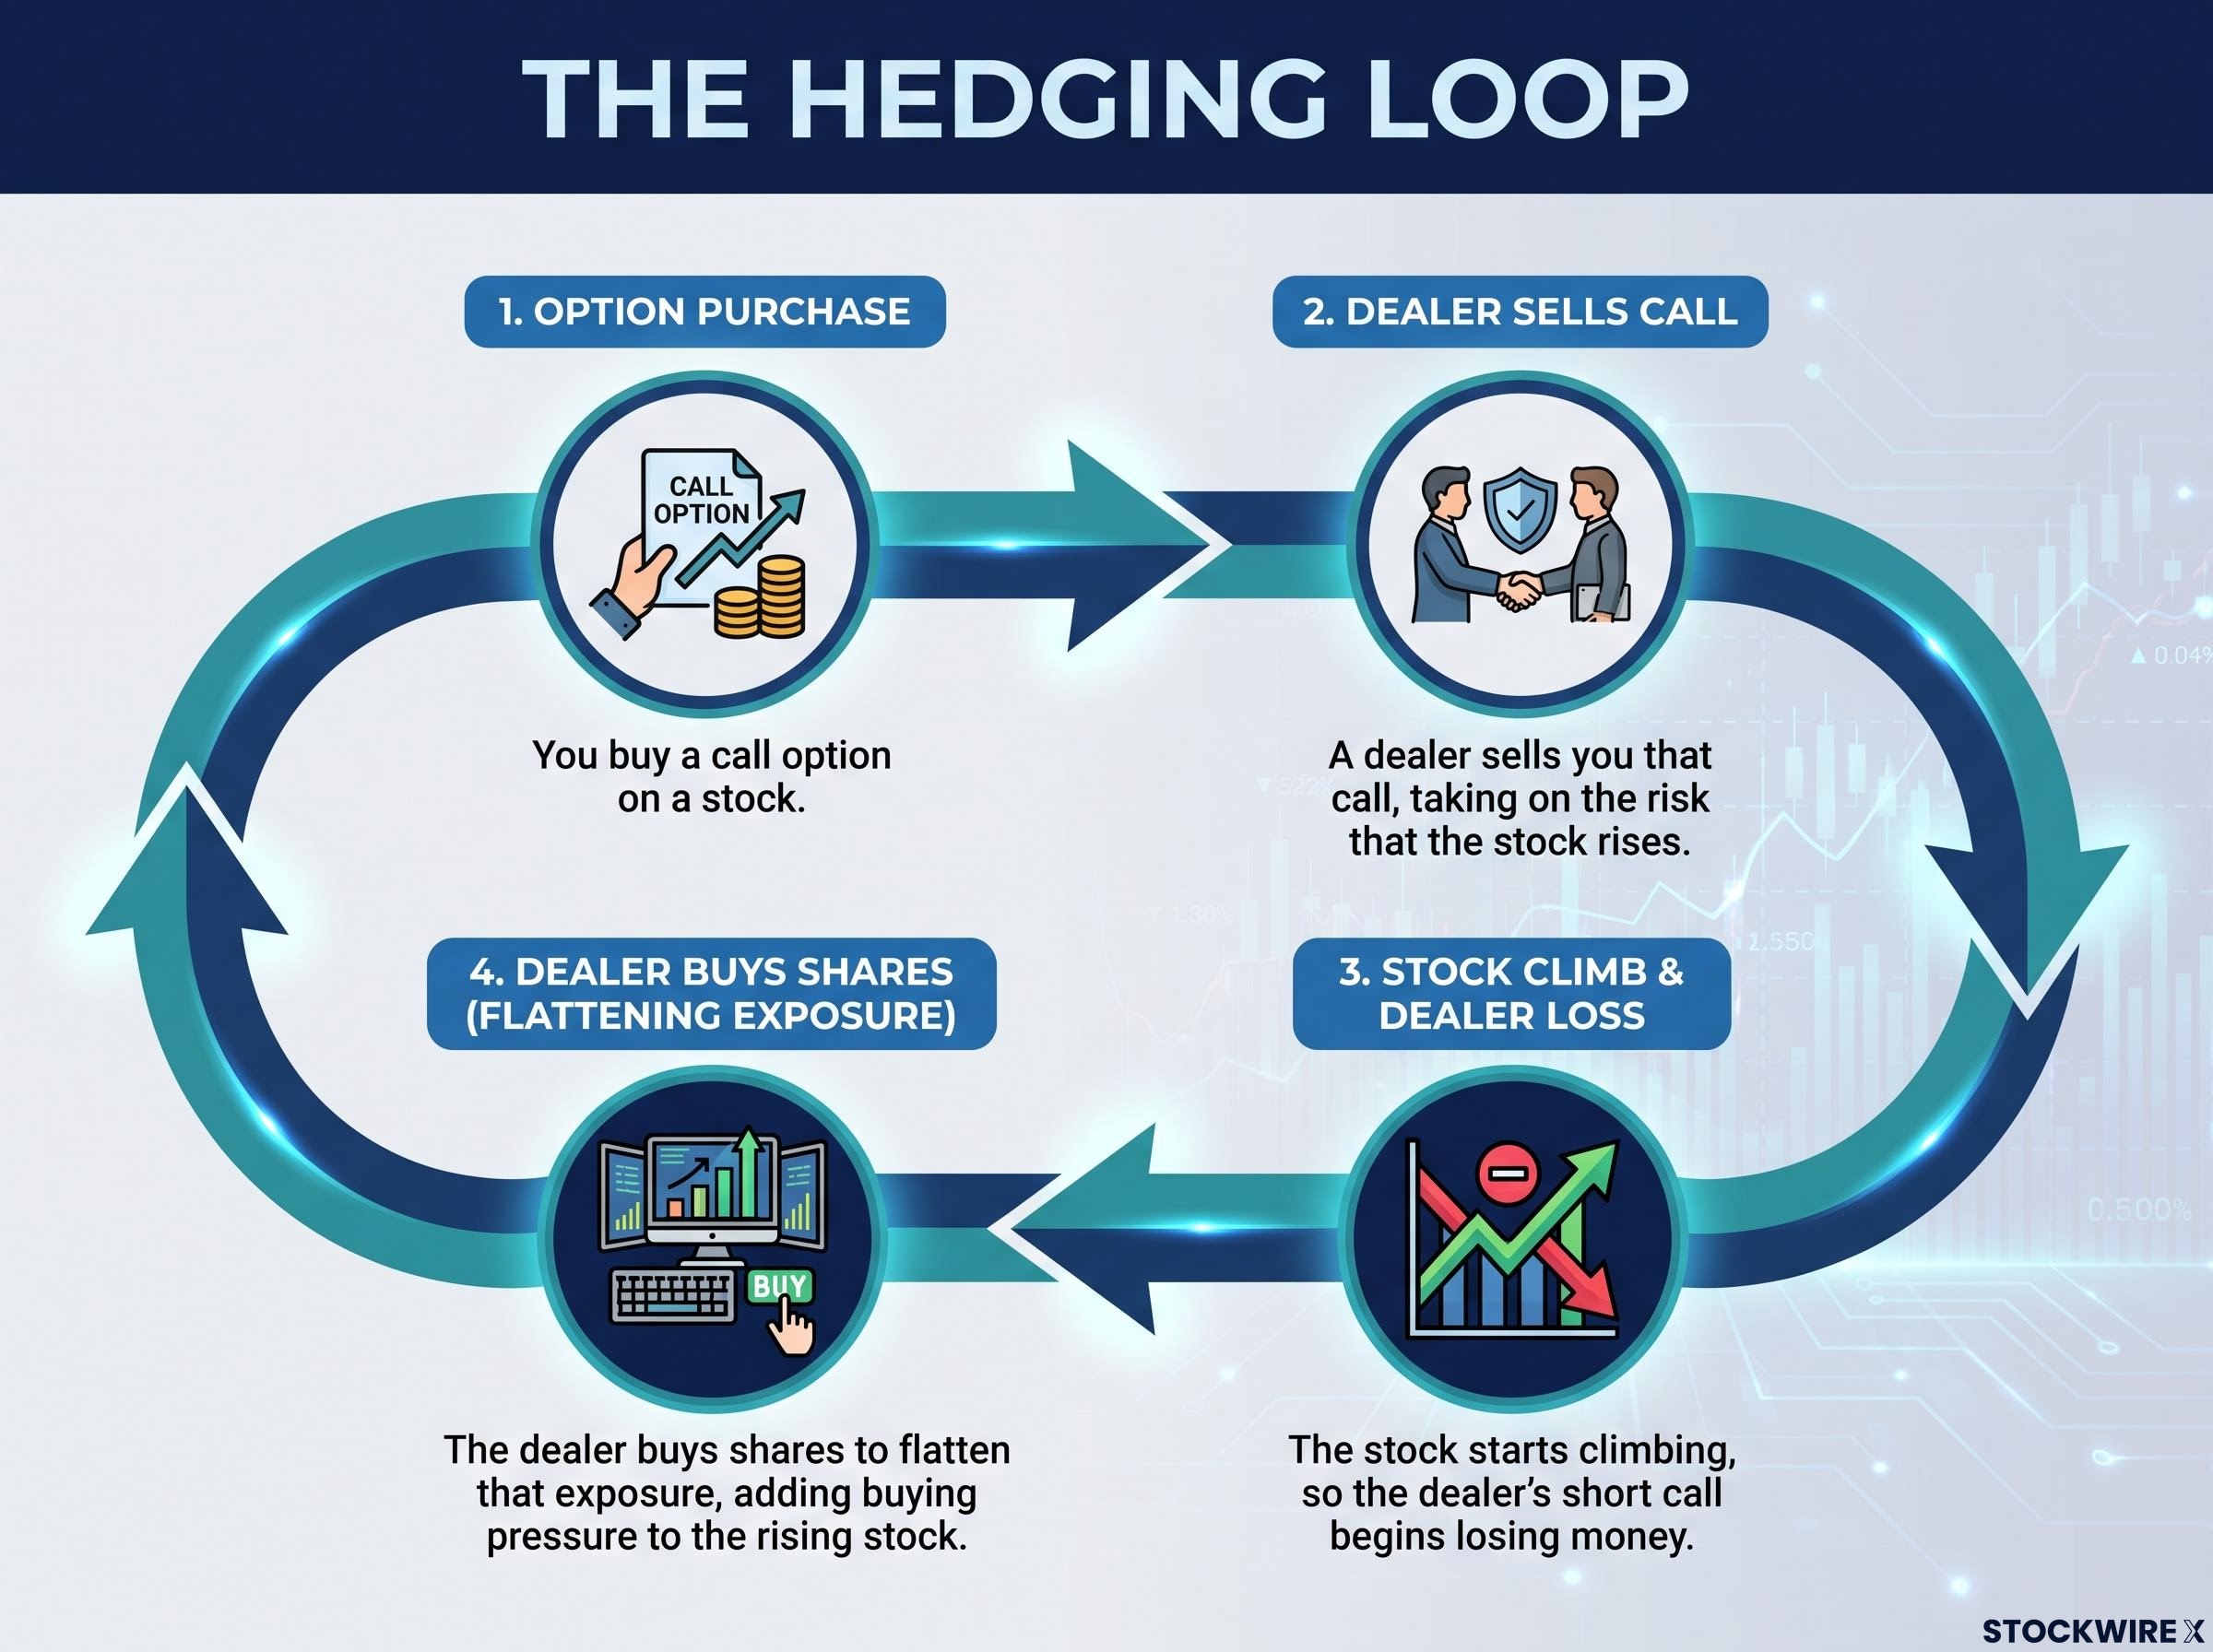
The put side mirrors this. A dealer short a put may need to sell shares as the stock falls. This is not just preference: dealers face risk limits like any account, so hedging is also how they stay within them.
As an illustration from 2022, Meta once rose about 10% in a day with roughly 1.8 million calls traded. When you see volume like that, part of the move may reflect dealers neutralising risk rather than investors expressing a view. Treat flow as a mechanism, not only as sentiment.
Where gamma fits
Gamma measures how fast delta changes as the price moves. In practice, it tells you how much a dealer’s hedge must change for each step in the stock. Related measures include vanna (how delta shifts with implied volatility) and charm (how delta shifts with time).
Dealers have another lever. They can raise option prices, visible as rising implied volatility or skew, to encourage clients to sell and reduce the dealer’s exposure. One limit to keep in mind: the Options Clearing Corporation (OCC) publishes open interest daily, but it does not reveal which side dealers are on.
When big ASX news breaks, our subscribers know first
Positive and negative gamma: when hedging calms a market and when it amplifies it
Once you see the hedging loop, the next question is which direction it runs. The answer depends on whether dealers are long or short gamma, and the two regimes behave as near mirror images.
| Regime | Dealer behaviour on rallies | Dealer behaviour on dips | Typical price effect | Typical volatility effect |
|---|---|---|---|---|
| Positive (long) gamma | Sell into strength | Buy weakness | Mean reversion, pinning near big strikes | Lower realised volatility |
| Negative (short) gamma | Buy as prices rise | Sell as prices fall | Trends reinforced | Higher intraday volatility |
Practitioners talk about a “gamma flip” level, the price where estimated dealer gamma changes sign. Below it, dealers may sell into declines. But that line is an interpretation of estimated positioning, not a threshold anyone directly observes.
What the evidence says, and where it disagrees
Research from Dim, Eraker and Vilkov found market-maker inventory gamma was on average positive and negatively related to future intraday volatility. Positive gamma lined up with stronger reversals, negative gamma with stronger momentum. Separate academic work estimated that zero-DTE intermediation lowered index volatility by about 60-90 annualised basis points on those days.
The scale of the effect Cboe research found a median estimated reduction of about 0.08 percentage points in daily volatility from typical gamma effects. Across the evidence, average effects look modest relative to total market volatility.
Not everyone agrees the signal earns its popularity. A Princeton thesis from April 2026 found the standard gamma-hedging channel added no meaningful predictive power for intraday variance once normal volatility benchmarks were included.
There is also a reverse-causality problem. A falling market can itself produce negative estimated gamma exposure (GEX) and heavier put demand, so the measured shift may partly be a result of the move. For you, the takeaway is that aggregate gamma is often mildly stabilising; it matters most in the specific episodes where it turns negative.
Put walls, call walls and the limits of treating them as barriers
If gamma regimes are the weather, walls are the landmarks traders love to mark on the map. A call wall is the strike with the largest call gamma across expirations, and a put wall is the same for puts. They may act as resistance and support.
The idea is appealing because it gives you a clean line. Reality is messier.
How walls behave
Composition changes the meaning. Heavy call selling implies a view that the stock will not rise past the strike, while large call buying adds negative gamma to dealer books, forcing them to keep buying as price rises. So a wall may hold as resistance when calls are sold, or be breached and later revisited when calls are bought.
Direction matters too. Call walls rolling to higher strikes generally suggest bullish positioning, and the same logic applies to put walls. Walls also shift with new trades, rolls, expiry and the spot price, sometimes within a single session.
Why a wall may not hold:
- Position composition: open interest may be customer-to-customer, hedged elsewhere, or split across venues and maturities.
- Intraday movement: walls can relocate during the day, week or month.
- Other flows: systematic funds, leveraged ETFs and pension rebalancing can overwhelm hedging.
- Vendor model disagreement: data providers differ on trade direction, dealer inventory and hedging assumptions.
Walls are estimates, not barriers A strike with large open interest may not correspond to any dealer short-gamma position at all.
Case studies: pinning and GameStop
Expiry-day pinning is the clearest example of walls working. When dealers are long gamma near a heavily traded strike, they buy weakness and sell strength, so the price can drift toward that strike into expiry.
Expiry-day behaviour is easiest to see in the index, where zero-DTE pinning left the S&P 500 closing one point above the heaviest strike concentration on 12 December 2025.
GameStop in January 2021 is the cautionary tale. The popular account says dealers who sold calls were forced to buy shares as the stock soared. The SEC did not find sufficient evidence for a straightforward call-driven gamma squeeze and highlighted the role of puts, while an academic critique argued much of the trading was consistent with options hedging under plausible netting assumptions.
The lesson for you: a wall is a hypothesis about where hedging pressure might concentrate. Size trades as if it could fail.
Option tenor: why zero-DTE signals fade by the close and longer-dated ones last
Every signal so far carries a hidden variable: the clock. Tenor, meaning time until an option expires, decides how long the hedge behind a signal will actually exist.
Zero-DTE gamma and delta shift within minutes, and the hedge largely disappears at the close. SPX zero-DTE was about 59% of SPX volume in 2025, and Cboe reported a record 3.4 million contracts a day in September 2026. Short-dated Monday and Wednesday expiries in names such as TSLA, NVDA and AAPL approached 6 million contracts a day, though Cboe does not claim they caused stock moves.
A 2022 interview put SPX zero-DTE above 65% and NDX around 75%. Treat those as dated illustrations; measures differ depending on the denominator used.
| Option type | Hedging persistence | Best-suited horizon | Typical trader use |
|---|---|---|---|
| Zero-DTE | Hours; largely gone at the close | Intraday | Short-term timing; rallies better faded |
| Longer-dated | Weeks or months | Swing trades | Gauging conviction behind a move |
Large November or December call purchases imply hedging obligations that last weeks. To see where pressure sits, compare at-the-money implied volatility across expiries, known as the term structure. A signal that expires at 4pm cannot support a swing trade.
Common beginner mistakes
- Ignoring implied volatility: a call can lose money even when the stock rises if implied volatility falls.
- Forcing trades: waiting for aligned conditions, and sitting out unclear macro days, tends to serve you better.
- Trusting one indicator: systematic funds, leveraged ETFs, vol-control strategies and pension rebalancing can overwhelm gamma.
August 2024 shows why. The Bank for International Settlements (BIS) found the VIX spike reflected bid-ask widening in out-of-the-money puts, not simply dealers short gamma.
Using hedging signals with discipline, and what they cannot tell you
Put the pieces together and a settled stance emerges. Dealer data is useful, but every number is inferred.
Open interest shows contracts, not dealer direction, and it is not real-time inventory. Gamma is local, so dealers can be long at one strike and short at another. Volume is not net gamma either: heavy zero-DTE trading can be near-balanced between buyers and sellers.
Dealers themselves manage these risks actively. A Federal Reserve survey found three-fifths of dealers collected intraday margin on zero-DTE trades when volatility was elevated.
Before acting on a hedging signal, run through this checklist:
- Tenor: how long do the underlying options last?
- Regime: is estimated gamma positive or negative, and how confident is that estimate?
- Wall composition: are contracts mainly bought or sold, and is the wall moving?
- Volatility: are options cheap or expensive right now?
- Other flows: could systematic, ETF or rebalancing flows swamp the hedge?
The bottom line Gamma walls and GEX are useful estimates of potential liquidity and feedback, not guaranteed support or resistance.
The dated examples here illustrate mechanisms; they are not forecasts. Treat dealer positioning as one input among several, helpful for context and timing but never enough on its own.
Past performance does not guarantee future results. This article is for informational purposes only and should not be considered financial advice. Investors should conduct their own research and consult with financial professionals before making investment decisions.
Reading the hedging map without mistaking it for the territory
Dealers hedge to stay neutral, and that hedging becomes real share buying and selling. Positive gamma tends to calm prices while negative gamma can amplify them. Walls mark where pressure might gather, and tenor tells you how long any of it lasts.
The research points one way on scale: these effects are real, but on average they are modest next to everything else moving markets.
So the next time a heavy options day lights up your screen, start with two questions. How long do those contracts last, and what is implied volatility doing? Answer those first, and the gamma map becomes a guide you can use rather than a story you have to believe.