
The bond market looks almost sleepy heading into the Federal Reserve’s decision. IEF, the iShares 7-10 Year Treasury Bond ETF, closed near $91.10 on 27 October 2026, barely changed. Yet one bearish trader holds a large stack of January put options on IEF at the 92 strike, a level sitting just above that close. So is the quiet a sign of complacency, or simply a hold that markets have already priced in?
The federal funds target range sits at 3.75%-4.00%. A Reuters survey found 94 of 100 economists expected the Federal Open Market Committee (FOMC), the Fed’s rate-setting body, to hold at its 27-28 October meeting. Markets were still pricing a possible December hike.
The statement and press conference had not been published when this was written. Treat the outcome as an open variable and check the actual decision before you act on anything here.
After this, you will know how a put on an intermediate Treasury ETF works, what could make one pay off or fail, and how TLT, LQD and XLU fit the same rate story. This is educational analysis, not personalised investment advice.
Why are bonds calm before the FOMC, and what moves intermediate Treasury prices?
A flat screen before a major Fed meeting can look like indifference. It usually means something different: the risk has been moved into other instruments.
Why the calm is not the same as low risk
Ahead of a big event, traders often cut their directional bets and hedge with options instead. When almost everyone expects the same outcome, that outcome gets priced in early, so the surprise left on the table is small.
Calm breaks when the market is split. Reuters showed the probability of an October hike swinging sharply over a short stretch as long-term yields pulled back from early-month highs. That is when volatility returns.
A quiet bond market before the Fed tells you the decision itself is largely priced. The information you should watch is in the guidance, the tone of the press conference and the signals about December, not the hold.
The five forces behind intermediate Treasury prices
Five mechanics drive what happens to a fund like IEF:
- Expected policy rates: lower expected short-term rates generally mean lower yields and higher bond prices. Higher expectations do the opposite.
- Duration: duration measures how sensitive a bond’s price is to a change in yields, expressed in years.
- Term premium: the extra yield investors demand for holding longer bonds through inflation, fiscal and rate uncertainty. It can rise even while the Fed cuts.
- Fiscal deficits and supply: heavy Treasury issuance can push prices down unless buyers absorb it at higher yields.
- Inflation expectations and real yields: a real yield is the yield after inflation. Rising real yields can hurt Treasuries even when inflation expectations stay stable.
The duration rule of thumb Price change is roughly duration multiplied by the change in yield, with the opposite sign. A fund with a 7-8 year duration loses about 7-8% before income if yields rise one percentage point.
Here is the worked version. If you held $10,000 of a fund with a seven-year duration and yields rose from 4.75% to 5.75%, you would expect a loss of roughly $700 before interest payments cushion it.
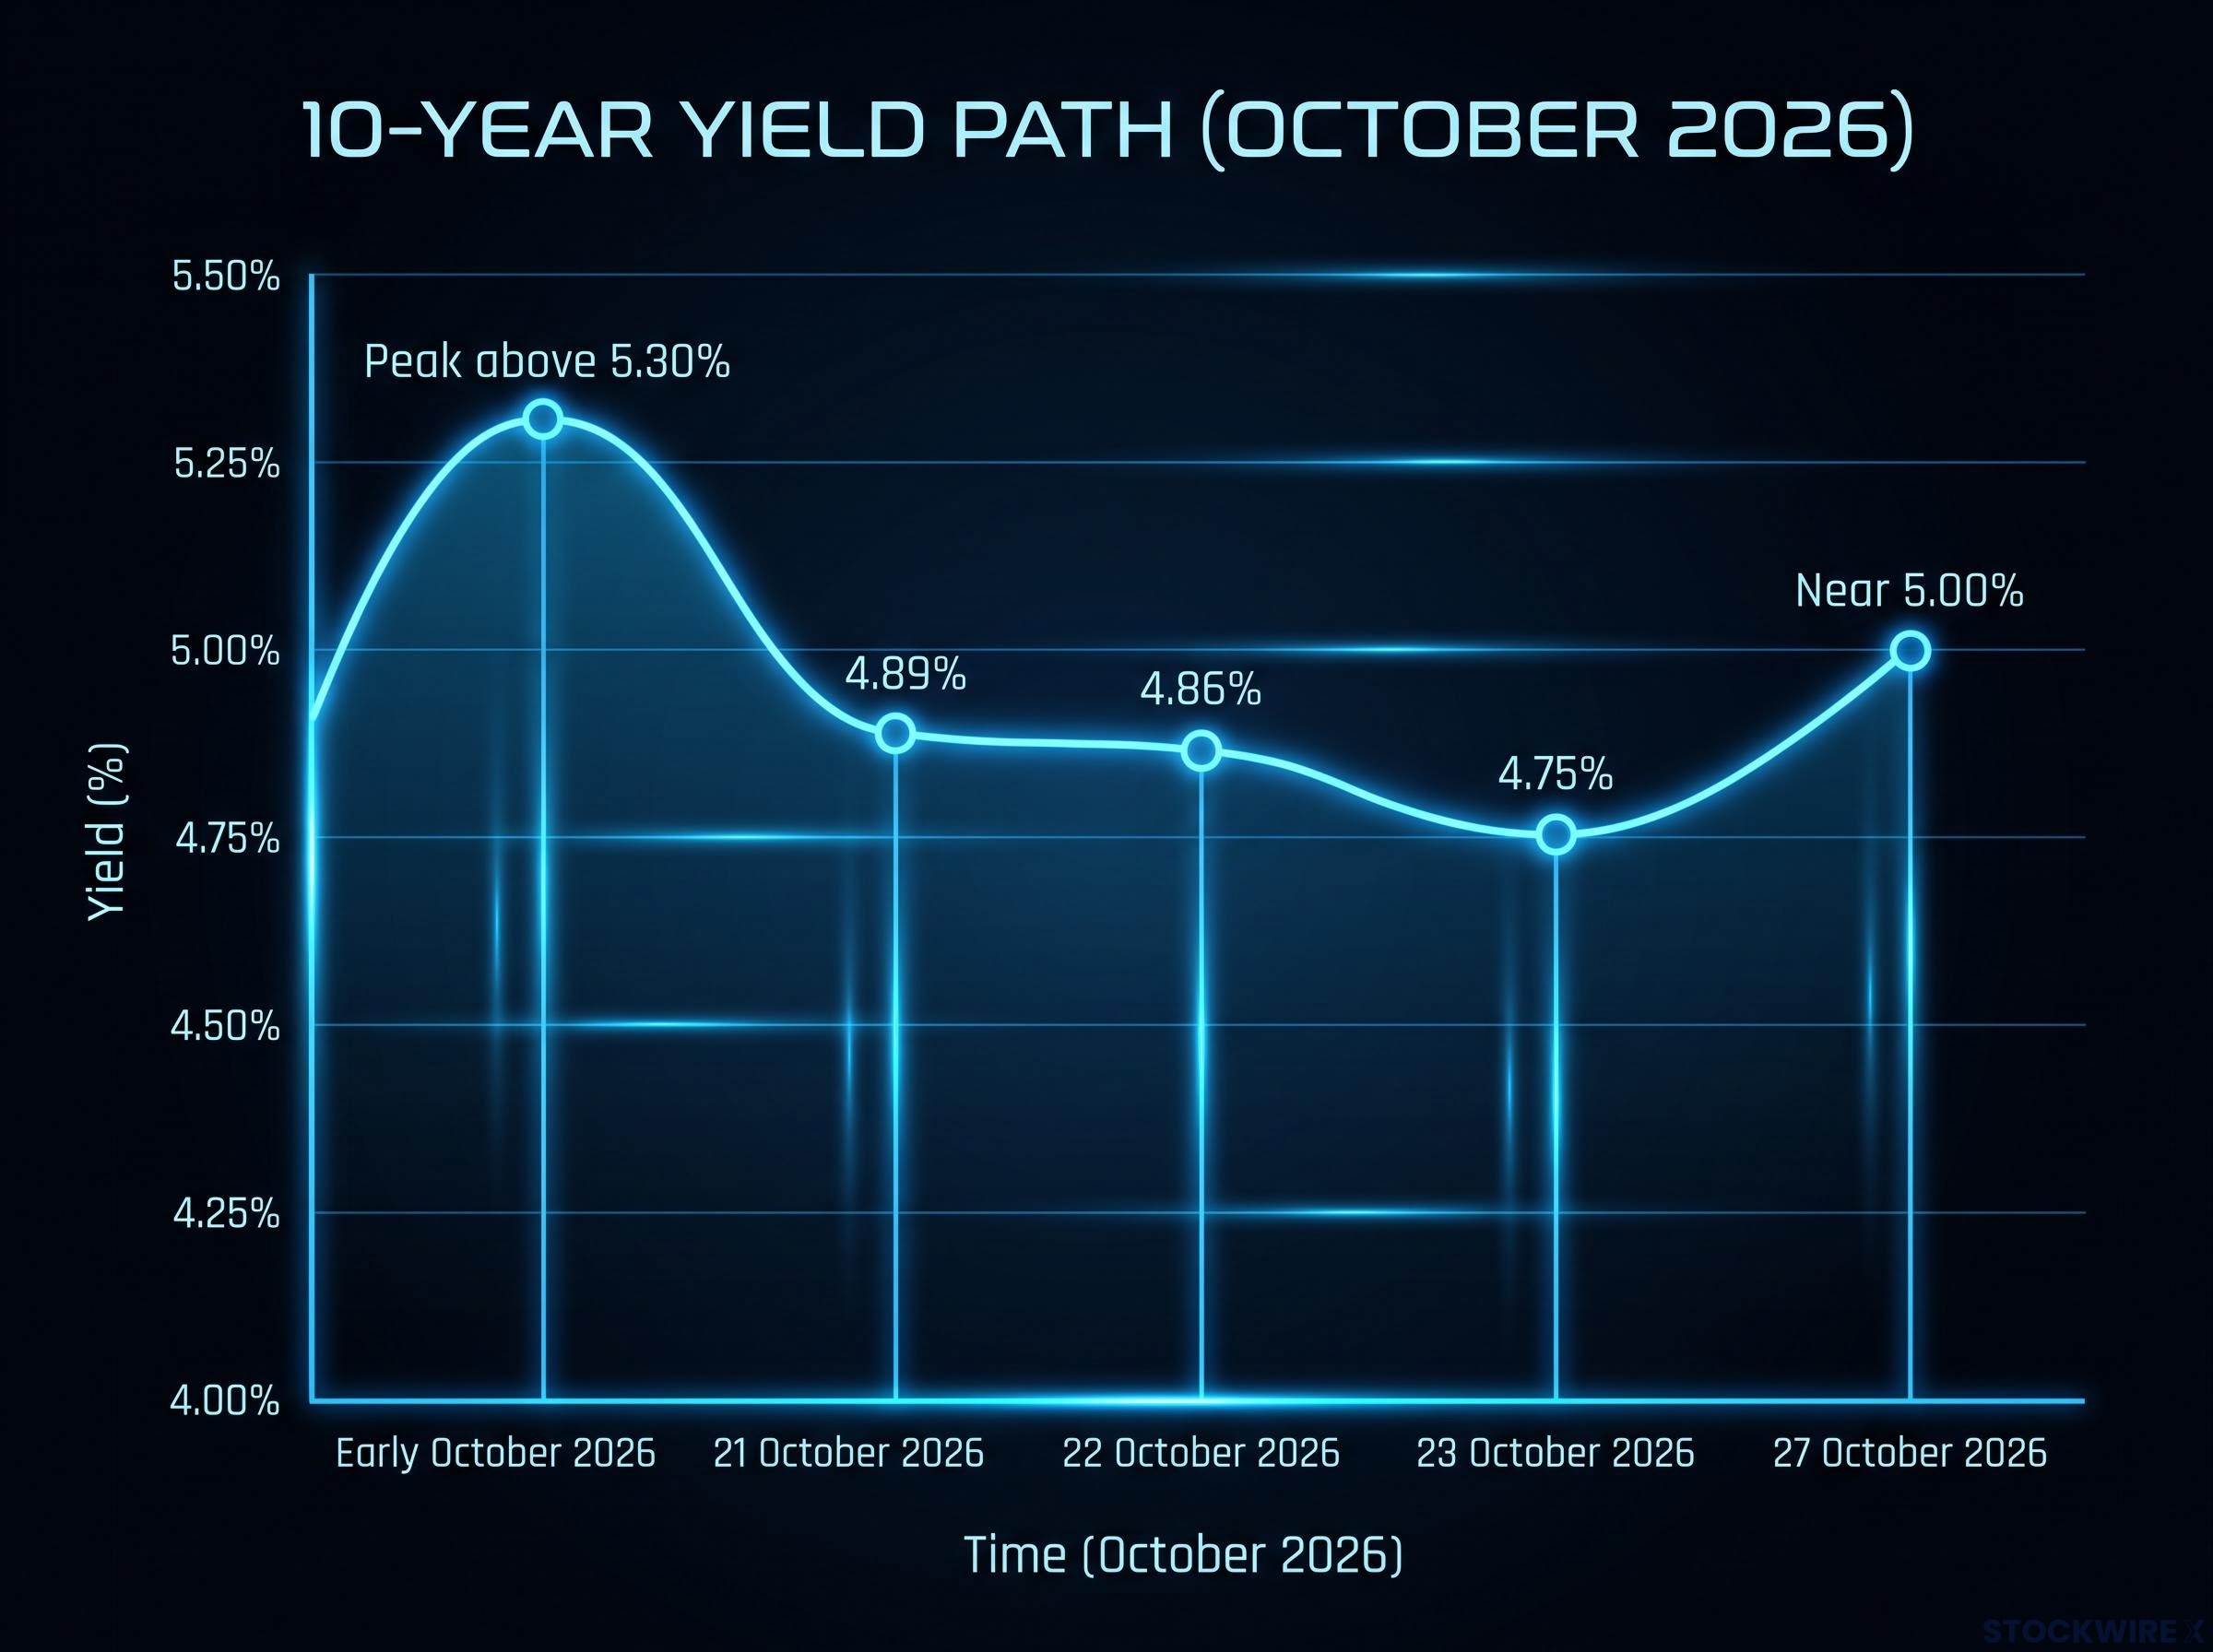
That third point matters right now. The 10-year yield can climb without any Fed tightening, and BlackRock said the 2026 rise in the 10-year was driven mainly by higher real rates. The recent readings show how much it has moved:
| Date | 10-year yield | Source type |
|---|---|---|
| Early October 2026 | Peak above 5.30% | Market reports |
| 21 October 2026 | 4.89% | Official Treasury data |
| 22 October 2026 | 4.86% | Official Treasury data |
| 23 October 2026 | 4.75% | Official Treasury data |
| 27 October 2026 | Near 5.00% | Market reports |
The figures come from different sources and observation times, so read them as a path rather than one clean series.
The term premium is now being rebuilt across the US, Japan, the UK and Australia at the same time, which helps explain why the 10-year can climb even when the Fed is not tightening.
When big ASX news breaks, our subscribers know first
How does a bearish IEF put work, and where can it go wrong?
Those five forces are exactly what a bearish IEF trade is betting on. The appeal of the put is its tidy risk profile. The difficulty is everything else.
Anatomy of a January 92-strike put
A put option gives you the right to sell an asset at a set price, called the strike, before a set date, called expiry. You pay a premium for that right, and the premium is the most you can lose.
The put has intrinsic value, meaning real exercise value, only if IEF finishes below 92 at expiry. Everything else in the premium is time value: what buyers pay for the chance of a move before January.
With IEF near $91.10, the 92 strike is only slightly above the price. IEF also sits below its 200-day average of about $93.98 and close to its 50-day average of about $91.03.
The trader’s view, and it is only his view, is that a roughly 13-month pattern formed in August-September 2025, bottomed early this month and then rallied. He expects IEF to turn at a price gap and fall below the early-month lows.
Compare that with the alternatives:
| Position | Maximum loss | Key cost | Main failure mode |
|---|---|---|---|
| Long IEF put | Premium paid | Time decay and implied volatility | Move too small or too late |
| Short IEF | Open-ended | Borrowing costs | Rally against the position |
| TLT short with stop | Set by stop, but gaps can exceed it | Borrowing costs and slippage | Stopped out near the trader’s 82.20 reference before the thesis works |
A long put cannot be stopped out by an intraday spike. A short position can, and a price gap can push your exit well past the stop. The 82.20 TLT level is the trader’s reference and was not checked against current prices.
Six ways the trade can fail even if yields rise
- Time decay: time value erodes every day and speeds up near expiry.
- Implied volatility: implied volatility is the market’s expected size of future moves. A put buyer is long it, so a drop can cost value even if IEF edges lower.
- Event-volatility repricing: premiums often swell before an FOMC and deflate afterwards, even when the ETF barely moves.
- Rate-cut rally: easing signals, weaker growth or a flight to safety can lift IEF quickly.
- Magnitude: a small decline may not cover the premium.
- Timing: a decline after January expiry pays nothing.
Being directionally right is not enough if the decline is too late or too small.
Because the put is near the money, you are paying mostly for time and volatility. A flat IEF after the press conference can still steadily erode the position.
A put buyer is long implied volatility, so you should check whether a high IV rank reflects genuinely rich premium or just a narrow band, since a pinned rank can still sit on thin absolute volatility.
Where do TLT, LQD and XLU fit the same rate story?
IEF is only one point on a spectrum. Three other tickers carry the same rate variable, each wrapped differently.
TLT is pure long duration. LQD adds credit spread, the extra yield corporate bonds pay over Treasuries for default risk. XLU is equity that behaves like a bond proxy. No verified October 2026 closing levels were found for any of the three, so the levels below are the trader’s.
| ETF | What it holds | Main rate channel | Trader’s level |
|---|---|---|---|
| TLT | Long-term Treasuries | Duration | Stop near 82.20 for shorts |
| LQD | Investment-grade corporate bonds | Duration plus credit spreads | Resistance 104.73; up about 0.25% on the day |
| XLU | Utility stocks | Bond-proxy valuation | Long-term midline as resistance; up about 0.4% |
Thirty-year bond futures (ZB) barely changed on the day. For LQD, a six-year duration implies roughly a 6% loss per one-point rise in yields, before income, and wider spreads can add to that.
XLU feels rates through three channels:
- Utility dividends compete with Treasury yields for income buyers.
- Capital-heavy utilities depend on borrowing, so financing costs bite.
- Higher discount rates cut the present value of future cash flows.
The crowding risk sits in TLT.
Crowded trade Morningstar reported that 27% of surveyed fund managers called short TLT a crowded trade, and October saw substantial fixed-income short covering.
A short squeeze happens when bearish traders rush to buy back positions, pushing prices higher. If you hold or watch any of these, a falling-yield surprise would hit bearish positions in all three at once. They are not independent hedges.
Does the 2022-2023 bond decline make the bearish case stronger or weaker today?
The bear’s strongest argument comes from recent history, and it is dramatic.
What the parallel gets right
Lombard Odier’s comparison shows the 10-year yield climbing from about 1.76% in January 2022 to about 4.99% at its October 2023 peak. The 2-year rose from about 0.95% to about 5.22%. The trader describes bonds falling about 20-25% after rates left zero, bottoming in autumn 2023, though that figure is his characterisation rather than independently measured.
The ingredients then were sticky inflation, a Fed slow to act, heavy deficits, rising real yields and forced selling. Some echo now: September CPI rose 0.6% month on month and 3.7% year on year, while August core PCE ran at 3.0%. PIMCO’s Dan Ivascyn flagged a 6% 10-year yield as a tail risk if leveraged investors are forced to unwind.
Why today differs
The differences pile up quickly.
| Factor | 2022-2023 | Now |
|---|---|---|
| Starting policy rate | Near zero | 3.75%-4.00% |
| Inflation | Rising sharply | CPI 3.7% y/y; core PCE 3.0% |
| Supply | Heavy issuance | Auctions held at $58B 3-year, $42B 10-year, $25B 30-year |
| Balance sheet | Moving to runoff | Buying bills for reserve management |
September payrolls rose just 29,000, with unemployment at 4.2%. Mackenzie Investments’ Dustin Reid said 6% is not his base case, partly because of Treasury buying and strong auctions. BlackRock is overweight shorter Treasuries and neutral on the long end, arguing markets may have priced too much further tightening.
What strengthens the bear case:
- The Fed validates a December hike.
- Inflation stays near 3%-4%.
- Real yields keep rising.
- Supply widens the term premium.
What weakens it:
- A less hawkish press conference.
- Softer labour data or September PCE, due 29 October.
- Short covering in crowded positions.
- Much of the risk already being discounted.
The read you should take: this put is a bet on a December hike or sticky inflation, not on a repeat of 2022. The Fed is starting from a far higher rate, and much of the repricing has already happened.
For readers wanting the portfolio-level view, our full explainer on the bond bear market shows how shortening duration to the 2-4 year range reduces exposure to further rate shocks.
Reading the Fed’s signal: what to watch before taking a rate-sensitive view
The calm reflects a priced hold. The IEF put is a defined-risk bet on a December hike or stubborn inflation, and its main threats are a softer Fed and a squeeze in crowded shorts.
Rising long yields can act as market-driven tightening, which is one reason a Fed that holds is not necessarily a Fed that is easing, and why a December hike is not automatic.
Your watch list is short:
- The FOMC statement and press conference tone.
- September PCE on 29 October.
- October jobs data on 6 November.
- Real yields.
- The 10-year against its recent 4.75%-5.00% readings.
The FOMC outcome was not available when this was written, so check the actual decision first. If you weigh a similar trade, your decisions come down to size, expiry and how much premium you are willing to lose if the move never arrives.
This article is for informational purposes only and should not be considered financial advice. Investors should conduct their own research and consult with financial professionals before making investment decisions. Past performance does not guarantee future results, and the views cited are speculative and subject to change.