If you see the gap between 2-year and 10-year Treasury yields sitting in positive territory and assume the bond market has calmed down, look again. The 2s10s spread, the most watched gauge of yield curve steepening, stood at about +29 basis points on 27 October, according to the Federal Reserve Bank of St. Louis FRED database.
That calm-looking number hides a lot of motion. Over the past two months the spread has swung between roughly 20 and 50 bp, changing direction about every two weeks, according to Samantha Leuke of Leuke Trading.
The bond market is caught between pricing a growth scare and pricing a duration scare. Which one wins will shape what happens to equities, the dollar and the yen into the 3 November midterms and the Federal Open Market Committee (FOMC) and European Central Bank (ECB) meetings. As of 28 October, both the October FOMC decision and October CPI, due 10 November, are still pending.
This explainer gives you a way to tell a healthy steepener from a worrying one, plus a dated list of what to watch.
What does yield curve steepening actually mean, and why are there two kinds?
Reading the spread
On a screen, the 2s10s is one number: the 10-year Treasury yield minus the 2-year yield. A basis point is one-hundredth of a percentage point, so +29 bp means the 10-year pays 0.29 percentage points more than the 2-year.
A positive reading is the normal state, because lenders usually want extra pay to tie up money for longer. A flat reading means the market sees little difference between the near and distant future. An inverted reading, where the 2-year pays more, has historically been linked to expectations of slower growth and rate cuts ahead.
The daily figures jump around. U.S. Treasury data for 26 October put the 2-year at 4.79% and the 10-year at 5.00%, implying about +21 bp, while FRED showed +29 bp a day later. That gap is ordinary day-to-day movement, and it is a reminder not to read too much into any single print.
Why the cause matters more than the number
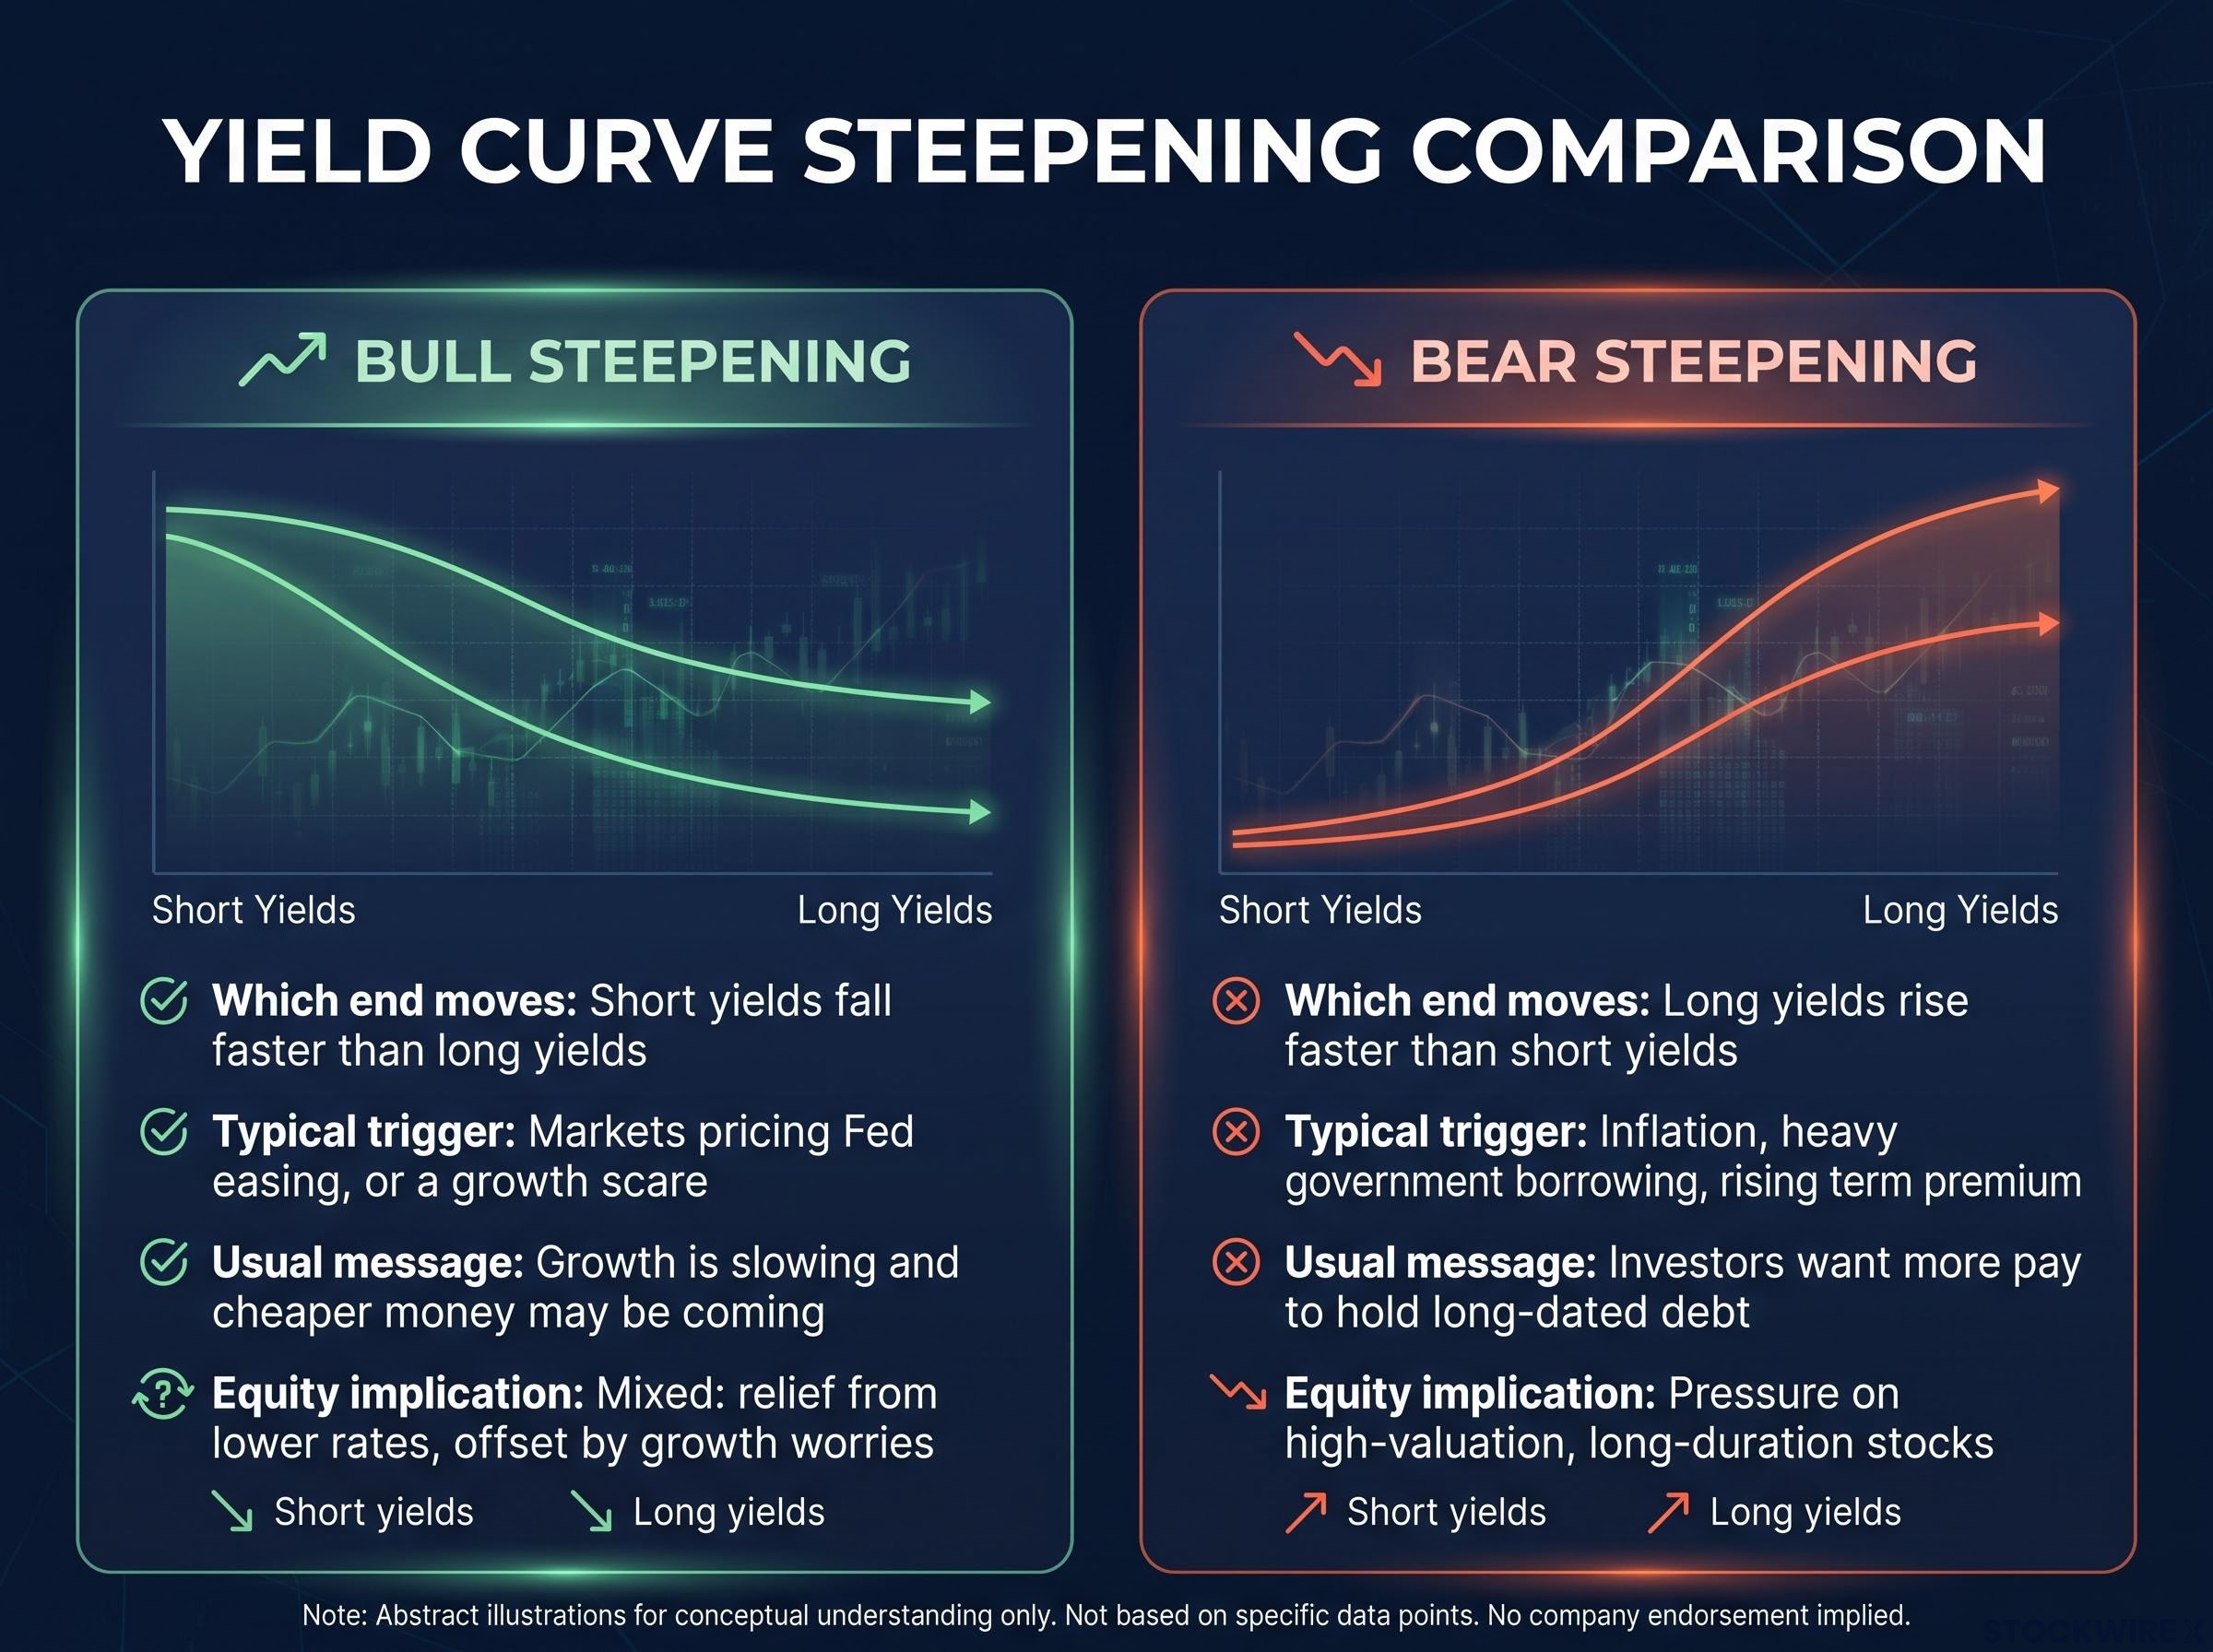
The curve can steepen in two very different ways.
| Type | Which end moves | Typical trigger | Usual message | Typical equity implication |
|---|---|---|---|---|
| Bull steepening | Short yields fall faster than long yields | Markets pricing Fed easing, or a growth scare | Growth is slowing and cheaper money may be coming | Mixed: relief from lower rates, offset by growth worries |
| Bear steepening | Long yields rise faster than short yields | Inflation, heavy government borrowing, rising term premium | Investors want more pay to hold long-dated debt | Pressure on high-valuation, long-duration stocks |
Term premium is the extra yield investors demand for the risk of holding a long-term bond instead of rolling over short-term ones.
You can think of term premium as the price of uncertainty: when supply of long-dated debt grows and central banks step back as buyers, you are paid more to hold duration, and that shows up as a bear steepener.
The 2022-2024 episode shows why this matters. The 2s10s inverted as the Fed raised rates quickly, and its return to positive territory did not prove that a healthy recovery had arrived. An inversion can end because the front end falls on expected easing, because the long end rises on inflation or fiscal fears, or both.
So a positive spread is not automatically good news for you. What counts is whether the move comes from hopes of Fed cuts or from investors demanding more compensation to hold long debt.
When big ASX news breaks, our subscribers know first
Why is the bond market stuck between a growth scare and a duration scare?
The current episode began at the long end. Worries about government borrowing and term premium pushed long yields up, steepening the curve from roughly flat in late August to about 50 bp in early October. Then the short end took over, as hot inflation data and a higher-for-longer Fed pushed the 2-year up and narrowed the gap again.
Reuters recorded the spread slipping from 51.4 bp to 48.9 bp on 8 October. By late October it was in the twenties.
The shrinking official share of Treasuries, which fell from about 46% through 2016 to 27% at end-2025, pushes more duration onto price-sensitive private buyers, a structural reason the long end can keep rising even when the Fed holds.
An undecided bond market Leuke describes a bond market that cannot decide whether to price deflation or inflation, which is why the curve keeps lurching. If a growth scare wins, she sees the curve inverting again by Q1 or Q2 next year. If a duration scare wins, she sees it steepening by about 100 bp.
The case for a duration scare
The inflation data lean this way:
- September CPI rose 0.6% month on month and 3.7% year on year (released 14 October)
- September PPI final demand rose 1.3% month on month
- August headline PCE ran at 3.8% year on year, partly on energy prices
- Core PCE sat at about 3.0%, well above the Fed’s 2% goal
The 10-year climbed to somewhere between roughly 5.3% and 5.5% at its peak, depending on the source. The 10s30s spread, the gap between 10-year and 30-year yields, widened about 52 bp in late July and about 37 bp in the week reported on 9 October.
The case for a growth scare
The opposing camp expects yields to ease. A Reuters poll of nearly 60 strategists on 7 October forecast the 10-year at about 5.00% by year-end, with the 2-year falling more slowly to about 4.70% in three months. Reuters commentary on 19 August added that shifting Treasury financing toward short-term bills could support a bull steepener, though suppressing term premium that way might prove short-sighted.
| Source | Date | Position |
|---|---|---|
| Alex Morris, F/m Investments | 9 October | Wider 10s30s reflects rising term premium and long-run fiscal worry |
| Chris Maxey, Wealthspire | 27 October | Deficits near 6% of GDP and about $40 trillion of debt could lift yields even if the Fed holds |
| Oli Shale, Ruffer | 27 October | Elections unlikely to deliver meaningful fiscal restraint |
| Reuters strategist poll | 7 October | Yields drift lower, curve stays positive but less steep |
Because the curve can steepen and partly re-invert without one story taking hold, treat any single day’s move as noise. Watch which end of the curve is doing the moving.
How does volatility migrate from rates to equities to currencies?
Leuke’s argument is that volatility is not fading. It is moving. Here is the chain as she lays it out:
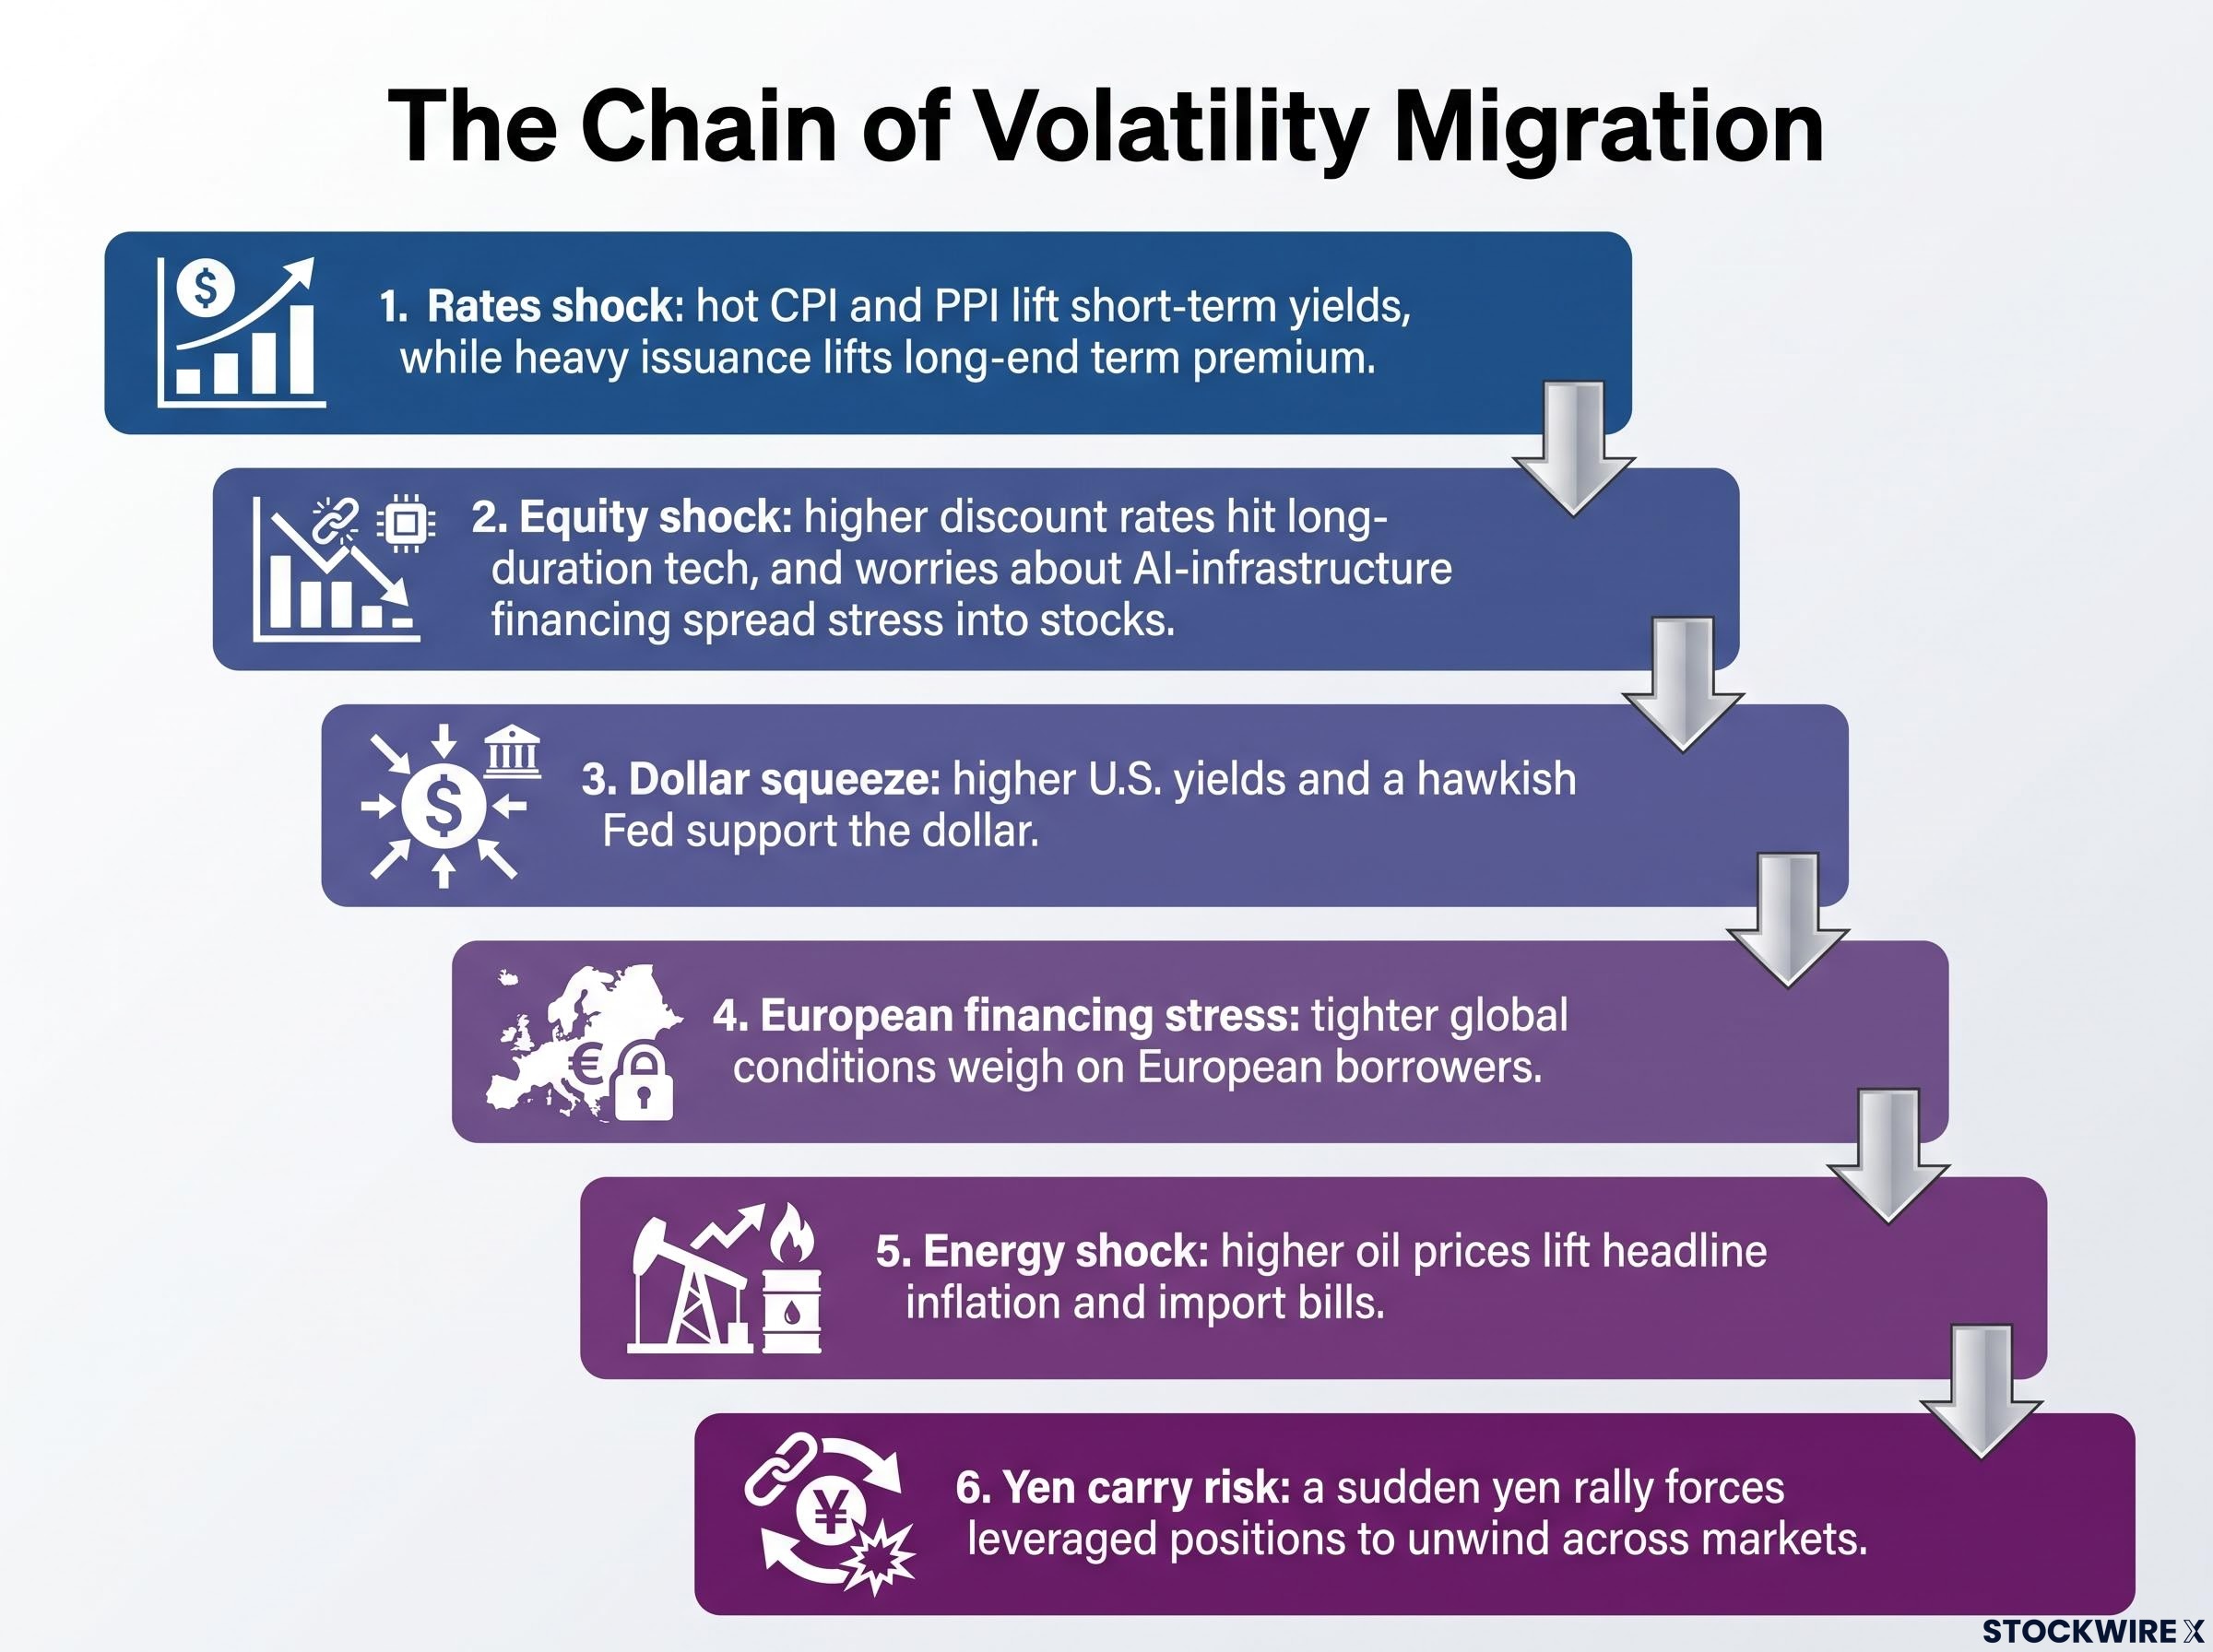
- Rates shock: hot CPI and PPI lift short-term yields, while heavy issuance lifts long-end term premium.
- Equity shock: higher discount rates hit long-duration tech, and worries about AI-infrastructure financing spread stress into stocks.
- Dollar squeeze: higher U.S. yields and a hawkish Fed support the dollar.
- European financing stress: tighter global conditions weigh on European borrowers.
- Energy shock: higher oil prices lift headline inflation and import bills.
- Yen carry risk: a sudden yen rally forces leveraged positions to unwind across markets.
Dollar, euro and energy
Each link feeds the next. Higher yields pull money into the dollar, a weaker euro tightens European financing, and pricier energy worsens both. Leuke argues a stronger dollar and rising energy prices could decide where equities go from here.
| Market | Latest level | Date | Role in the chain |
|---|---|---|---|
| EUR/USD | $1.1144 | 27 October | European financing stress |
| Dollar index | 101.80 | 26 October | Dollar squeeze |
| Brent crude | $106.06 | 14 October | Energy shock |
| USD/JPY | 157.73 | 27 October | Yen carry risk |
The euro sits close to 1.11. A break below 1.10 could start a self-reinforcing rush for safety and liquidity, a risk raised in Leuke’s interview. The ECB’s October commentary pointed the other way on rates: it said earlier hikes were showing up in its Bank Lending Survey, called underlying inflation more benign and signalled no immediate hike. Leuke also cites stress at Deutsche Bank.
The equity bar is high. Earnings have been elevated for six quarters, and consensus next-year earnings imply an S&P 500 near 8,400, about 21 times earnings. Companies such as Broadcom are accepting higher rates to raise money, which shows how rate pressure flows into corporate funding.
The delayed yen carry risk
A carry trade means borrowing in a low-yielding currency, here the yen, to buy higher-yielding assets elsewhere. If the yen jumps, those loans become more expensive to repay, and traders sell assets everywhere to cover them. That is what happened in August 2024.
A warning shot came in September, when a rapid yen rally ahead of an expected Bank of Japan hike pushed dollar/yen implied volatility to a six-month high. Even so, Leuke expects a full unwind next year, not now.
Not everyone accepts the chain. Some see higher yields as a temporary supply shock that ends in a bull steepener, while others see fiscal deficits and AI borrowing as lasting pressures. Carry positions can also be rebuilt, and the yen depends heavily on Bank of Japan policy and intervention. The lesson for you is that a calm equity index tells you little about risk elsewhere, so watch the dollar, euro and yen for early signals.
Readers interested in telling a true unwind from a funding cost repricing can use our full explainer on yen carry repricing, which compares September 2026 conditions with the August 2024 crash.
What should you watch from the midterms, FOMC and ECB, and where could this go wrong?
| Date or event | What is at stake | Signal to watch |
|---|---|---|
| October FOMC (pending) | Pause versus renewed tightening | Whether the 2-year rises or eases |
| ECB meeting | Euro direction and European financing | EUR/USD versus the 1.10 level |
| 3 November midterms | AI buildout pace and fiscal outlook | Long-end yields and term premium |
| After 4 November | Whether equity momentum follows through | Growth stock leadership over several weeks |
| 10 November October CPI | Duration-scare confirmation | Another hot monthly print |
Leuke sees seasonality as supportive into the midterms, with growth stocks oversold after leading in September and giving way to value in October. Semiconductor and memory stocks fell roughly 50% from their June highs. A Democratic win of one or both chambers could slow the AI buildout, and Reuters listed midterm uncertainty among the forces pressing on the long end.
Leuke reads the relatively contained VIX as a sign that investors are still long AI but hedged, rather than selling.
Not over yet Leuke argues rate volatility is not finished, and that post-midterm seasonality may be tested by currency swings.
The caveats deserve equal weight:
- Seasonality can be overwhelmed by inflation, war, energy or policy surprises
- Energy-driven inflation may fade, or may spread into wages and expectations
- Six quarters of elevated earnings set a demanding bar for 2027
- The curve could re-invert if the Fed holds firm while long yields fall on growth fears
- The yen unwind may be delayed further if the Bank of Japan disappoints
Treat the weeks after 4 November as the real test. Seasonality only helps if currency and rate volatility do not swamp it.
These views are speculative and subject to change based on market developments. Past performance does not guarantee future results.
What steepening does and does not tell you heading into November
A steepening curve tells you something is changing, not whether that change is good. The message depends on which end is moving, and right now the inflation data favour the duration-scare reading over a clean growth scare.
Three variables should settle the debate. First, whether the FOMC and October CPI confirm sticky inflation. Second, whether long-end term premium keeps rising after the midterms. Third, whether the dollar strengthens and the yen stays calm.
Hold your conclusions loosely. Watch the drivers rather than the spread itself, and treat the yen carry unwind as a risk to monitor next year, not a trigger for today.
This article is for informational purposes only and should not be considered financial advice. Investors should conduct their own research and consult with financial professionals before making investment decisions.