Hormuz tanker traffic is recovering, so the oil scare should be fading. Yet October flows through the strait reached roughly 82% of pre-war levels, and Brent crude still closed at $116.72 a barrel on 23 October. If the barrels are moving again, why are oil prices around the Strait of Hormuz still behaving as if they are not?
The answer matters more this week than most. Israel’s election is underway or imminent, and its outcome had not been confirmed at the time of writing. On 26 October, CNN reported that US forces in the region could launch major operations against Iran within 96 hours of a presidential order.
Strategist David Woo argues oil markets have not priced the chance of a strike at all.
Here is a working framework for judging that claim yourself. It covers whether oil is underpricing risk, and how a fresh spike could travel through real yields into your Treasuries and equities.
Why oil stays expensive even when Hormuz barrels are moving again
Start with the volumes. According to Kpler data cited by Reuters columnist John Kemp, Hormuz flows averaged 11.7 million barrels per day (bpd) in October, up from 9.75 million bpd in September.
That sounds like recovery. Then you look at what it costs to get those barrels to a refinery.
Tanker transits ran about 70% below pre-conflict levels in the week to 14 October. Freight for a very large crude carrier (VLCC, the supertankers that move most Gulf crude) sits around $32/bbl, while Kpler puts Gulf-to-China freight at $37.37/bbl, with other estimates closer to $40/bbl. Insurance now runs at about 10% of cargo value, against roughly 3% before the war.
The delivery premium in one number Goldman Sachs estimates global average oil freight at about $20/bbl, up from $3 a year earlier.
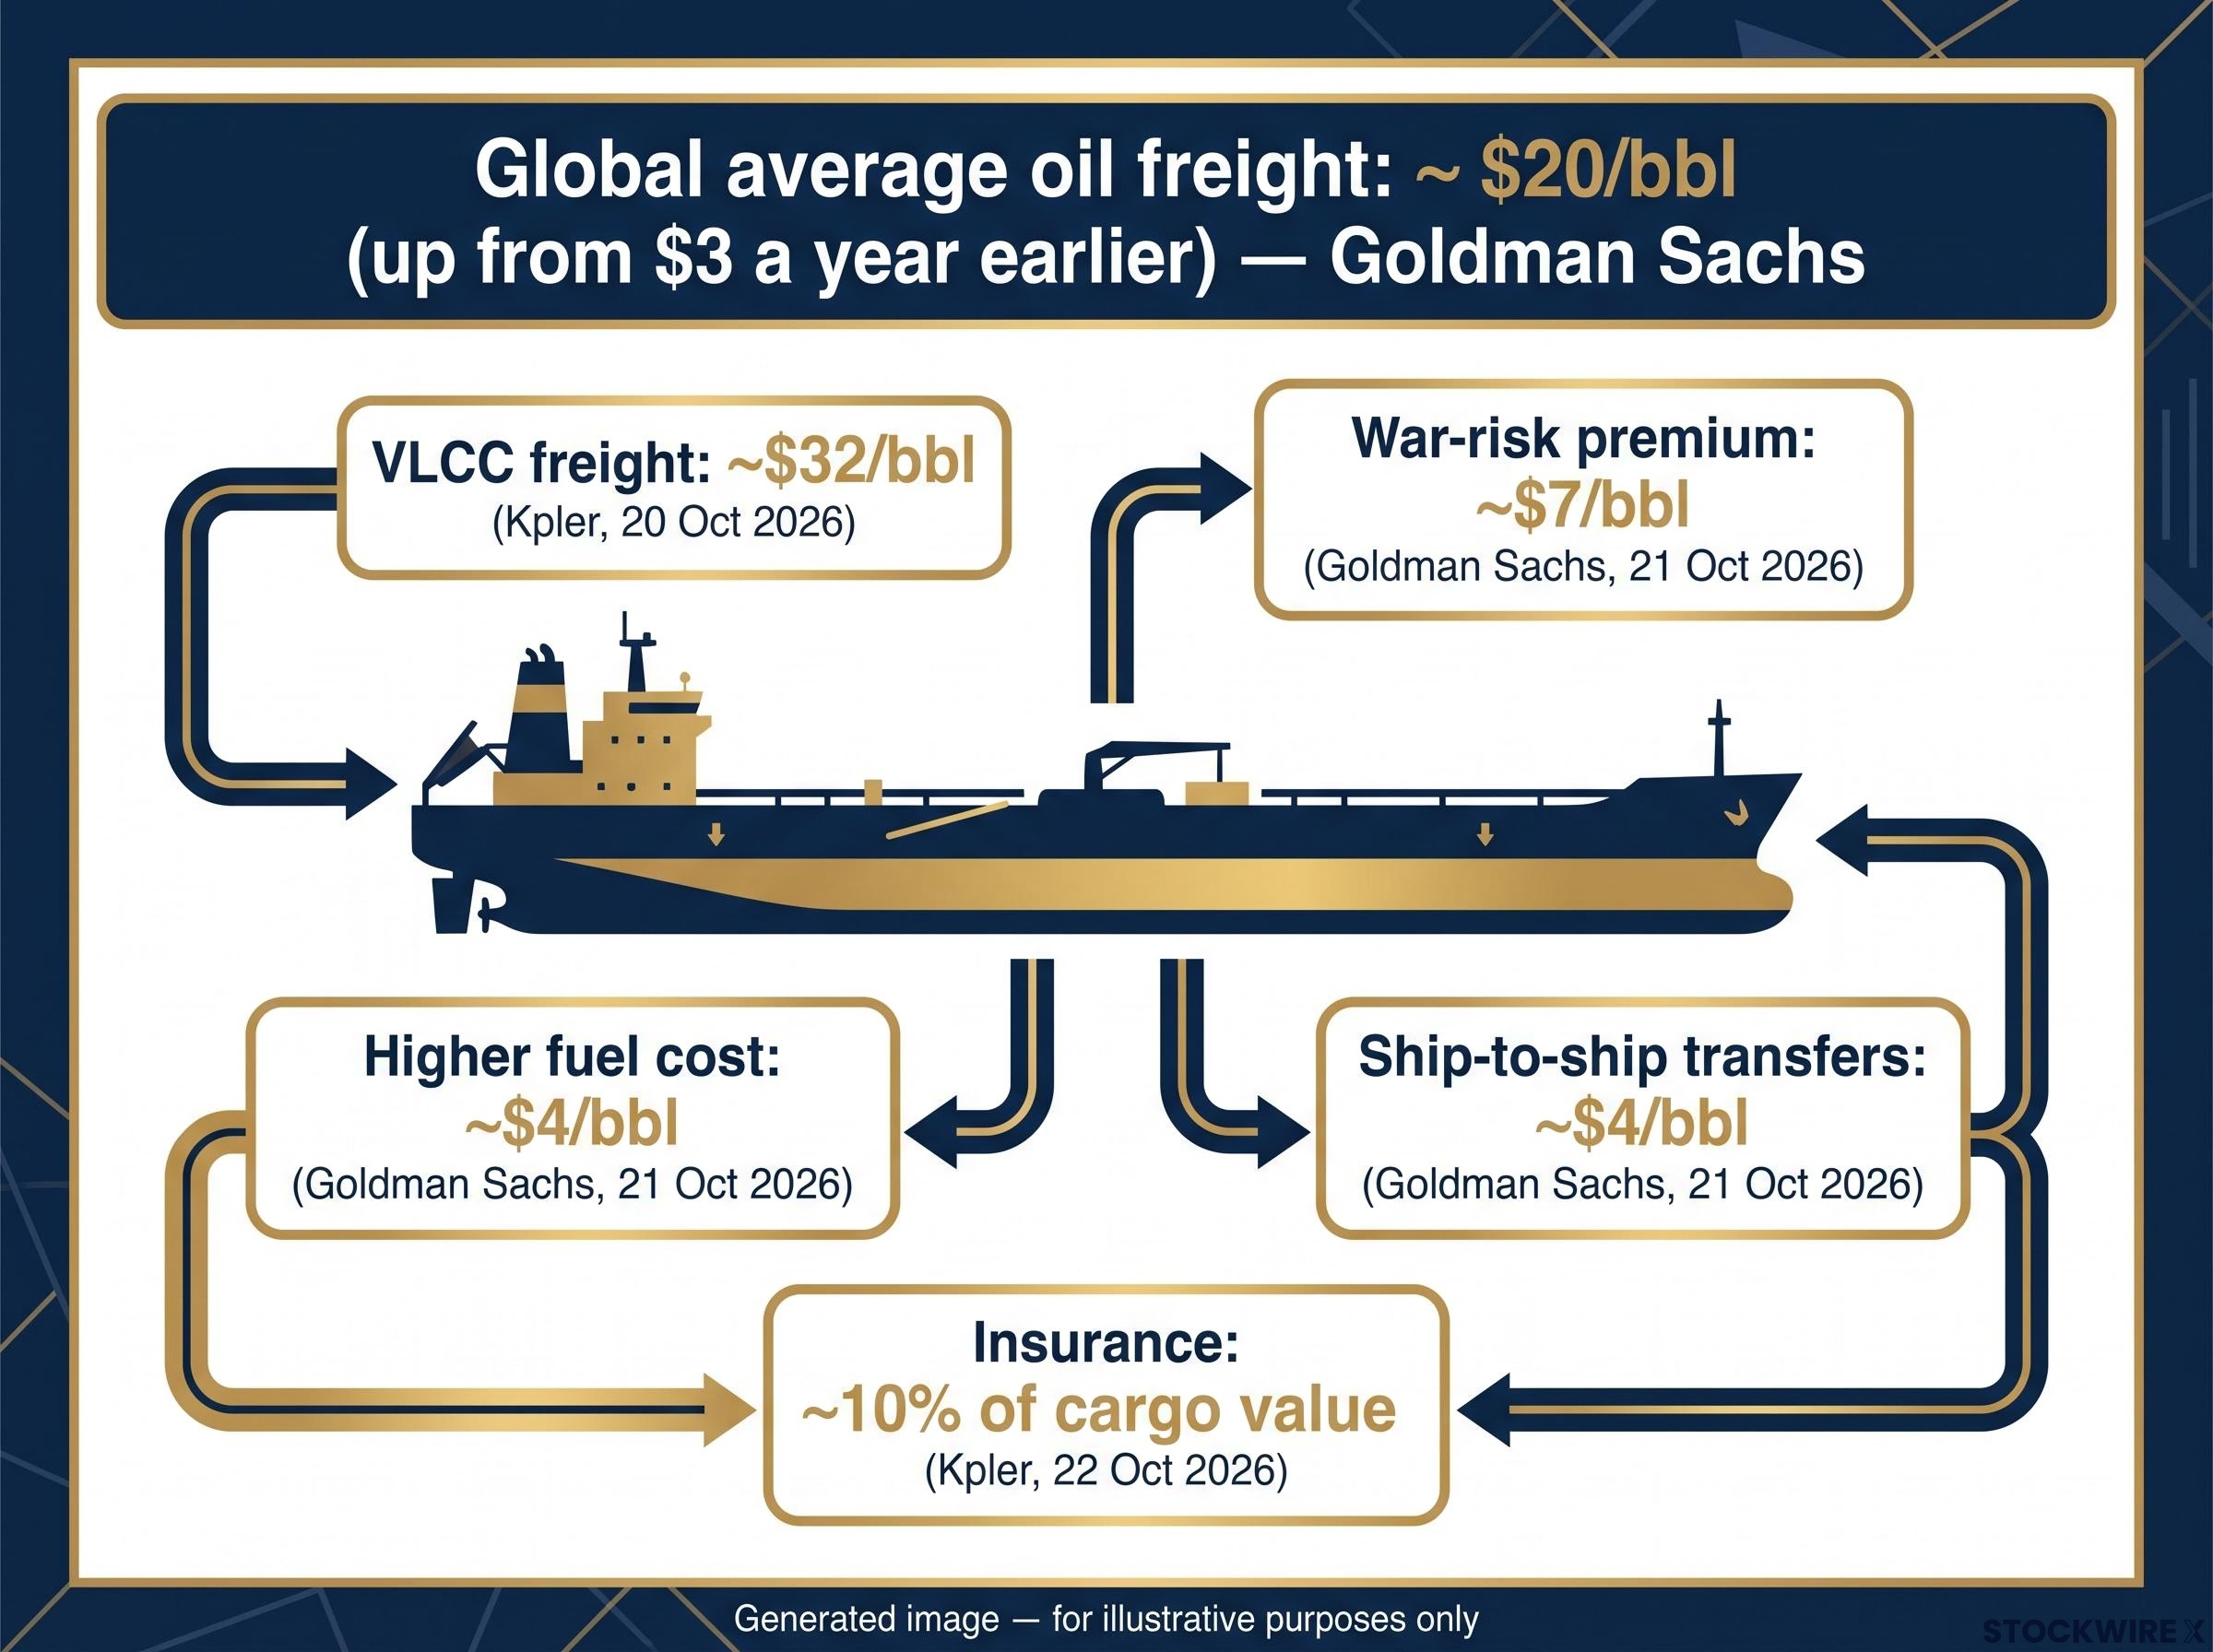
| Component | Figure | Source | Date |
|---|---|---|---|
| VLCC freight | ~$32/bbl | Kpler | 20 October 2026 |
| War-risk premium | ~$7/bbl | Goldman Sachs | 21 October 2026 |
| Higher fuel cost | ~$4/bbl | Goldman Sachs | 21 October 2026 |
| Gulf of Oman ship-to-ship transfers | ~$4/bbl | Goldman Sachs | 21 October 2026 |
| Insurance | ~10% of cargo value | Kpler | 22 October 2026 |
Buffers are thin too. The US Strategic Petroleum Reserve (SPR, the government’s emergency crude stockpile) holds about 283 million barrels, the lowest since October 1982. Analyst Aaron Kildow estimates usable strategic stocks outside China and Iran have fallen by nearly 327 million barrels since the end of 2025.
JPMorgan describes energy-security shocks like this as structural. Buyers are paying for reliability, optionality and duration, not just for crude.
Why the flow numbers disagree
You will see other figures quoted. One Kpler estimate of about 14 million bpd includes offshore transfers, and a recent weekly low of 10.1 million bpd covers a single week. Crude-only counts, alternative routes and longer measuring periods all produce different answers.
Why Iran does not need to close the strait
At least 18 vessel attacks were reported over two weeks, according to Reuters, with warnings that attacks are spreading beyond Hormuz. Harassment keeps freight and insurance elevated, and high prices benefit Iran without it carrying the blame for a formal closure.
Sharp intraday oil price volatility around armed exchanges near the strait can mask the broader direction of travel, which is why you should judge the delivery premium rather than any single day’s swing.
The lesson for you: a headline flow figure is a poor guide on its own. What you are really watching is the cost and certainty of delivery.
When big ASX news breaks, our subscribers know first
What is the case that a strike is more likely than markets assume?
That delivery premium prices harassment. Woo’s argument is that it does not price escalation.
He puts the odds of US-Israeli military action against Iran at over 50%, within one to two weeks in his original remarks. Research summaries frame his call more broadly as before the US midterms on 3 November.
His chain runs like this. He believes Trump and Netanyahu wanted to strike the previous weekend, but the Israel Defense Forces (IDF) chief of staff blocked it, citing the election’s proximity. Once voting ends, that objection disappears.
Even if Netanyahu loses, forming a government may take weeks, which Woo argues gives Trump a window to act while Netanyahu remains prime minister. Polls project a left-leaning win, but Woo suggests a “war bias” among about half a million young first-time voters could lift the right.
The documented readiness CNN reported on 26 October, citing US officials, that forces already deployed in the Middle East could launch potentially major operations within 96 hours of a presidential order. Trump had not made a final decision.
What is documented and what is inference
Documented in reporting:
- US forces are positioned and could act within 96 hours of an order (CNN).
- Netanyahu sought approval for further strikes; US officials asked Israel to wait for possible coordinated operations.
- CNN’s officials saw action after 3 November as more likely, and assigned no probability.
- The election result had not been confirmed as of 27 October.
Woo’s inference:
- The IDF chief blocked a weekend strike.
- Trump believes the midterms are lost and would act to protect his legacy.
- A diesel deal with Putin signals Trump would trade Ukraine concessions to avoid backing down on Iran.
Notice the gap. Readiness is not a decision, so the real question for you is whether the market is wrong about timing and probability, or correctly pricing readiness alone.
What do the sceptics say, and where do Saudi pricing and policy fit?
Woo’s thesis deserves a hearing. So do the institutions modelling something quite different.
Goldman Sachs, JPMorgan, the International Energy Agency (IEA) and the US Energy Information Administration (EIA) build their forecasts around supply response, falling demand and gradual normalisation rather than a strike.
| Source | Outlook | Key assumption | Date |
|---|---|---|---|
| Goldman Sachs | Year-end Brent ~$90, upside risks | Prolonged freight and attack risk as upside | October 2026 |
| EIA | Q4 2026 ~$105; 2027 ~$83.74 | Elevated prices ease | October 2026 |
| JPMorgan (Natasha Kaneva) | Extra production through 2027 | Constrained flows encourage output | 2 October 2026 |
| IEA | 2026 demand -2.6M bpd, supply -5.8M bpd | Fragile supply recovery | 2026 |
| State Street Global Advisors | Near “peak escalation” | Upside risk before stabilisation | 2026 |
Then there is Saudi Arabia. On 4 October, Reuters reported that Saudi Aramco cut its November Arab Light official selling price (OSP, the monthly price Aramco sets for buyers) to Asia by $3, to $5 below the Oman/Dubai benchmark, the deepest discount since 2020. That defends market share and offsets some freight pain, but it does not remove the cost of safe delivery.
The sceptics lean on several buffers:
- Production response as high prices draw out extra barrels
- Demand destruction, led by China
- Strategic reserves, though thin
- Rerouting via pipelines and Gulf of Oman transfers
- Saudi and OPEC pricing that adds available supply
Their strongest point is the simplest. Oil may be correctly separating military readiness from an actual loss of export capacity.
Goldman’s year-end view rests on how much of today’s price is a geopolitical premium, which it puts at just over $20 a barrel, and on whether that portion can unwind quickly if damage stays contained.
Lessons from 2019 and June 2025
The September 2019 Abqaiq attack briefly knocked out roughly half of Saudi output; Brent spiked at the open, then retraced as production returned faster than feared. In the June 2025 Israel-Iran conflict, the premium faded once shipping kept moving.
This episode has already lasted longer, with freight and insurance impaired for months. So whether oil is underpriced depends less on strike odds than on how long Gulf supply would stay physically impaired. That duration is the variable to watch.
How an oil spike could travel into real yields, Treasuries and equities
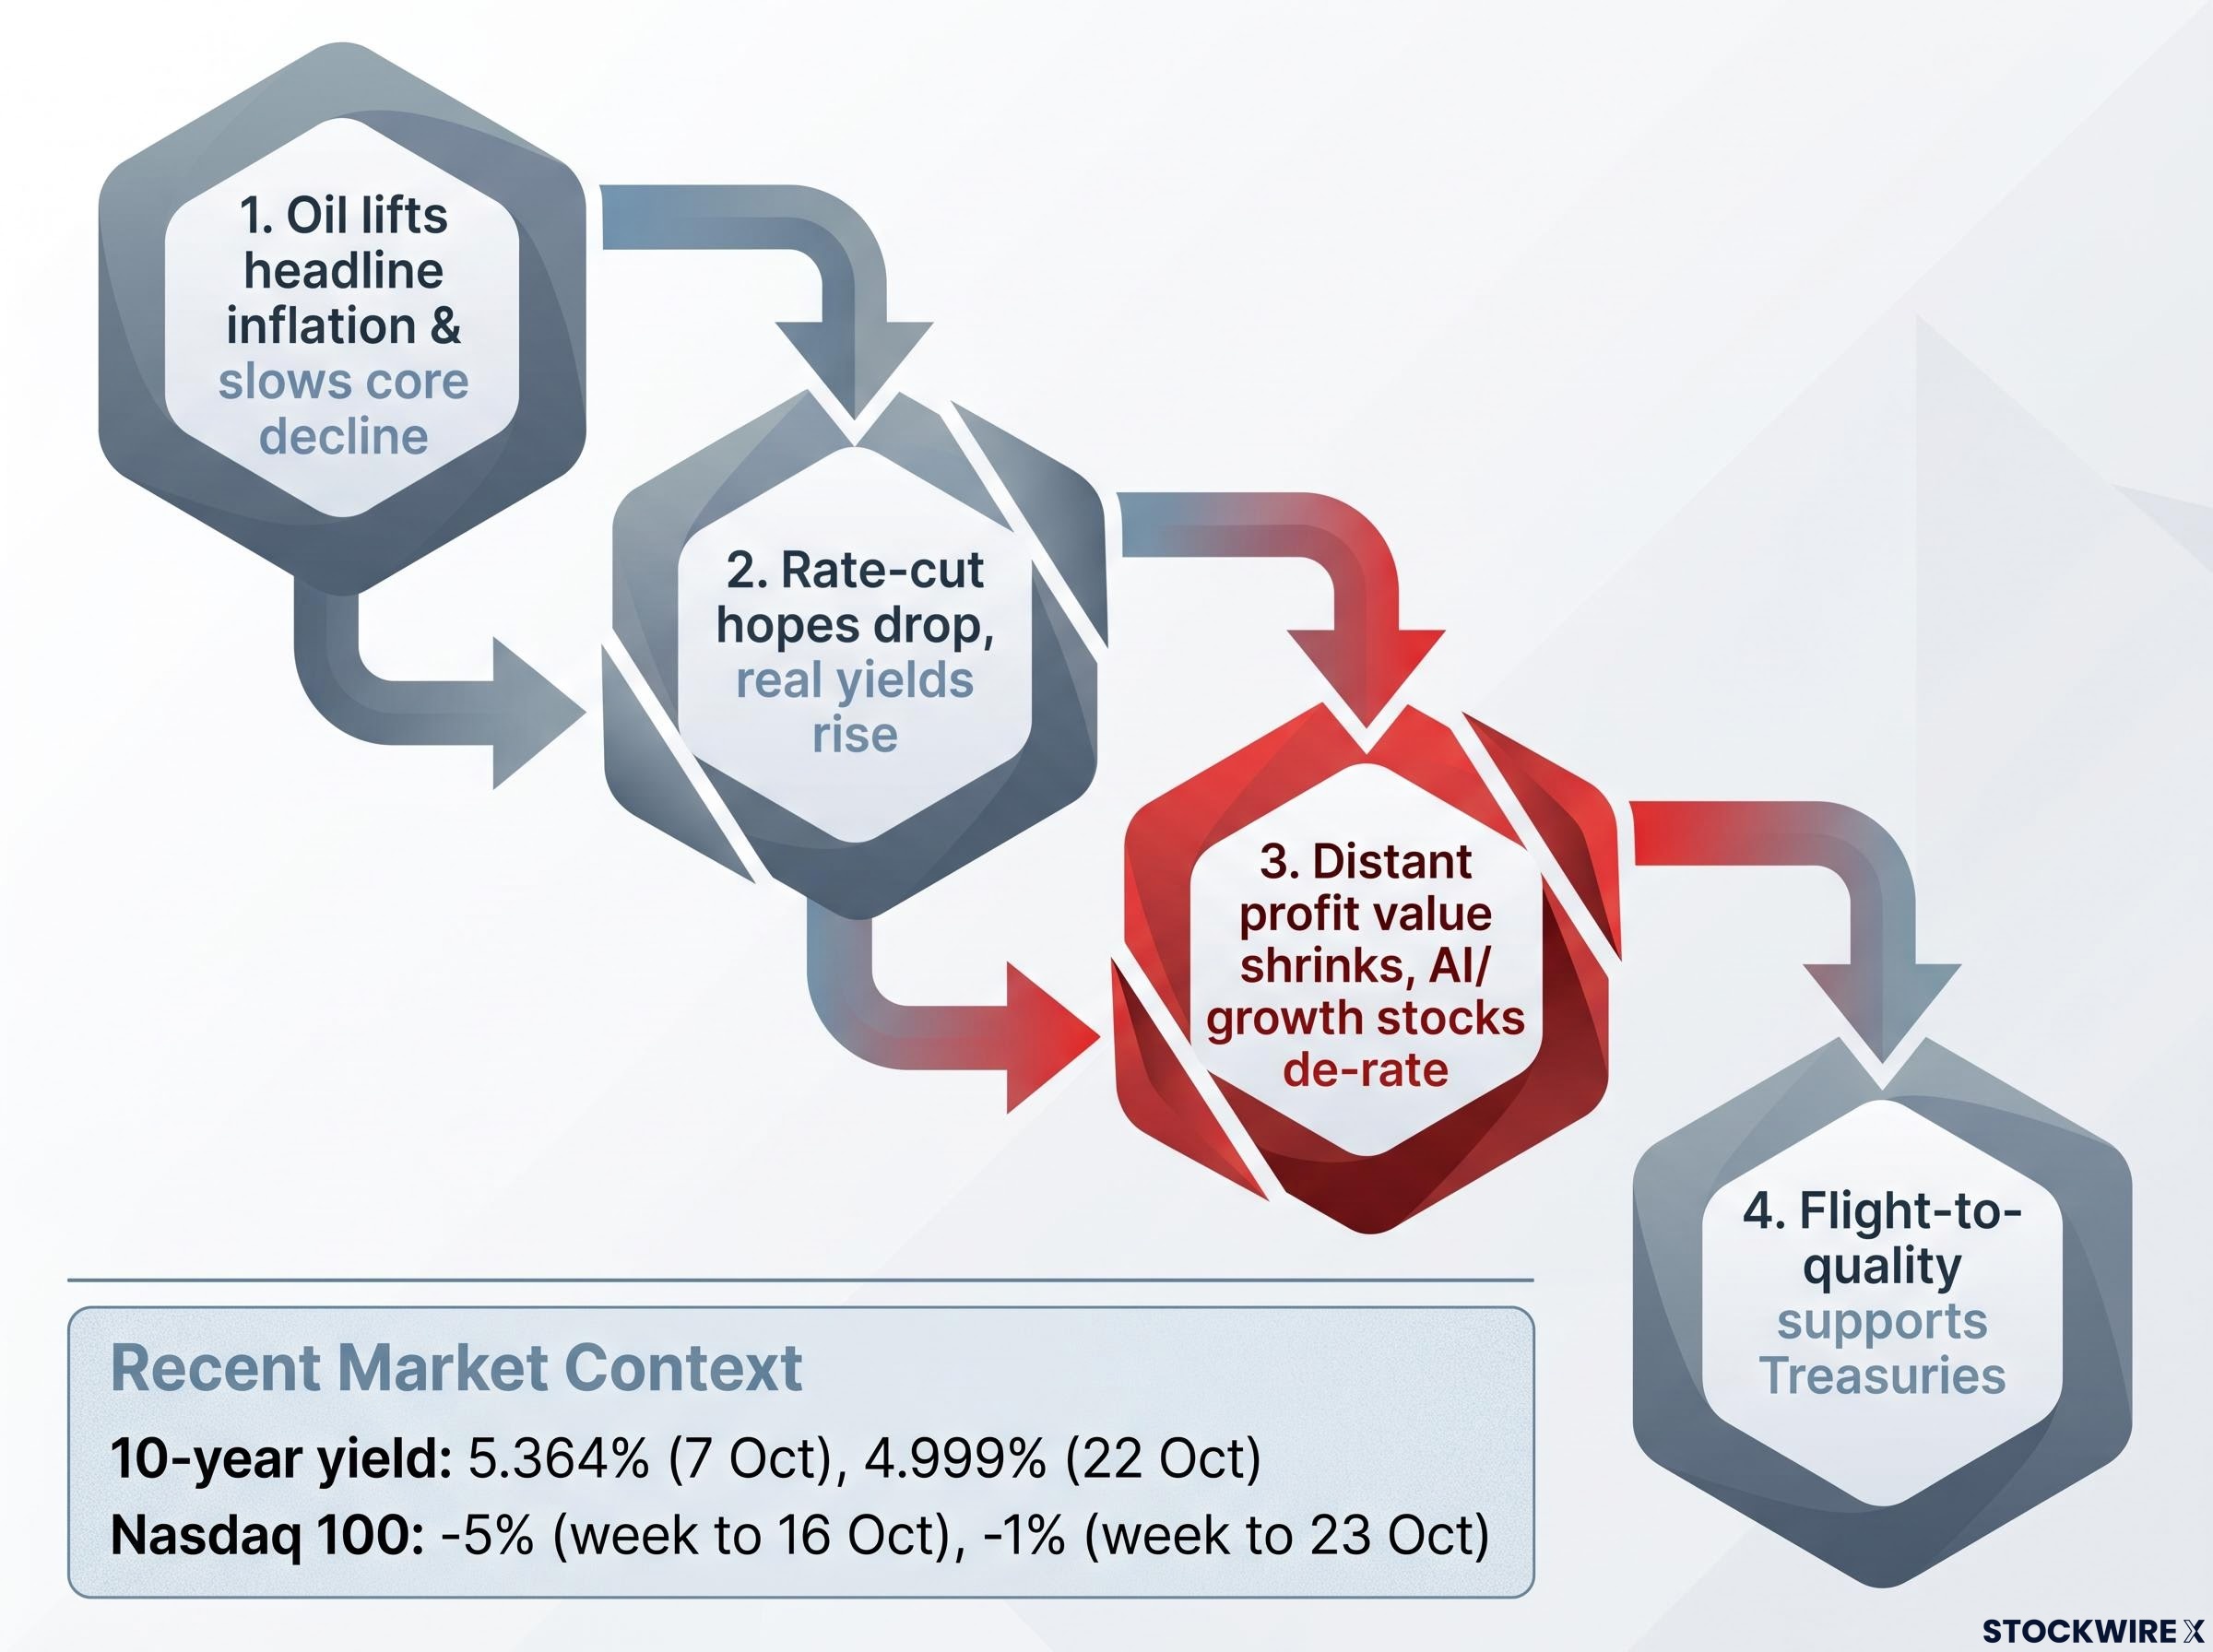
Duration matters beyond the oil market, because persistence is what carries a shock into your other holdings. The chain runs in four links:
- Oil lifts headline inflation and slows the decline in core inflation through transport, chemicals and food.
- Markets scale back rate-cut hopes, pushing real yields (bond yields after subtracting expected inflation) higher.
- Higher real yields shrink the present value of distant profits, so AI and growth stocks de-rate.
- Flight-to-quality buying supports Treasuries, partly offsetting the yield rise.
Oil hurts AI stocks mainly through that rates channel and a higher risk premium, not through their operating costs. The original source claims real yields have had about an 80% correlation with the Nasdaq 100, though that figure was not independently verified.
The 2022 Russia-Ukraine shock moved in phases: an inflation shock, then tightening repricing, then demand destruction.
| Scenario (illustrative, not a forecast) | Oil | Real yields | Growth equities | Treasuries |
|---|---|---|---|---|
| Contained flare-up | Spike then retrace | Brief rise | Short dip | Safe-haven bid |
| Prolonged impairment | Stays elevated | Rise further | Sustained pressure | Mixed |
| De-escalation | Falls | Ease | Relief | Yields may drift |
Why Treasuries can rise and fall at once
October showed both forces. The 10-year yield briefly hit 5.364% on 7 October and sat near 4.999% on 22 October. The Nasdaq 100 fell about 5% in the week to 16 October and about 1% in the week to 23 October, with commentary citing safe-haven demand alongside AI selling.
Woo argues AI weakness could rally 10-year Treasuries by about 20 basis points. The latest 10-year real yield and any quantified oil-to-AI estimate were not found, so treat precise links with caution.
The practical point for you: an oil shock can hit your shares and bonds through the same channel, so assess energy and macro exposure together.
The oil-yield correlation has reached its strongest positive reading since 1989 according to Commerzbank, which is why an energy shock can pressure your bonds and your shares at once instead of offsetting.
Past performance does not guarantee future results. These scenarios are speculative and subject to change.
What to watch next as the election and strike risk resolve
Recovered flows were never the real test. The test is whether delivery stays costly, and whether any strike would impair Gulf supply for weeks rather than days.
Four variables will tell you which way that is breaking:
- The Israeli election result and how quickly a coalition forms
- Any US presidential order, or 3 November passing without one
- Freight rates and war-risk insurance premiums
- Real yields and inflation expectations
If freight eases and the midterms pass quietly, the sceptics gain ground. If an order lands and transits fall again, Woo’s underpricing case strengthens.
Even a quiet midterm week may not clear the slate, since the risk premium built into crude, freight and insurance has tended to decompress slowly, and the IEA has pointed to a recovery measured in years rather than weeks.
This article is for informational purposes only and should not be considered financial advice. Investors should conduct their own research and consult with financial professionals before making investment decisions.