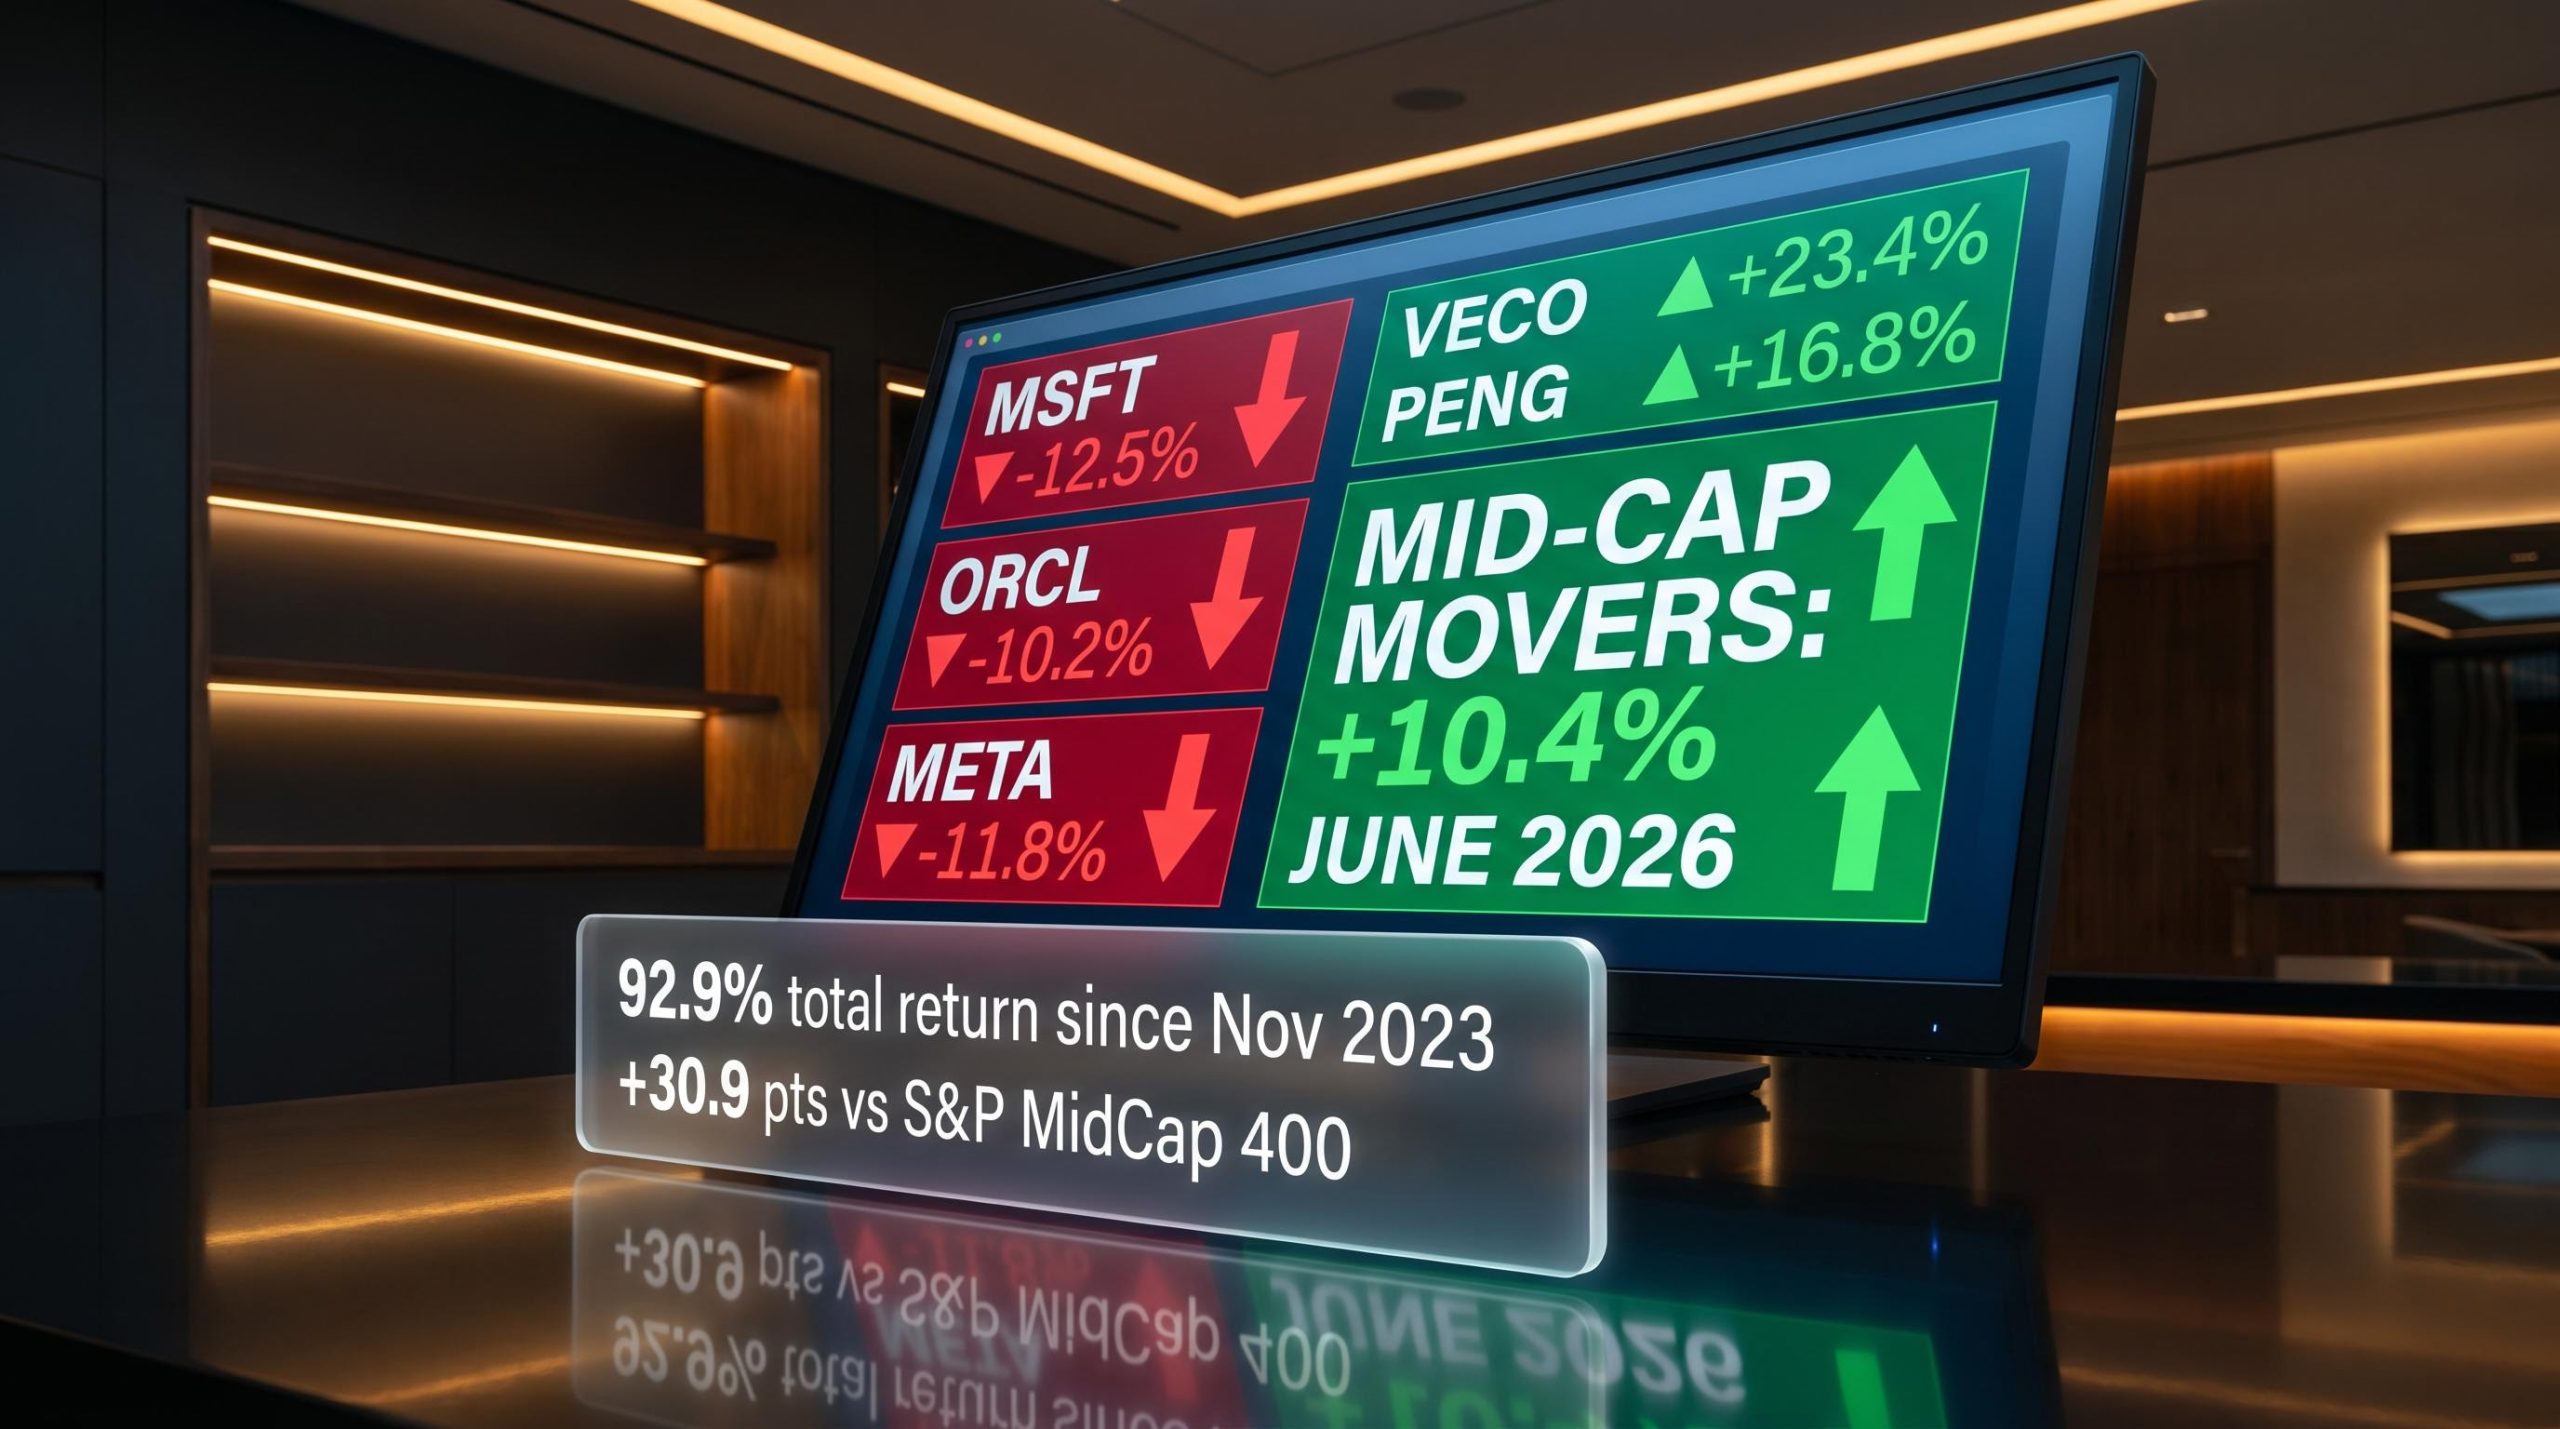
Why the Mid-Cap Rotation Beat Mega-Cap Tech in June 2026
13 mins ago
HSBC Global Investment Research has assessed close to 2,000 business categories across global equity markets and concluded that Austria faces a projected 30% revenue loss below baseline if AI disruption broadens, making it the hardest-hit market in Europe under the bank’s severe scenario. Published on 10 May 2026, the cross-market study arrives as investor rotation away from AI-disrupted sectors is already underway, with approximately $45 billion in institutional outflows from media and healthcare IT ETFs year-to-date. The report gives that rotation a geographic and sectoral map, scoring each equity market’s net exposure to AI-driven revenue disruption under two distinct scenarios. What follows is an explanation of which markets bear the greatest downside risk, why sector composition drives the divergence between countries, and where investors are looking for low-exposure hedges as uncertainty around the AI market impact persists.
India is not the country most investors expect to find at the top of an AI disruption risk table. The country’s equity market has been a growth story for a decade, built on exactly the sectors now most exposed.
Under HSBC’s moderate disruption scenario, India carries a 7% net AI-disrupted revenue share, the highest single-country figure in that tier. The driver is concentration. India’s benchmark indices are heavily weighted toward software-as-a-service, business process outsourcing, and consultancy categories, the first wave of automation targets identified in HSBC’s scoring model.
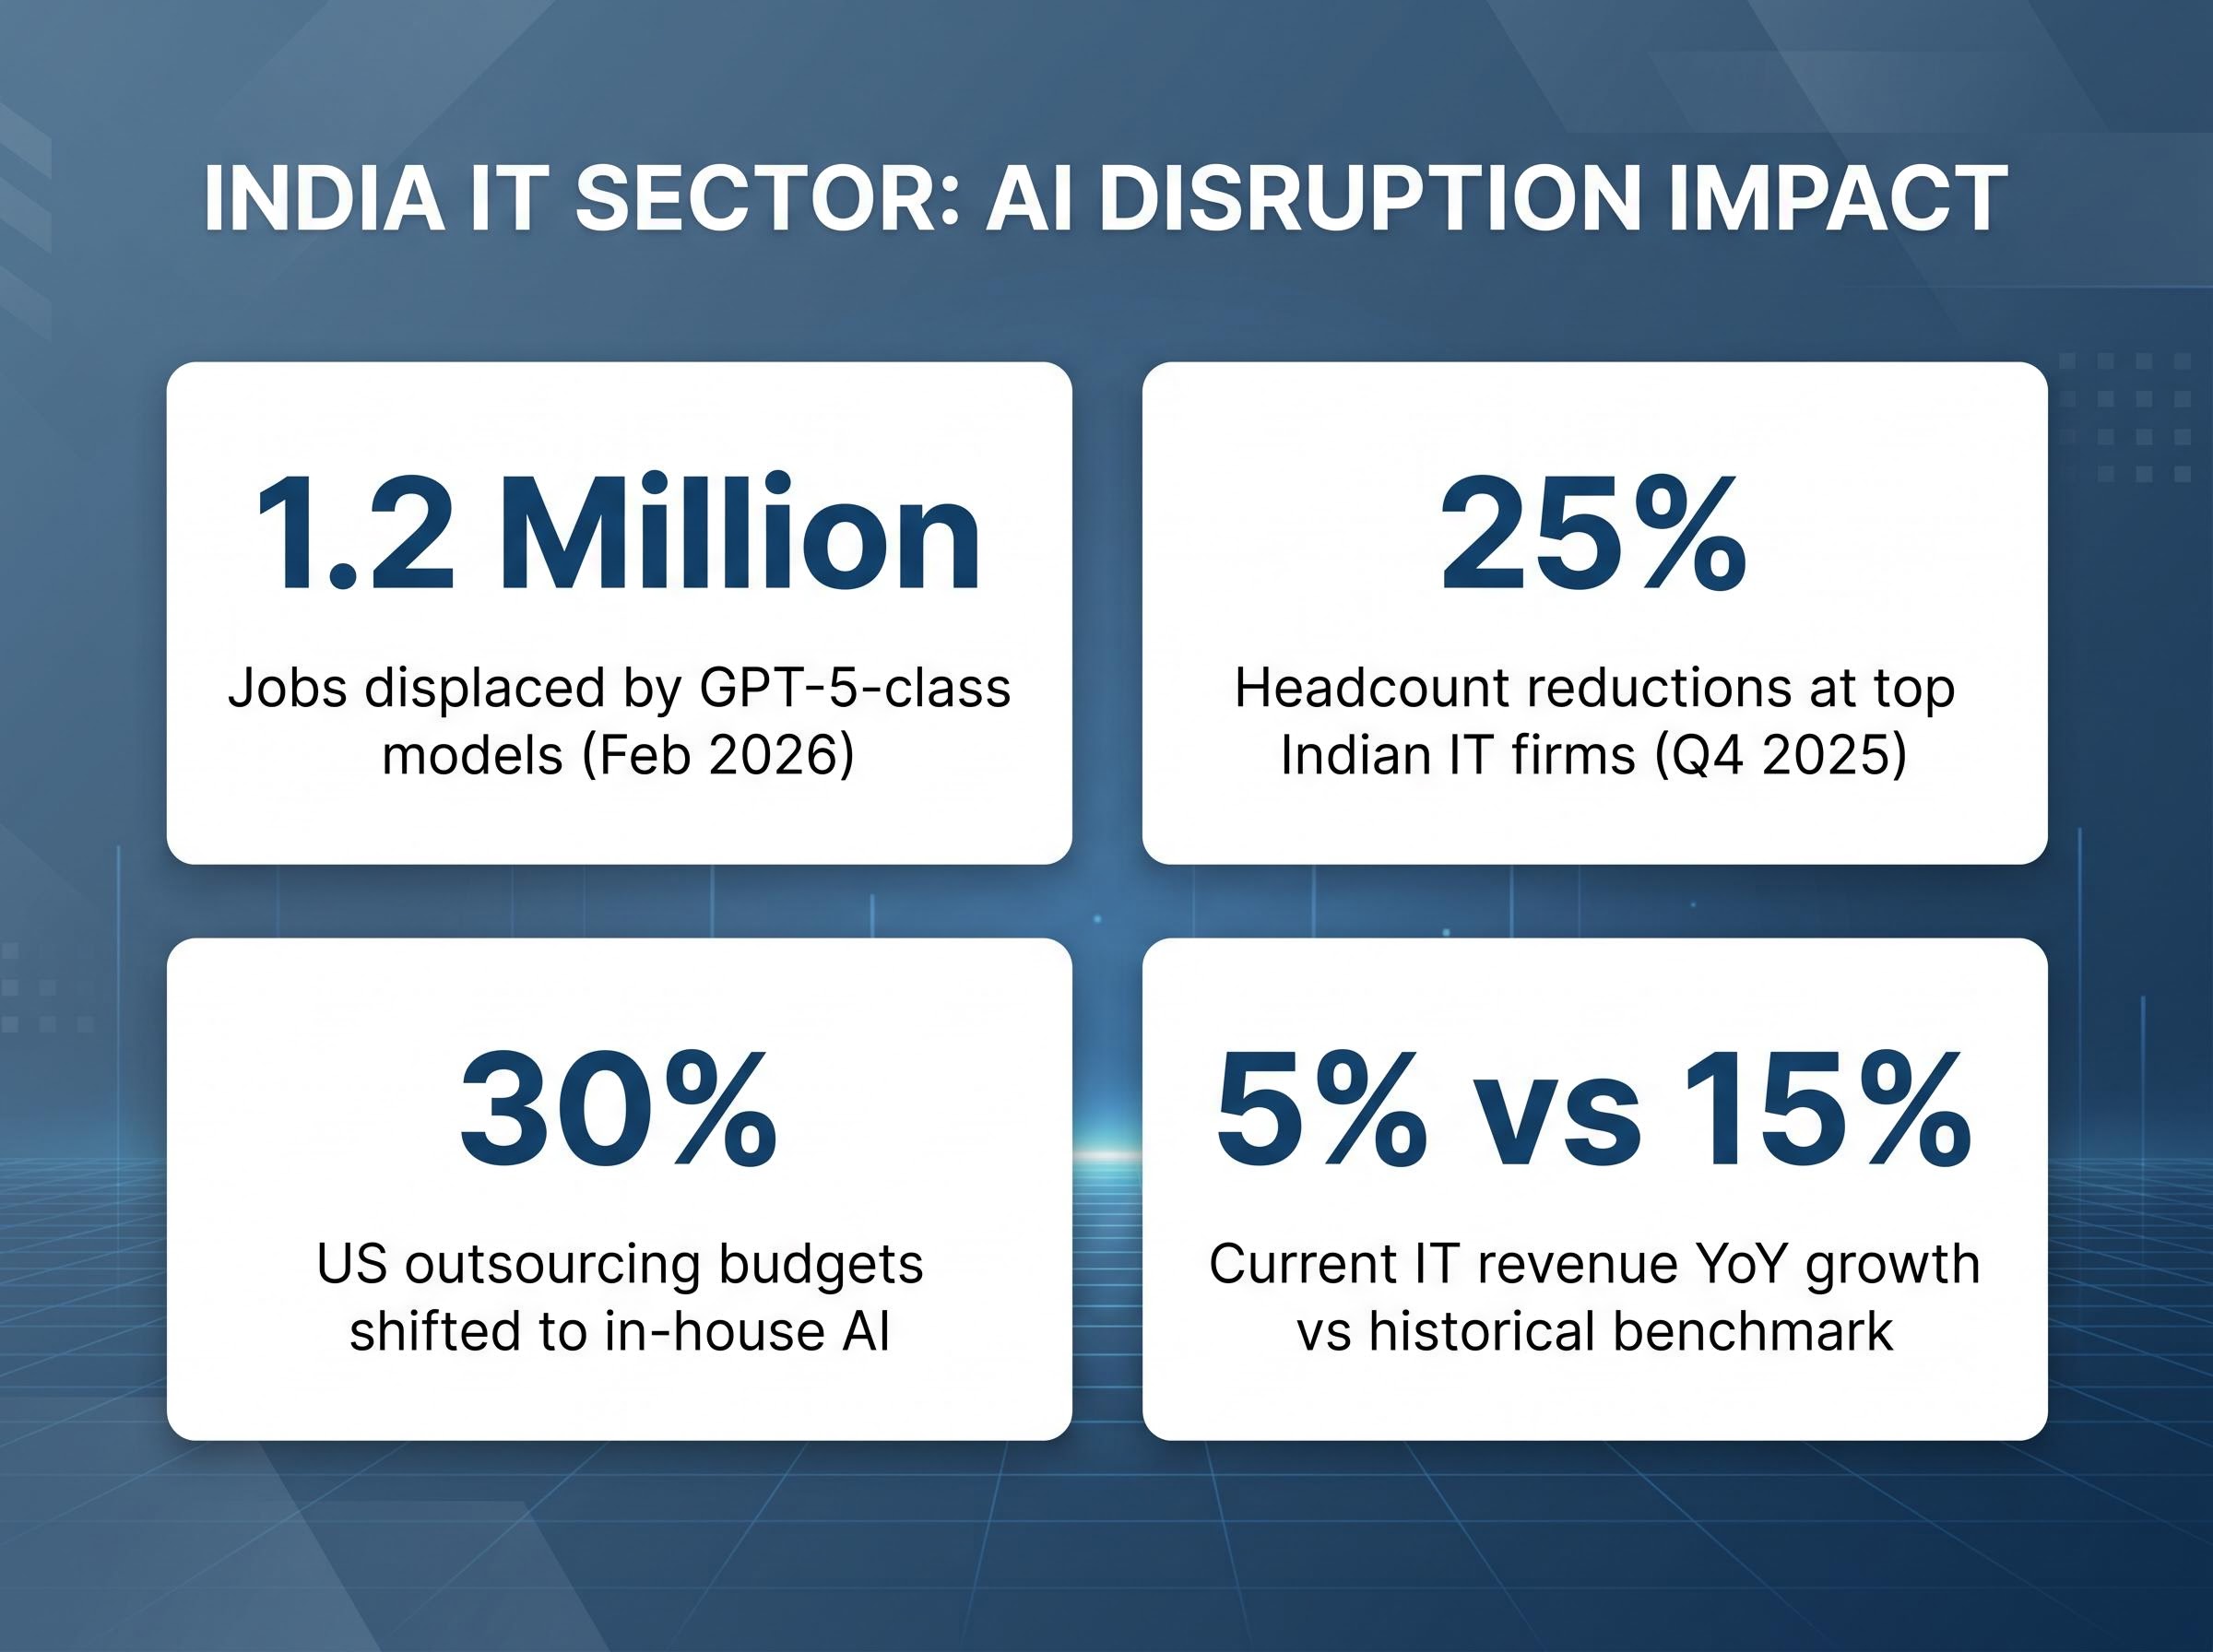
The SaaS disruption mechanics driving India’s exposure are the same force that erased over $1 trillion in US enterprise software market capitalisation in February 2026, as autonomous AI agents replaced the human-driven workflows that per-seat licensing models were built around.
Industry data confirms the pressure is not theoretical. Nasscom figures show approximately 25% headcount reductions at top Indian IT firms in Q4 2025, with US clients shifting roughly 30% of outsourcing budgets to in-house AI solutions. An estimated 1.2 million jobs have been displaced by GPT-5-class models, according to Nasscom and WSJ reporting from February 2026. IT sector revenue growth has flattened to approximately 5% year-over-year, against a historical benchmark of approximately 15%.
Infosys CEO Salil Parekh publicly characterised the challenge as an “existential pivot,” citing AI wrappers commoditising previously differentiated services (Reuters, May 2026).
TCS has launched an “AI-First” upskilling initiative targeting 100,000 employees. Wipro has acquired US-based AI startups for approximately $2 billion. The Indian government’s IndiaAI Mission has allocated ₹100 billion for sovereign AI compute infrastructure.
The scale of these responses is notable. Whether they are sufficient is another question. The WSJ characterised the measures as reactive given a concurrent 12% spike in youth unemployment, and that tension remains unresolved.
Under the moderate scenario, European equity markets emerge largely unscathed. The categories targeted, SaaS, consultancy, BPO, and media, do not dominate European index composition the way they dominate India’s.
The severe scenario changes the picture entirely. HSBC’s large disruption model extends the scope to financial services, advisory, brokerage, insurance, and healthcare software. European equity markets carry disproportionately heavy financial services and insurance index weights relative to Asian and US peers. That structural overweight is the mechanism that flips the sign.
European equity downgrades are arriving from multiple directions simultaneously: while HSBC’s large scenario flags financial services concentration as the AI-driven mechanism, BCA Research cut EU equities to underweight on 1 May 2026 citing a separate transmission channel through energy cost inflation and consumer purchasing power erosion, compressing the monetary policy flexibility available to European central banks.
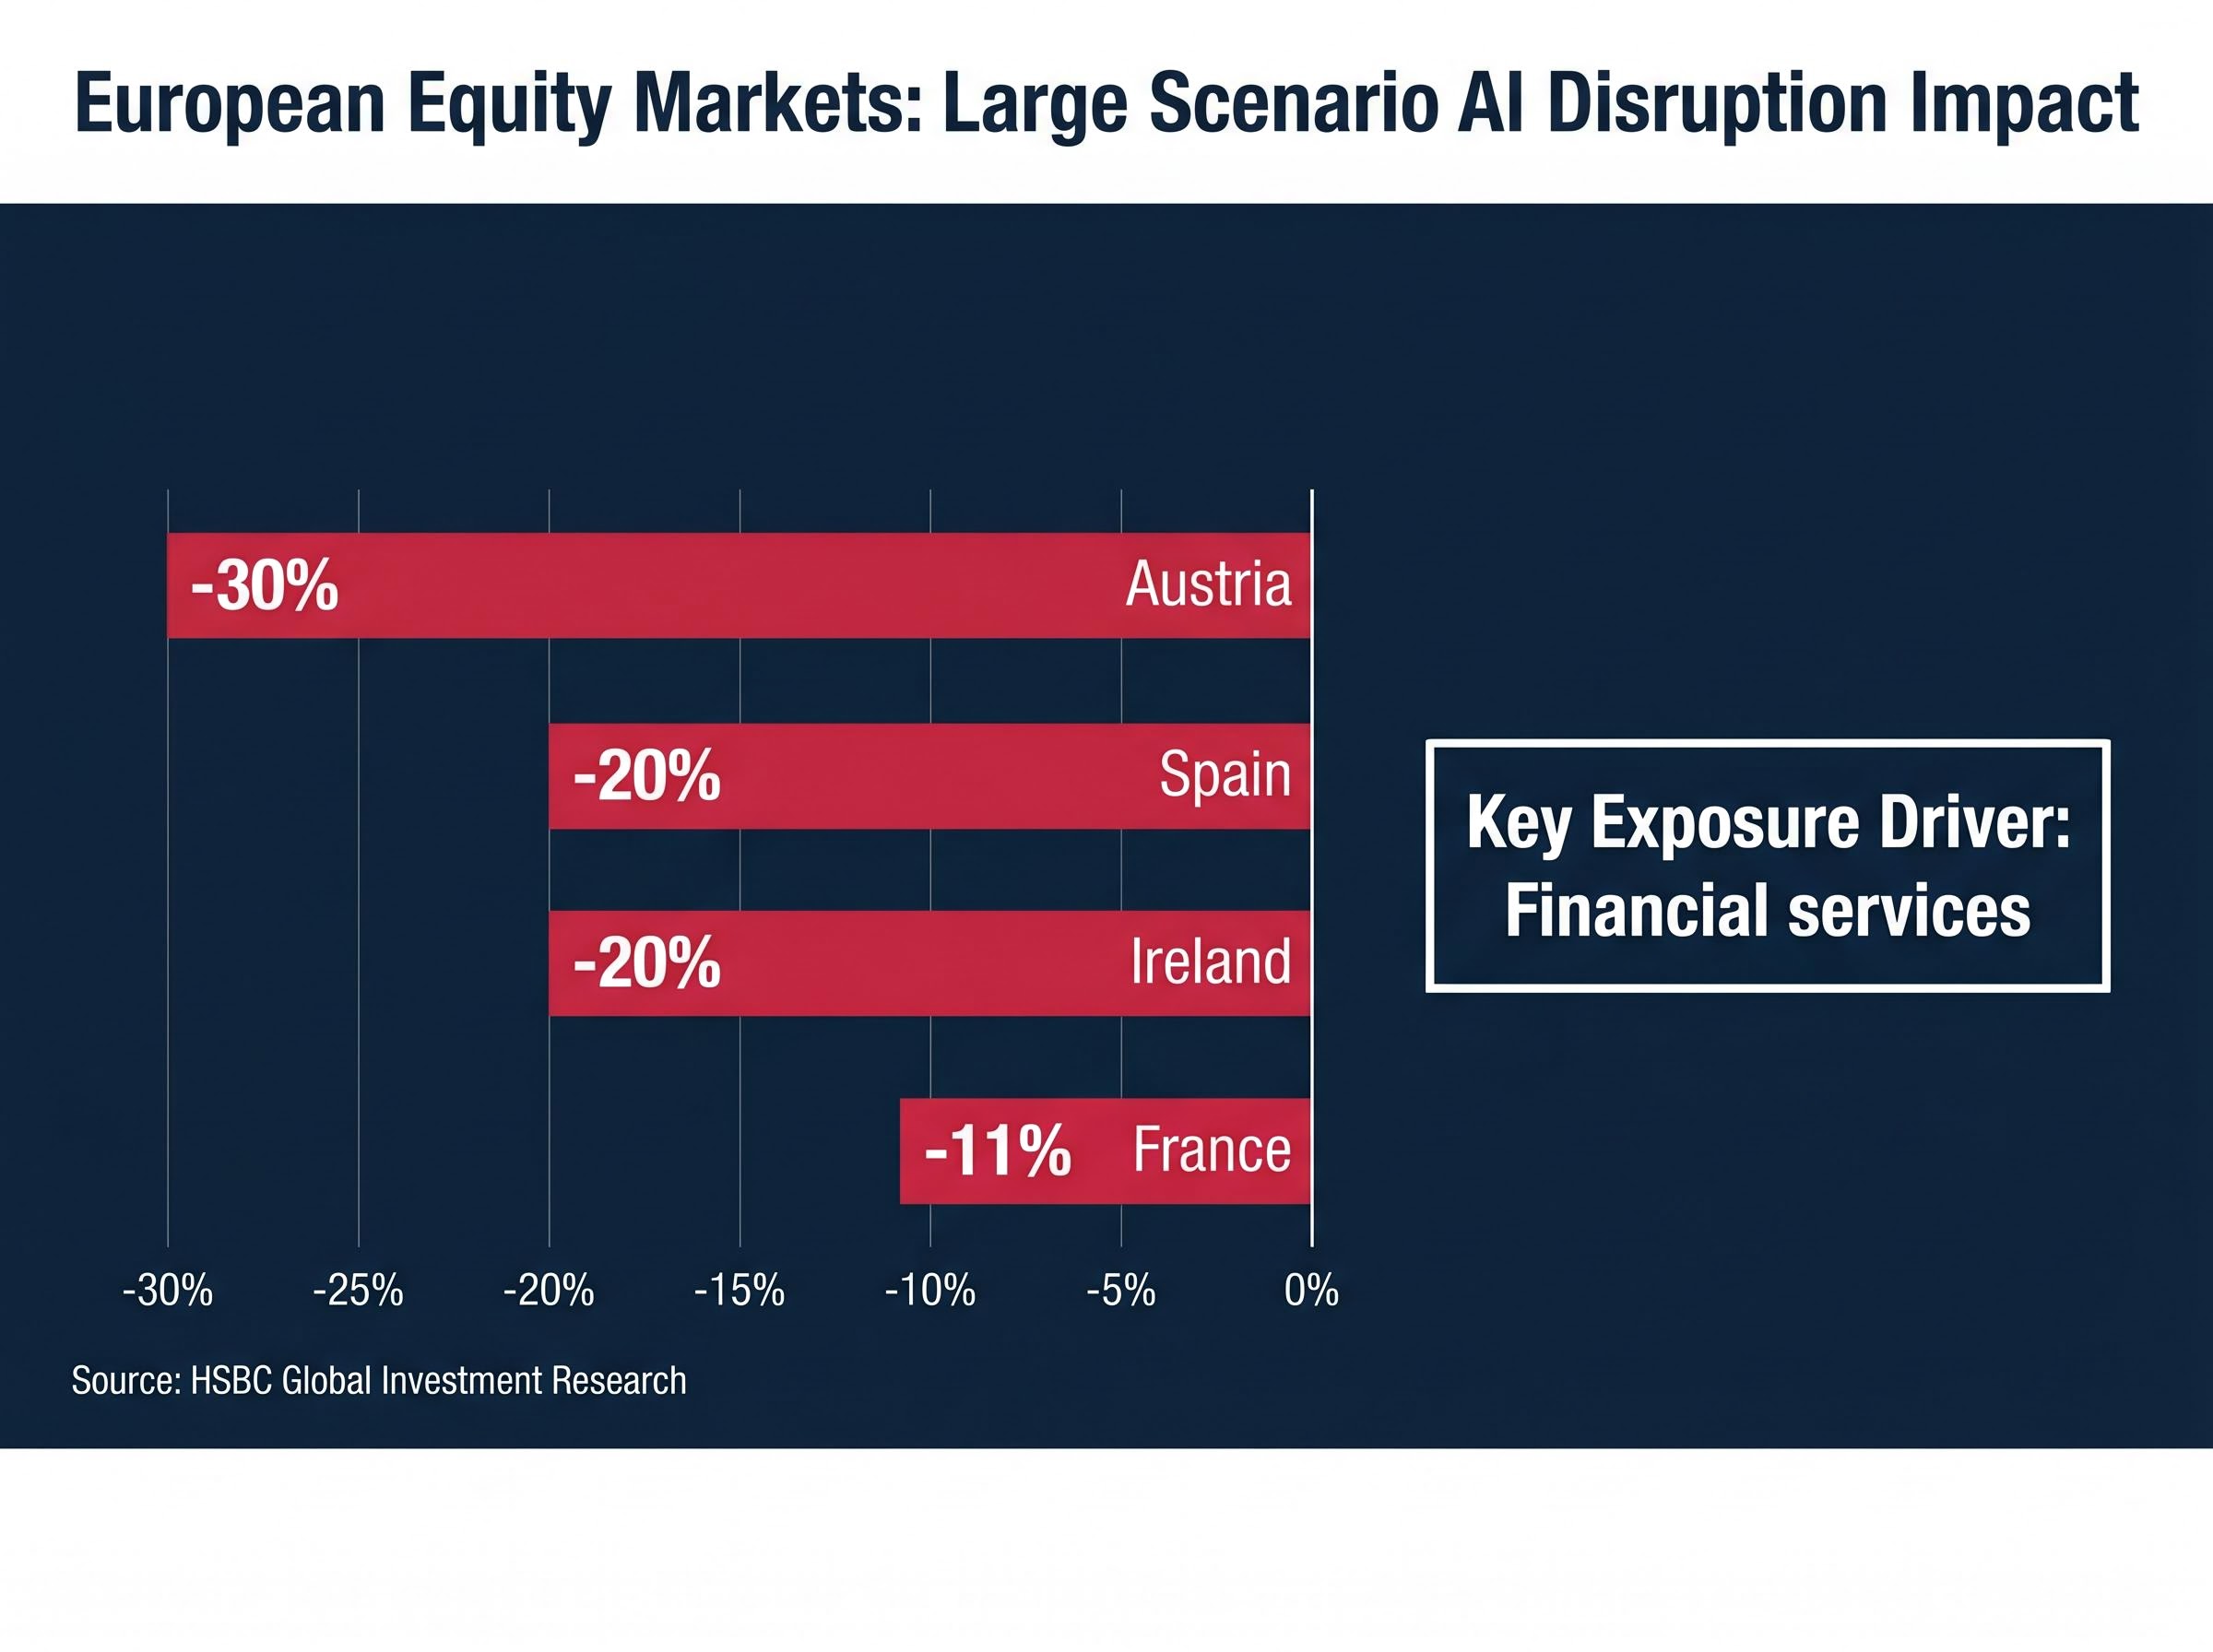
| Country | Moderate Scenario Impact | Large Scenario Impact | Key Exposure Driver |
|---|---|---|---|
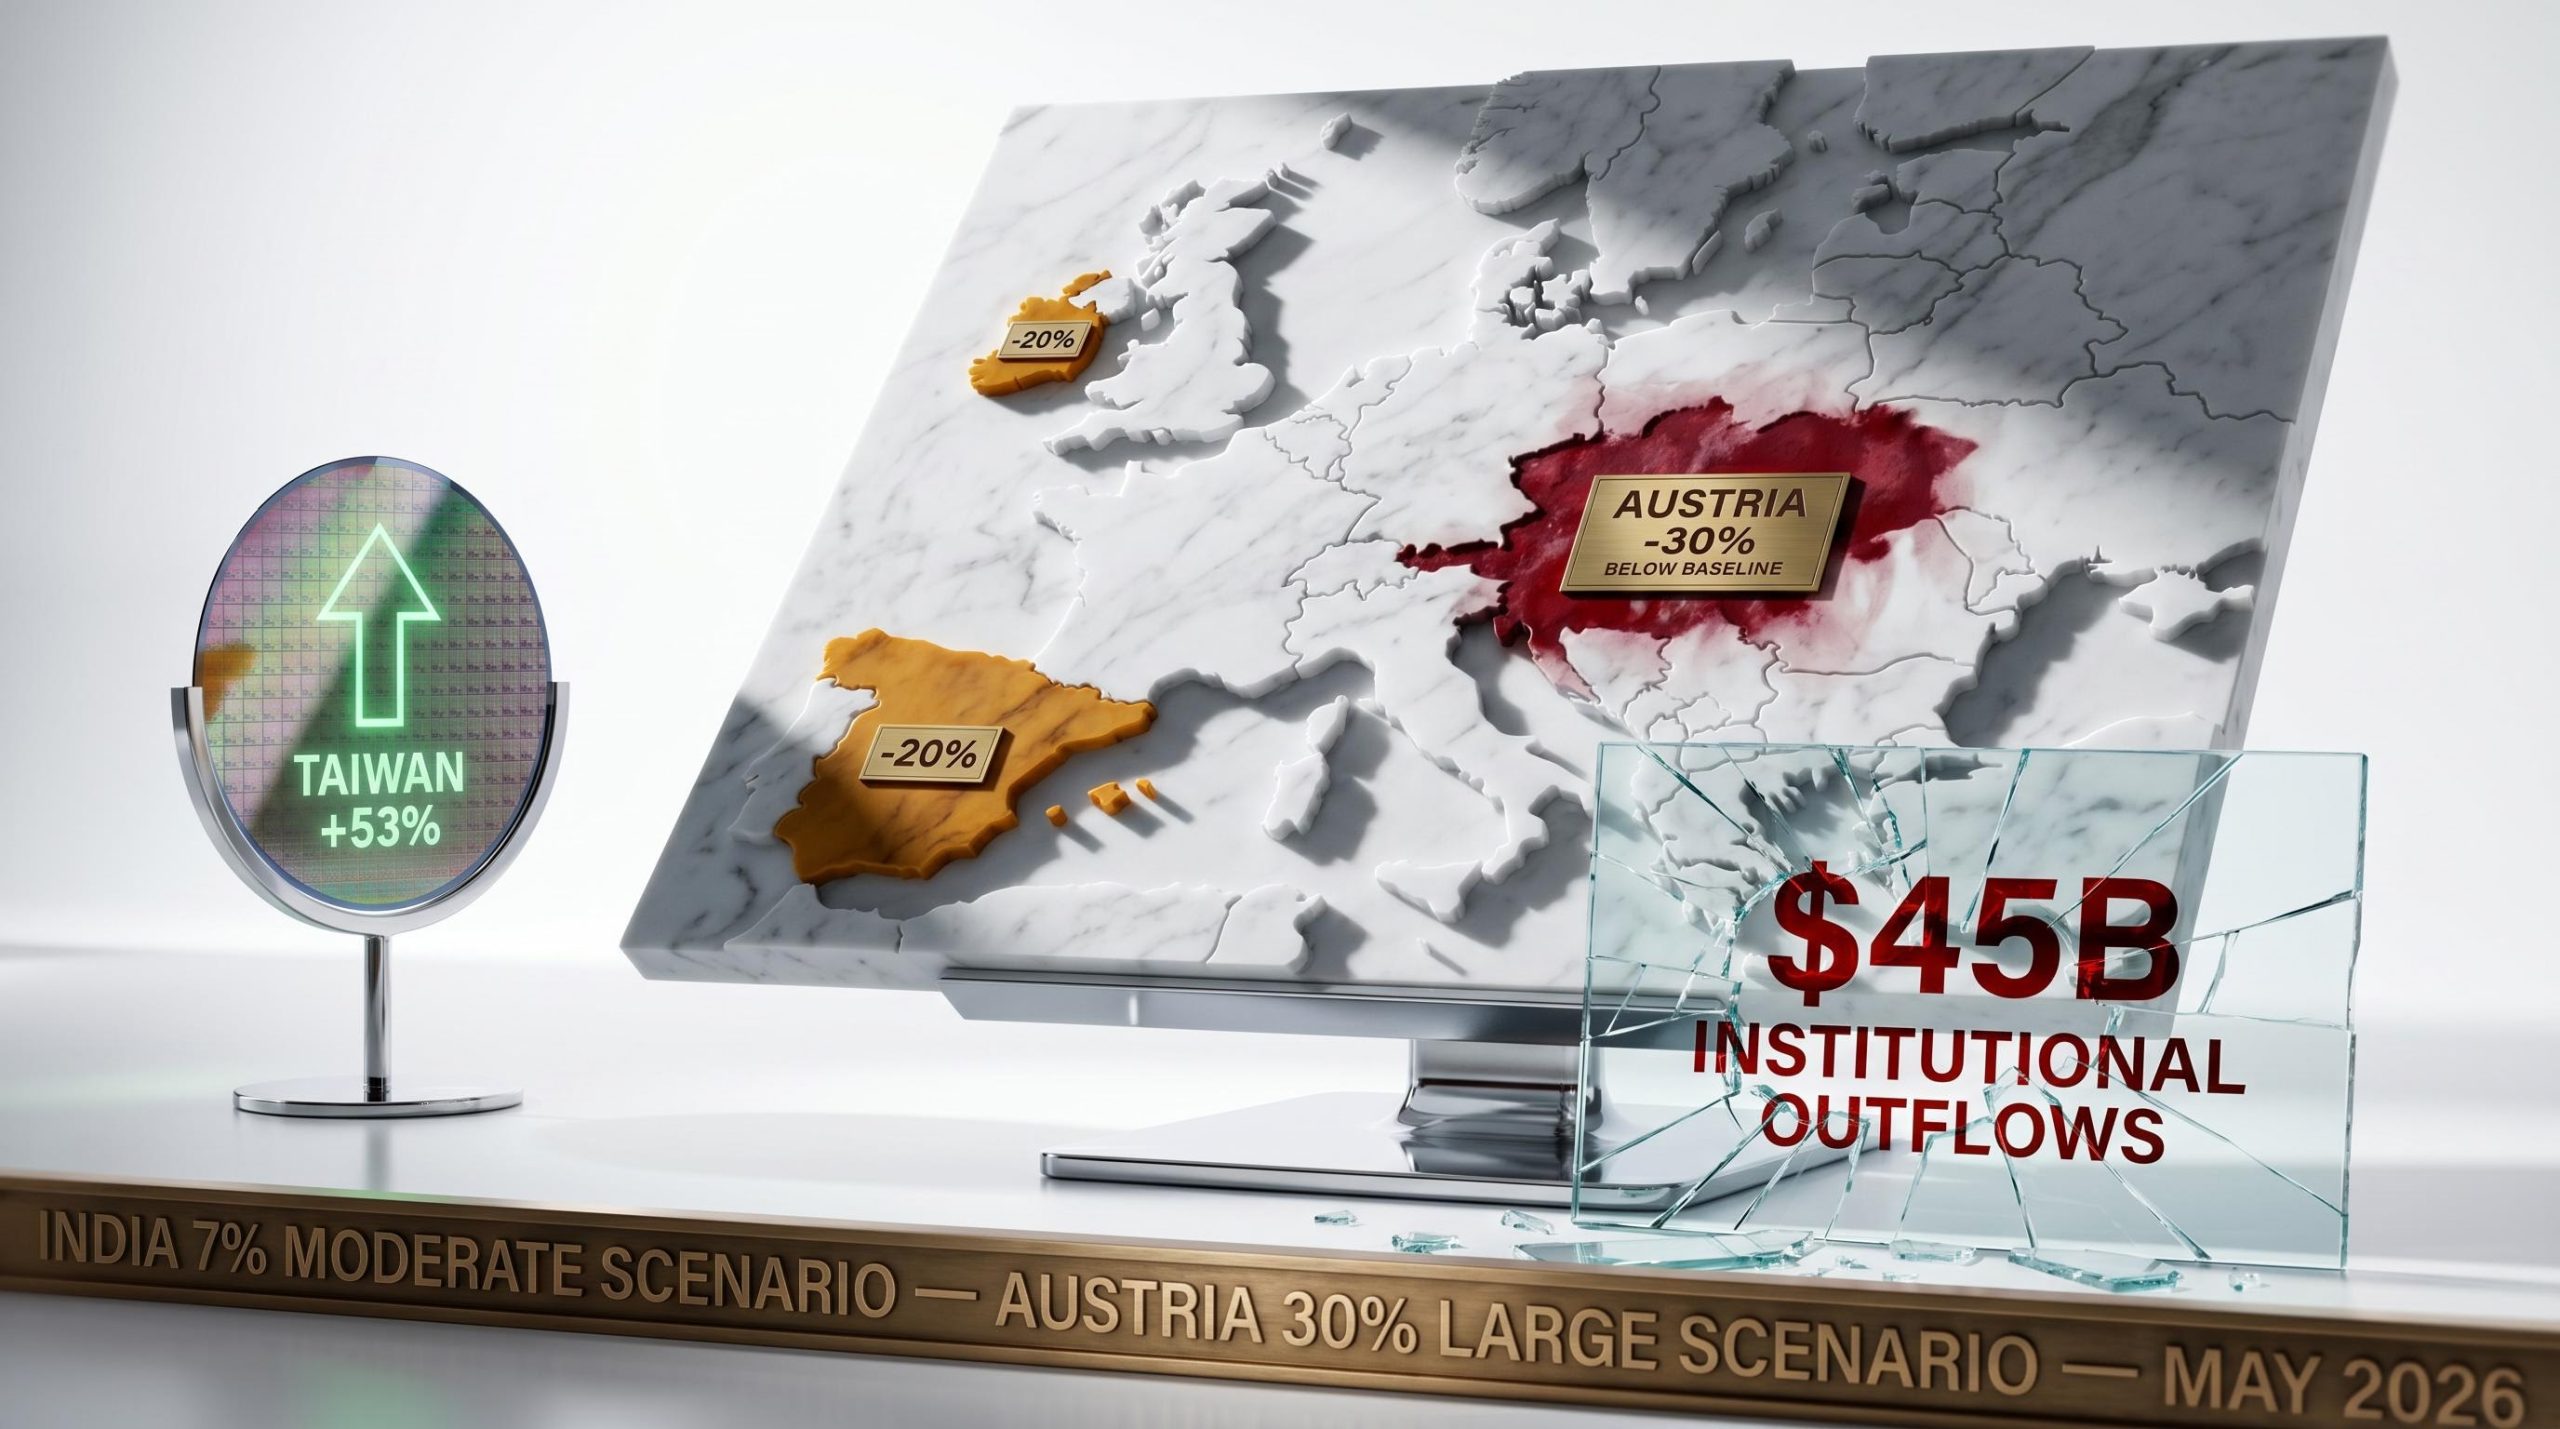
| Austria | Minimal | 30% below baseline | Financial services |
| Spain | Minimal | 20% below baseline | Financial services |
| Ireland | Minimal | 20% below baseline | Financial services |
| France | Minimal | 11% below baseline | Financial services |
The three sector categories added in the large scenario are the specific mechanism:
HSBC’s analysis, published 10 May 2026, used FactSet’s RBICS framework to score close to 2,000 business lines, of which 300 were classified as AI-related. The findings were attributed directly to HSBC Global Investment Research.
The numbers cited throughout this analysis are products of a specific framework. Understanding that framework is necessary to interpret the scores rather than simply accept them.
HSBC used FactSet’s Revere Business Industry Classification System (RBICS), a taxonomy that breaks public companies into close to 2,000 distinct business lines. Each line was scored for AI exposure using HSBC’s proprietary GPT-5-class model, producing a “net AI-enabled revenue share” for each equity market. That net figure represents the balance between revenues lifted by AI adoption and revenues lost to AI substitution.
The two scenarios differ in scope, not in methodology:
Country-level scores are a function of index composition, not country-specific policy. A market dominated by semiconductor firms scores positively; one dominated by insurers scores negatively under the large scenario.
Taiwan at 53% net positive and South Korea at 33% net positive under the moderate scenario illustrate the semiconductor-driven upside, providing a direct contrast to the European figures above.
Semiconductor concentration risk is the structural mirror image of the disruption problem: the same index-composition logic that makes Austria and India vulnerable on the downside makes Taiwan and South Korea positively exposed, with semiconductor companies now representing 13% of US equity market capitalisation and raising parallel questions about concentration-driven fragility at the beneficiary end of the AI trade.
The same force hitting Austria’s equity market is hitting healthcare IT funds and commercial services stocks globally. Geography is a lens; sector is the mechanism.
Commercial and professional services and media and entertainment register the deepest losses across both disruption scenarios. Banking and healthcare equipment shift sharply negative only under the large scenario. On the other side of the ledger, semiconductors and technology hardware are top-tier beneficiaries in both scenarios. Nvidia’s approximately 45% year-to-date gain illustrates the bifurcation in concrete market terms.
Institutional capital is already responding. Bloomberg reported approximately $45 billion in institutional outflows from media and healthcare IT ETFs as of May 2026. The iShares Healthcare Providers ETF is down approximately 12% year-to-date. Goldman Sachs data shows 60% of hedge funds trimming commercial services exposure, with ManpowerGroup down approximately 15% on AI-driven hiring automation concerns. A State Street survey found 55% of global allocators rotating toward AI beneficiaries such as semiconductors.
| Sector | Disruption Exposure (Moderate / Large) | Direction |
|---|---|---|
| Semiconductors and tech hardware | Beneficiary in both scenarios | Beneficiary |
| Commercial and professional services | Disrupted in both scenarios | Disrupted |
| Media and entertainment | Disrupted in both scenarios | Disrupted |
| Banking | Neutral (moderate) / Disrupted (large) | Conditional |
| Healthcare equipment | Neutral (moderate) / Disrupted (large) | Conditional |
The rotation data confirms that HSBC’s disruption scores are already influencing institutional positioning, giving individual investors a directional read on where professional capital is moving.
Everything in the preceding sections points to a single practical question: where can investors reduce net AI disruption exposure without exiting equities entirely?
HSBC’s report explicitly identifies three categories with minimal net AI exposure in either the beneficiary or disruption dimension:
The hedge thesis carries its own risks. WSJ (May 2026) flagged meaningful geopolitical risks in the LatAm region, particularly spillover effects from Venezuela, as a qualifier on any positioning built around Latin American energy exposure.
Country-level AI risk is primarily a function of index sector composition, not domestic AI policy. Investors managing geographic diversification need to audit their sector exposures at the same time.
That is the core analytical insight from HSBC’s framework. A portfolio with heavy European international equity allocation is not at risk because of European AI policy; it is at risk if financial services and insurance dominate its European holdings and the large disruption scenario materialises.
The gap between the two scenarios is wide enough to matter for timing. India is already in disruption territory at the moderate level. European financials do not enter negative territory until the large scenario arrives. JPMorgan’s estimate of a 1-2% GDP boost from AI productivity gains (Bloomberg, April 2026) offers context for why the moderate scenario retains institutional credibility, while Calpers has been cited (Reuters, February 2026) as rotating away from healthcare IT on 25% disruption scores.
The IMF forecasts on AI-driven GDP growth project a lift of up to 0.3 percentage points in 2026 alone, with medium-term gains of 0.1 to 0.8 percentage points annually depending on adoption speed, a range that helps explain why institutional investors are treating the moderate disruption scenario as the base case rather than an outlier.
Institutional positioning suggests the market is pricing a moderate scenario with tail risk rather than a large-scenario base case. Nvidia’s gains and sectoral outflows coexist in orderly fashion.
Investors wanting to stress-test whether Nvidia’s 45% year-to-date gain and the institutional rotation data are consistent with a sustainable re-rating or a speculative overshoot will find our dedicated guide to AI valuation frameworks covers the Shiller CAPE at 40-41, Minsky financing stage analysis, and dot-com era comparisons with granular data on current index concentration and earnings growth.
HSBC’s analysis provides a structured framework for differentiating AI winners from losers at the market level, not just the company level. That distinction is a meaningful advance over earlier commentary focused on individual stocks or sectors in isolation.
The practical implication is direct: review international equity holdings for financial services and healthcare software weight in European allocations, BPO and IT services weight in emerging-market allocations, and the balance between semiconductor-heavy and financial-services-heavy positions globally. Whether AI capability expansion moves toward the large scenario or plateaus near the moderate scenario is the single most important variable for the markets identified in this report.
This article is for informational purposes only and should not be considered financial advice. Investors should conduct their own research and consult with financial professionals before making investment decisions. Financial projections referenced are subject to market conditions and various risk factors.
HSBC used FactSet's Revere Business Industry Classification System (RBICS) to score nearly 2,000 business lines for AI exposure, producing a net AI-enabled revenue share figure for each equity market that balances revenues lifted by AI adoption against revenues lost to AI substitution.
Austria's equity market carries a disproportionately heavy weighting toward financial services and insurance, the sectors that become deeply disrupted under HSBC's large scenario, resulting in a projected 30% revenue loss below baseline, the worst figure in Europe.
Taiwan and South Korea score 53% and 33% net positive respectively under the moderate scenario, driven by their heavy semiconductor and technology hardware index weightings, which are top-tier beneficiaries in both disruption scenarios HSBC modelled.
HSBC identifies Latin American utilities, Central and Eastern European markets such as Poland and Hungary, and global energy, materials, and utilities sectors as having minimal net AI exposure in either scenario, offering structural diversification away from disrupted sectors.
Approximately $45 billion in institutional outflows from media and healthcare IT ETFs have been recorded year-to-date as of May 2026, with Goldman Sachs data showing 60% of hedge funds trimming commercial services exposure and 55% of global allocators rotating toward semiconductor-heavy positions.