SEC Moves to End Mandatory Quarterly Reporting After 50 Years
6 hrs ago

The indefinite ceasefire extension was supposed to signal de-escalation. Within hours, Iranian commandos were boarding cargo vessels in the Strait of Hormuz while President Trump ordered the U.S. Navy to fire on Iranian ships suspected of laying mines. The Strait remains the world’s most critical oil chokepoint, and the events of 23-24 April 2026 demonstrate how quickly diplomatic progress can unravel when strategic waterways are contested. Brent crude surging past $106 per barrel is the market’s real-time verdict on the situation.
This analysis examines how the Hormuz standoff is transmitting through global markets, why the oil price response may be the beginning rather than the peak, and what signals investors should monitor as central banks convene next week against a backdrop of supply disruption and demand destruction.
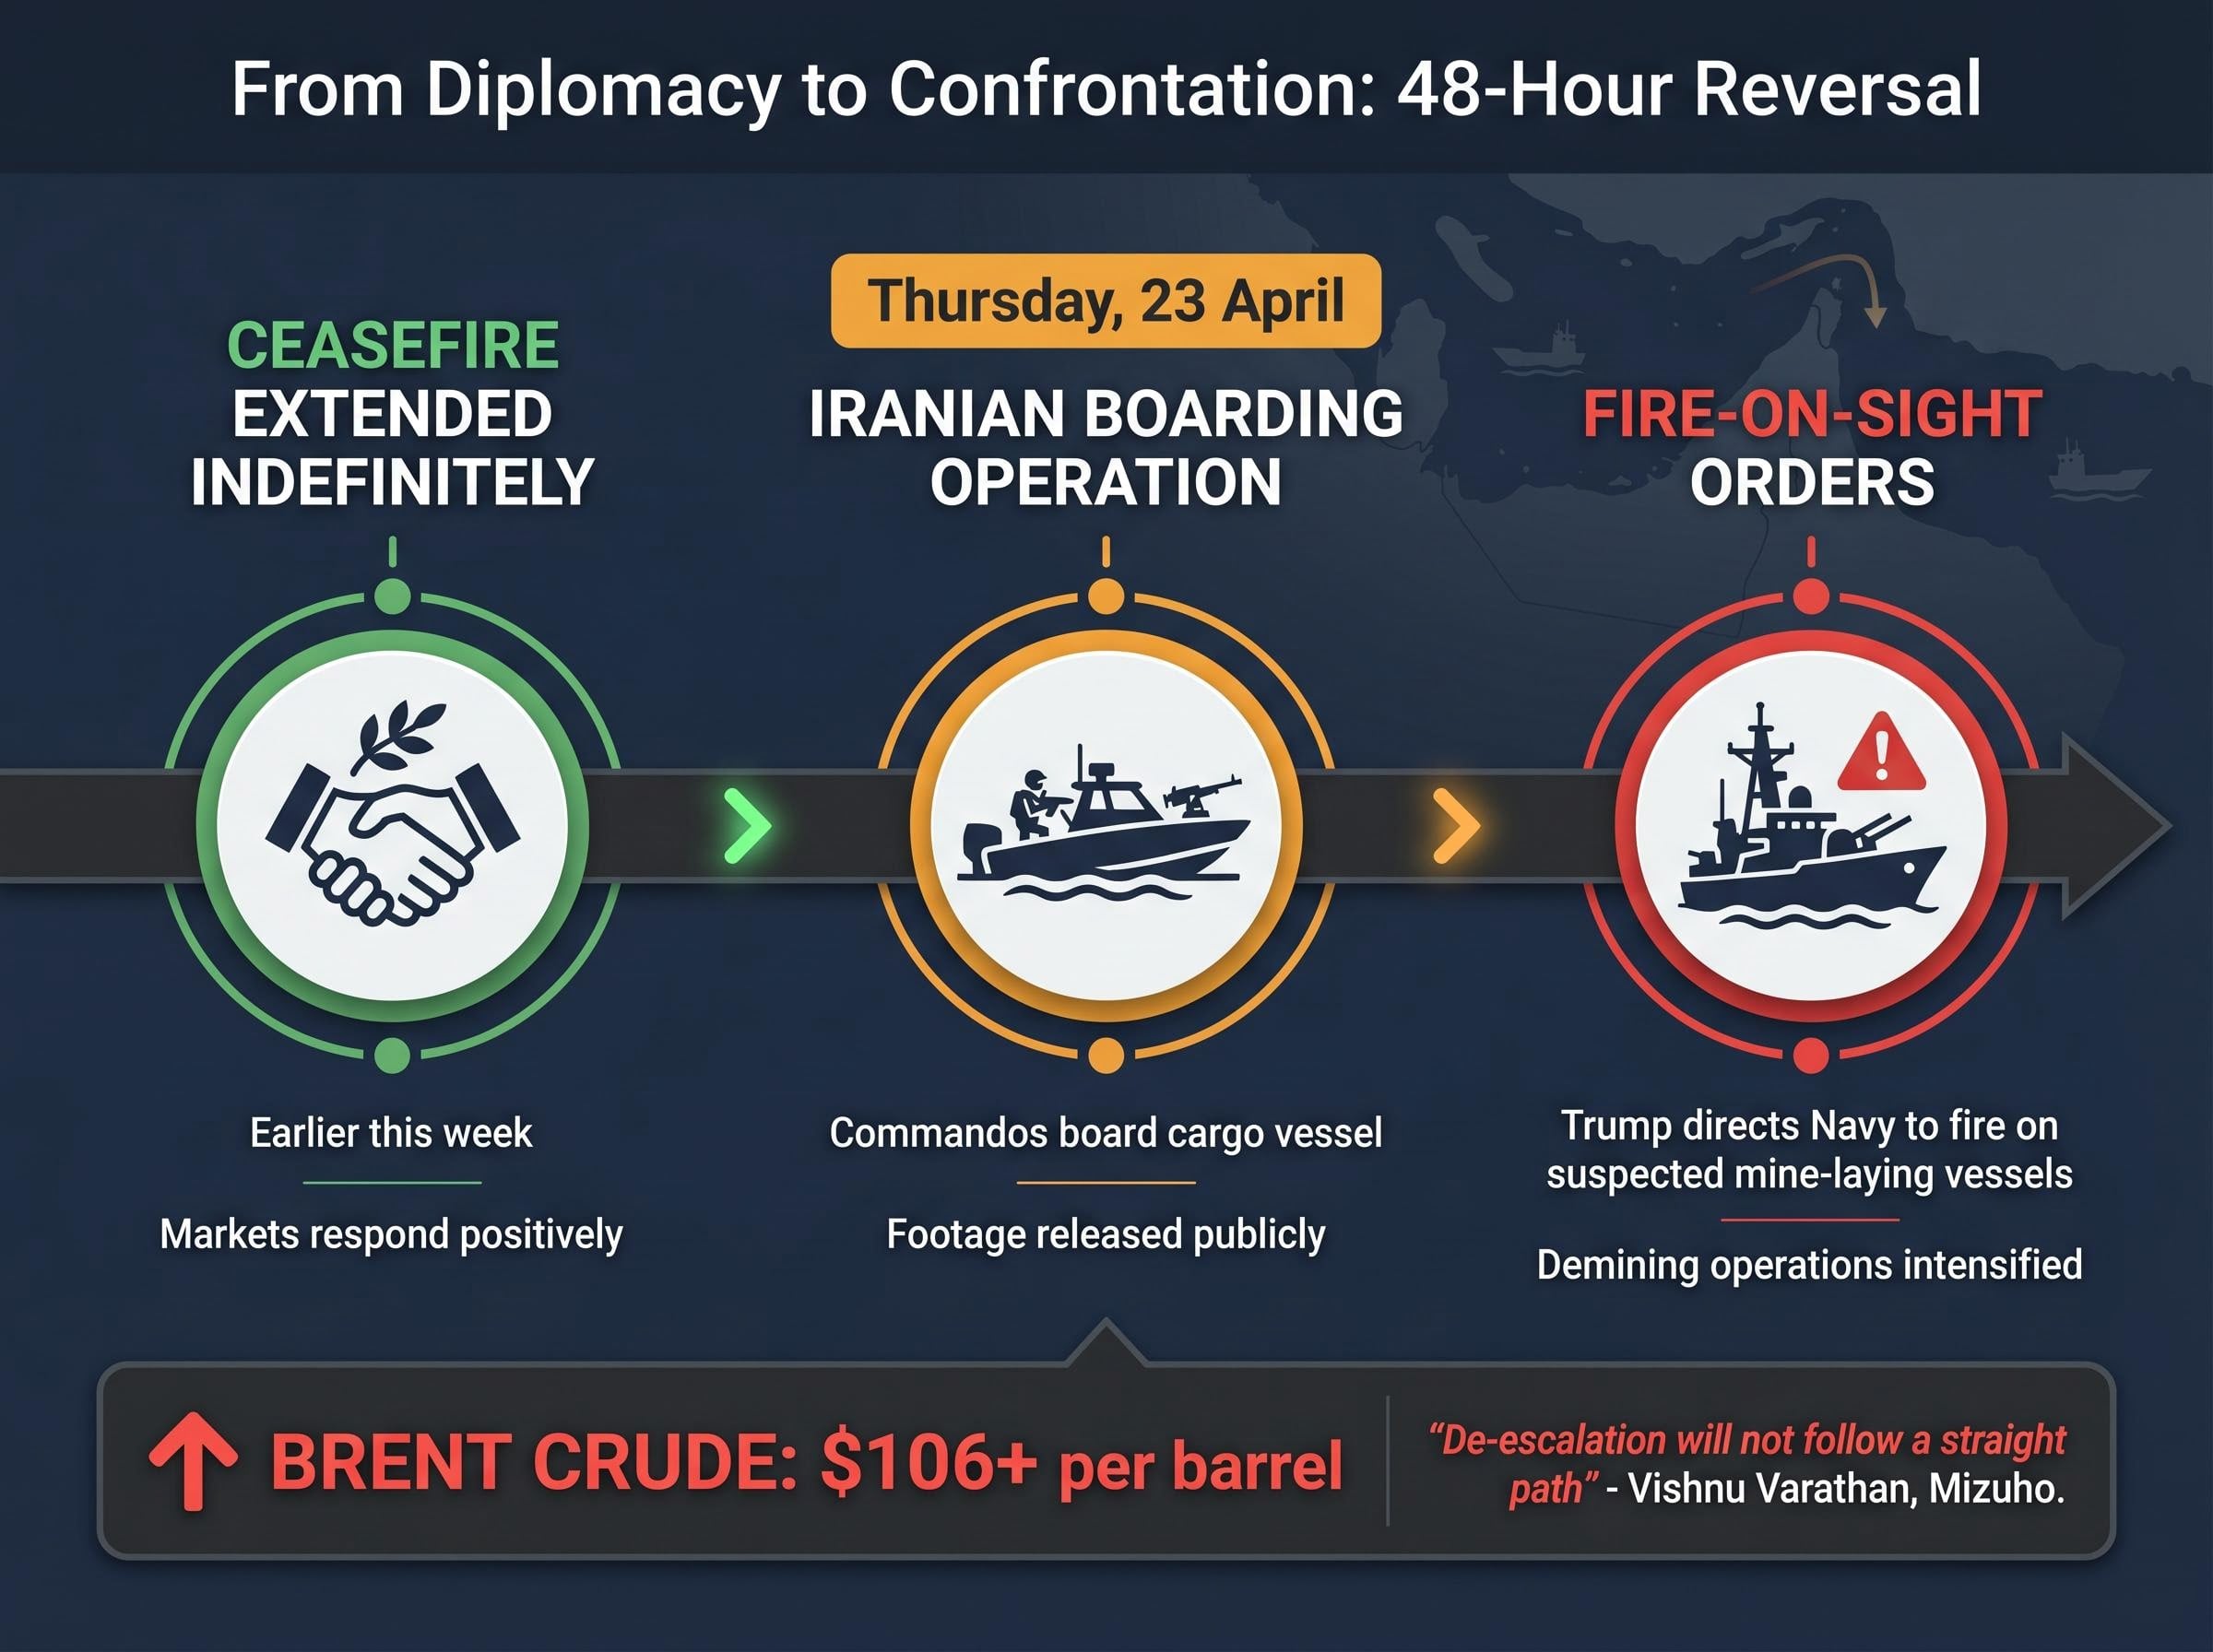
The sequence began with optimism. Trump extended the ceasefire indefinitely earlier in the week, a move initially read as progress toward a diplomatic resolution. Markets responded positively.
Then Iran released footage on Thursday, 23 April, showing commandos from a speedboat boarding a large cargo vessel. The video presented the operation as routine maritime security, but the optics contradicted the diplomatic framing.
Trump’s response came swiftly: direct the Navy to fire on Iranian vessels suspected of deploying mines and intensify demining operations throughout the waterway. The contradiction between the extended ceasefire and operational escalation was not lost on traders.
Mizuho’s Vishnu Varathan captured the tension in his assessment this week:
“De-escalation will not follow a straight path. Market participants are seeking bullish positioning opportunities rather than genuinely expecting swift resolution.”
The observation matters because markets initially responded to ceasefire headlines, then reversed as operational details emerged. Investors who read only the diplomatic signal missed the escalatory counter-signal. The Brent price movement from relief to premium within 48 hours reflects that shift.
The US-Iran tensions transmitting through oil, equities, and bonds have produced a pattern of five consecutive weekly S&P 500 declines totalling approximately 5%, a sequence seen only twice in fifteen years, with the mid-May negotiations involving China serving as the next critical catalyst.
Brent crude futures surged over 1% to $106.21 per barrel on 24 April. The number itself is significant, but the mechanics behind it reveal how markets price chokepoint risk.
The Strait of Hormuz carries roughly 20% of global oil supply daily. No alternative route exists for the majority of that volume. When mine-laying allegations surface alongside vessel boarding incidents, traders price not the current supply loss (which remains minimal) but the probability-weighted distribution of disruption scenarios.
The Strait of Hormuz closure driving U.S. inflation has halted roughly 20 million barrels per day of petroleum liquids, representing the largest oil supply disruption in modern history and pushing the Cleveland Fed inflation nowcast to 3.58% by mid-April.
The EIA data on world oil transit chokepoints shows that oil flows through the Strait averaged 20.9 million barrels per day in the first half of 2025, confirming the waterway’s position as the single most critical petroleum transit route globally.
The $9+ spread between Brent and WTI reflects this geographic risk concentration. U.S. West Texas Intermediate crude increased 1% to $96.77 per barrel on the same day Brent broke $106. The spread itself encodes where the risk sits: in the waterway connecting Middle Eastern production to global markets, not in North American supply.
| Benchmark | Price (24 April) | Daily Change | Context |
|---|---|---|---|
| Brent Crude | $106.21 | +1.0% | Hormuz disruption premium embedded |
| WTI Crude | $96.77 | +1.0% | North American supply insulated |
| Brent-WTI Spread | $9.44 | – | Geographic risk concentration signal |
The Brent price above $106 is not merely reflecting current conditions. It is pricing a distribution of possible disruption scenarios ranging from continued standoff without major supply loss to sustained closure of the waterway. Investors assessing whether current prices represent fair value or overshoot need to understand this mechanism: the premium reflects probability, not certainty.
The contagion path runs from oil to currencies to equities, with each asset class’s reaction building the picture of a market repricing geopolitical risk across the board.
Oil supply risk drives energy prices higher. Higher energy costs strengthen safe-haven flows to the dollar. A stronger dollar pressures risk assets and export-dependent currencies. The transmission is mechanical, but the speed and magnitude vary by regional exposure.
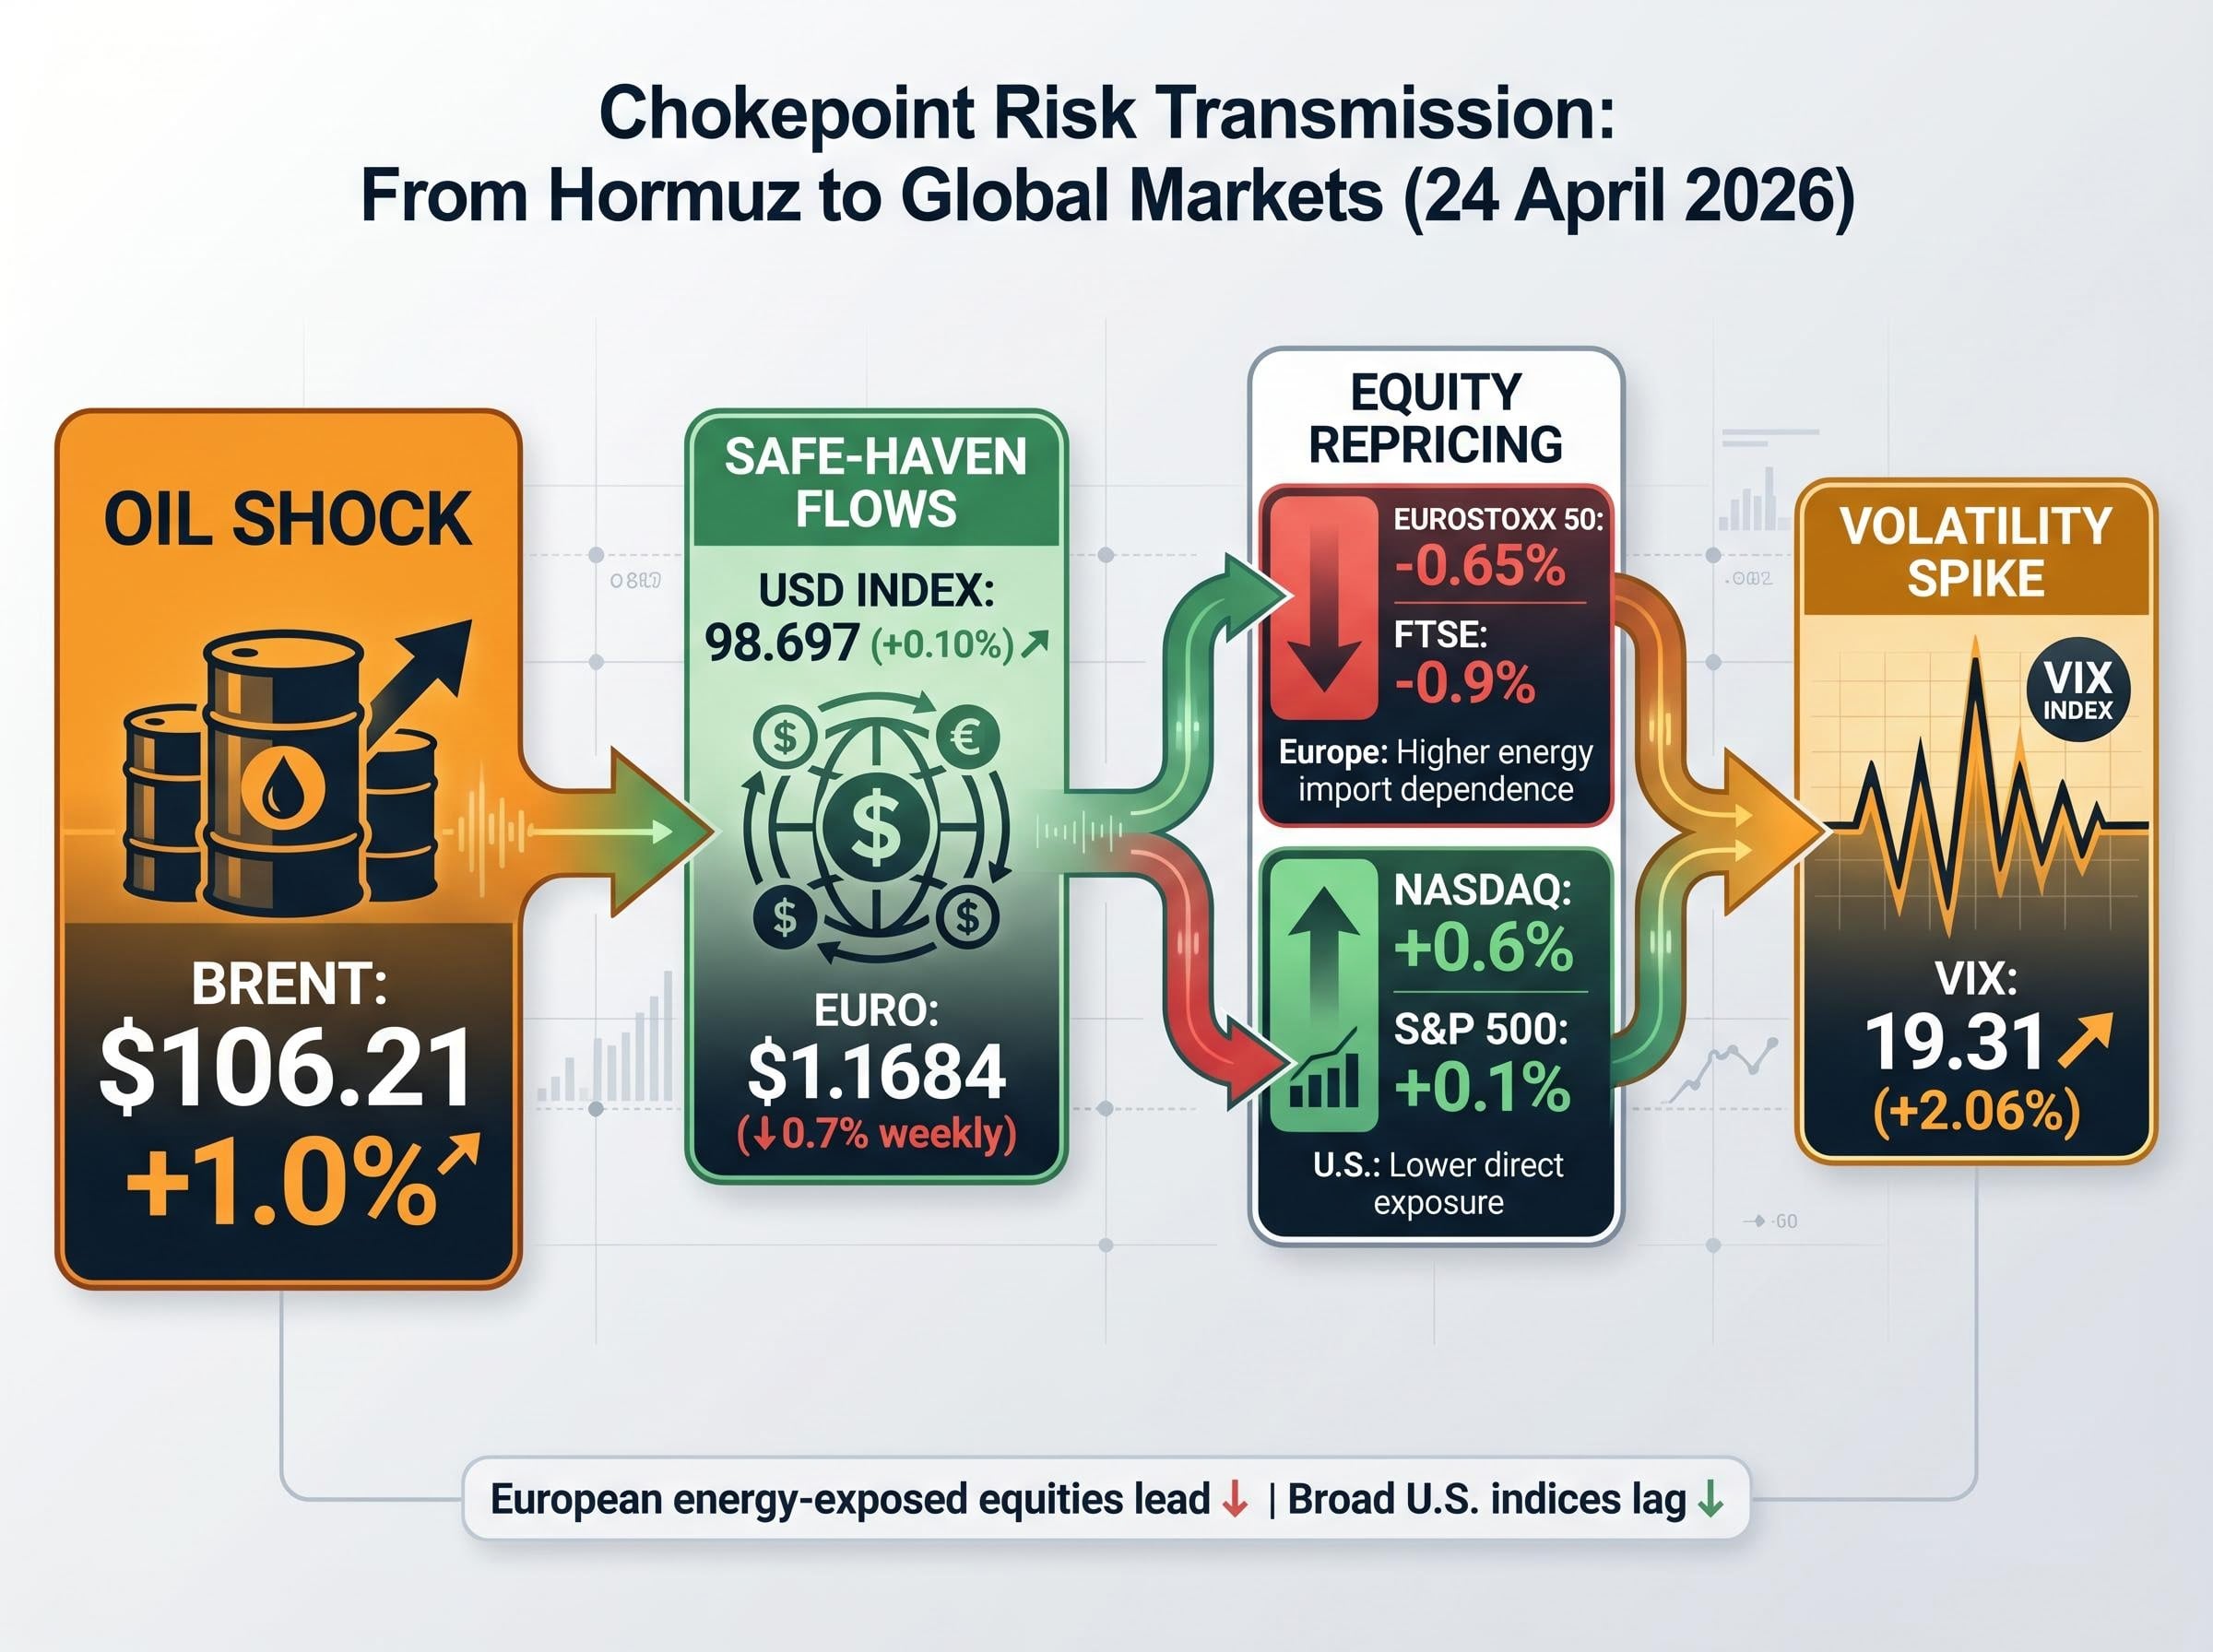
European futures fell harder than U.S. futures on 24 April. EUROSTOXX 50 futures dropped 0.65% while FTSE futures fell 0.9%. The gap reflects Europe’s greater energy import dependence. When Brent moves, European equity markets absorb the repricing faster than their U.S. counterparts.
U.S. futures told a different story. Nasdaq futures increased 0.6% while S&P 500 futures edged up 0.1%, recovering from prior session losses. The resilience reflects lower direct energy exposure and rotation into sectors positioned to benefit from higher commodity prices.
Currency markets encoded the same transmission. The euro traded at $1.1684, tracking a weekly loss of roughly 0.7%. The U.S. Dollar Index rose to 98.697, up 0.10% on the day. Safe-haven demand combined with energy-driven inflation expectations pushed the dollar higher against risk-sensitive currencies.
| Asset Class | Instrument | Friday Move | Weekly Direction |
|---|---|---|---|
| Currency | Euro/USD | $1.1684 | Down 0.7% |
| Currency | USD Index | 98.697 | Up 0.10% |
| Currency | Yen/USD | 159.78 | Down 0.7% |
| Equities | EUROSTOXX 50 | -0.65% | Pressured |
| Equities | FTSE Futures | -0.9% | Pressured |
| Volatility | VIX | 19.31 | Up 2.06% |
The VIX at 19.31, up 2.06%, confirmed elevated hedging demand. Not panic levels, but elevated enough to signal investors are pricing tail risk.
This transmission map shows which assets serve as leading indicators for escalation. European energy-exposed equities and yen weakness lead. Broad U.S. indices lag. Positioning ahead of further developments requires understanding these lead-lag relationships.
The yen weakened to 159.78 per dollar, on pace for a 0.7% weekly decline. The 160-per-dollar level functions as both psychological threshold and potential intervention trigger.
Japanese Finance Minister Katayama warned on Friday about resolute measures coordinated with the U.S. if currency volatility persists. The statement follows the familiar pattern: verbal intervention before actual intervention, testing whether words alone can stabilise the currency.
MFS analyst Carl Ang noted that Golden Week’s reduced liquidity could create intervention conditions and sharp yen appreciation within the 150-160 range. The timing risk is real: Japanese markets close for Golden Week just as central bank decisions arrive. If the Bank of Japan opts for intervention, it may need to act during the holiday period when domestic market liquidity is thin.
The yen’s weakness reflects both risk-off dynamics and Japan’s energy import vulnerability. When oil prices surge, Japan’s current account pressures intensify, weighing on the currency. The dual pressure (geopolitical risk plus energy costs) explains why the yen is trading near intervention territory despite safe-haven demand that would typically support it.
The Federal Reserve, European Central Bank, Bank of England, and Bank of Japan all convene the week following 24 April. Each faces the same dilemma: elevated energy costs create inflation pressure, but demand destruction from those same costs argues against rate increases.
Rabobank’s Jane Foley framed the challenge clearly this week:
“Energy-driven demand destruction could discourage G10 central banks from raising rates in coming months, even as headline inflation pressures build.”
The trade-off is stark. Higher oil prices push headline inflation higher, which ordinarily demands hawkish policy responses. But if those higher prices simultaneously crush demand (consumers spending more on fuel, less on discretionary goods; manufacturers facing margin compression), then raising rates amplifies the demand shock rather than containing inflation.
The NBER research on oil price shocks and monetary policy interactions demonstrates how positive oil price shocks combined with accommodative policy create conditions for inflation surges, a dynamic that explains why central banks face such acute trade-offs when energy disruptions coincide with existing policy looseness.
The Fed enters its meeting with 10-year Treasury yields at 4.332% and 30-year yields at 4.92%. Bond markets are already pricing the inflation pressure. The question is whether the Fed acknowledges the demand destruction argument or focuses on the headline inflation number.
The four central bank meetings and their respective contexts:
Central bank reactions to oil shocks shape asset allocation for months. The demand destruction argument provides cover for dovish surprises even amid high headline inflation. Investors should monitor not just the rate decisions but the specific language around energy-driven inflation versus underlying growth trajectories.
For readers wanting to understand the specific policy frameworks each central bank is applying, our dedicated guide to central bank decisions this week walks through the Fed, ECB, Bank of England, and Bank of Japan meeting contexts, including the markets’ 73% probability of no Fed rate cuts in 2026 and the Bank of Japan’s unique intervention calculus.
The equity picture is not uniformly negative. Divergence itself tells a story about sectoral and regional positioning.
MSCI Asia-Pacific ex-Japan rose 0.3% on the day, tracking toward a 0.8% weekly gain. Within that, Japan’s Nikkei rose approximately 0.45%. South Korea, China, and Hong Kong indexes traded lower, reflecting differentiated exposure to energy costs and export sensitivity.
The U.S. session painted a clearer rotation story. Major indices closed lower:
Tech-heavy names bore the brunt. ServiceNow fell 17.75%, Microsoft declined 3.97%, NVIDIA dropped 1.41%, and Tesla retreated 3.56%. The selloff reflected dual pressures: AI spending concerns alongside geopolitical uncertainty.
But the outliers reveal where money is moving. United Rentals surged 22.92%, Texas Instruments climbed 19.43%, and Intel gained 2.31%. The rotation into cyclicals and certain industrials suggests investors are positioning for infrastructure and real-economy plays that benefit from supply-chain reshoring themes, even as tech names face multiple headwinds.
The S&P 500 valuation contradictions between the Shiller P/E at 40.09 (second-highest in 155 years) and the forward P/E compressing to near five-year norms create a split signal for investors navigating the current environment of elevated geopolitical risk and energy-driven inflation.
| Company | Daily Change | Sector Context |
|---|---|---|
| United Rentals | +22.92% | Industrial equipment, infrastructure beneficiary |
| Texas Instruments | +19.43% | Semiconductor, reshoring beneficiary |
| Intel | +2.31% | Semiconductor, domestic production focus |
| ServiceNow | -17.75% | Enterprise software, AI spending concern |
| Microsoft | -3.97% | Technology, cloud and AI exposure |
| NVIDIA | -1.41% | Semiconductor, AI hardware exposure |
The rotation is not random. United Rentals benefits from infrastructure spending that accelerates when supply-chain vulnerabilities drive reshoring. Texas Instruments and Intel gain from semiconductor localisation efforts. These moves suggest some investors are positioning for a prolonged environment where geopolitical risk drives policy toward domestic capacity building, even as headline tech names face uncertainty.
Gold’s behaviour during the Hormuz standoff presents a puzzle. Spot gold remained unchanged at $4,691.60 per ounce on 24 April despite elevated geopolitical risk across multiple theatres.
The apparent contradiction (flat gold, elevated risk) carries information. Gold’s prior run-up to above $4,600 already priced significant disruption risk. The marginal dollar is flowing to cash and Treasuries rather than adding gold positions. The flatness suggests the market believes the Hormuz standoff is being managed rather than escalating toward actual supply disruption.
Gold at $4,691.60 per ounce (unchanged) signals that markets are pricing the Hormuz standoff as a contained risk rather than an escalating crisis. If that assessment proves wrong, gold has room to reprice sharply.
The Lebanon-Israel ceasefire extension announced following a White House meeting this week drew minimal market reaction. The three-week extension was largely dismissed by traders, suggesting investors are distinguishing between theatres of risk. The Hormuz chokepoint commands attention because it threatens immediate supply disruption. The Lebanon-Israel theatre, while geopolitically significant, carries lower economic transmission risk.
Three safe-haven signals and what each implies:
The forward-looking question: what would change the current equilibrium? Actual supply loss versus continued standoff without disruption. If Iranian forces close the Strait or mining operations disrupt tanker traffic materially, gold reprices sharply higher. If the standoff persists without supply loss, current prices likely hold. The market is pricing the second scenario. The risk is the first.
The Strait of Hormuz standoff has moved from diplomatic headlines to operational confrontation. Oil prices, currencies, and equities all reflect elevated disruption risk, with the transmission path from Brent crude through European futures to yen weakness demonstrating how a single chokepoint can reprice global assets within hours.
Next week’s central bank decisions will reveal how policymakers weigh inflation pressure against demand destruction. The Federal Reserve, European Central Bank, Bank of England, and Bank of Japan all face the same trade-off: energy-driven inflation argues for hawkish policy, but energy-driven demand destruction argues for caution. How they resolve that tension will shape asset allocation across equities, fixed income, and currencies for the remainder of Q2 2026.
The resolution of this standoff, or its further escalation, will determine whether current oil prices represent fair value or the early stage of a larger repricing. Gold’s flatness at $4,691.60 suggests markets are pricing managed risk rather than crisis. If that assessment proves wrong, repricing will be swift.
Investors should monitor three signals closely: Brent-WTI spread movements for escalation pricing, yen levels approaching 160 for intervention risk, and central bank commentary for shifts in the inflation-versus-growth trade-off. The standoff’s next phase will be written in these markets before it appears in diplomatic statements.
—
This article is for informational purposes only and should not be considered financial advice. Investors should conduct their own research and consult with financial professionals before making investment decisions.
The Strait of Hormuz carries roughly 20% of global oil supply daily with no viable alternative route for most of that volume, so even the threat of disruption causes traders to immediately price a probability-weighted range of supply-loss scenarios into Brent crude futures.
The Brent-WTI spread is the price difference between the international Brent benchmark and U.S. West Texas Intermediate crude; during the April 2026 standoff it widened to over $9, signalling that geographic risk is concentrated in the Middle Eastern waterway rather than in North American supply.
Higher energy costs push headline inflation upward, which normally calls for rate increases, but the same costs can crush consumer and business demand, giving central banks reason to hold rates steady or cut; this tension was the central challenge facing the Fed, ECB, Bank of England, and Bank of Japan heading into their meetings in late April 2026.
Investors should monitor three key indicators: movements in the Brent-WTI spread for escalation pricing, the yen approaching 160 per dollar as a Japanese intervention trigger, and central bank language distinguishing energy-driven inflation from underlying growth conditions.
Spot gold remaining unchanged despite elevated geopolitical risk suggests markets believe the Hormuz standoff is being managed rather than escalating into actual supply disruption, with the prior run-up above $4,600 having already priced significant risk; a material supply loss would likely trigger a sharp repricing higher.