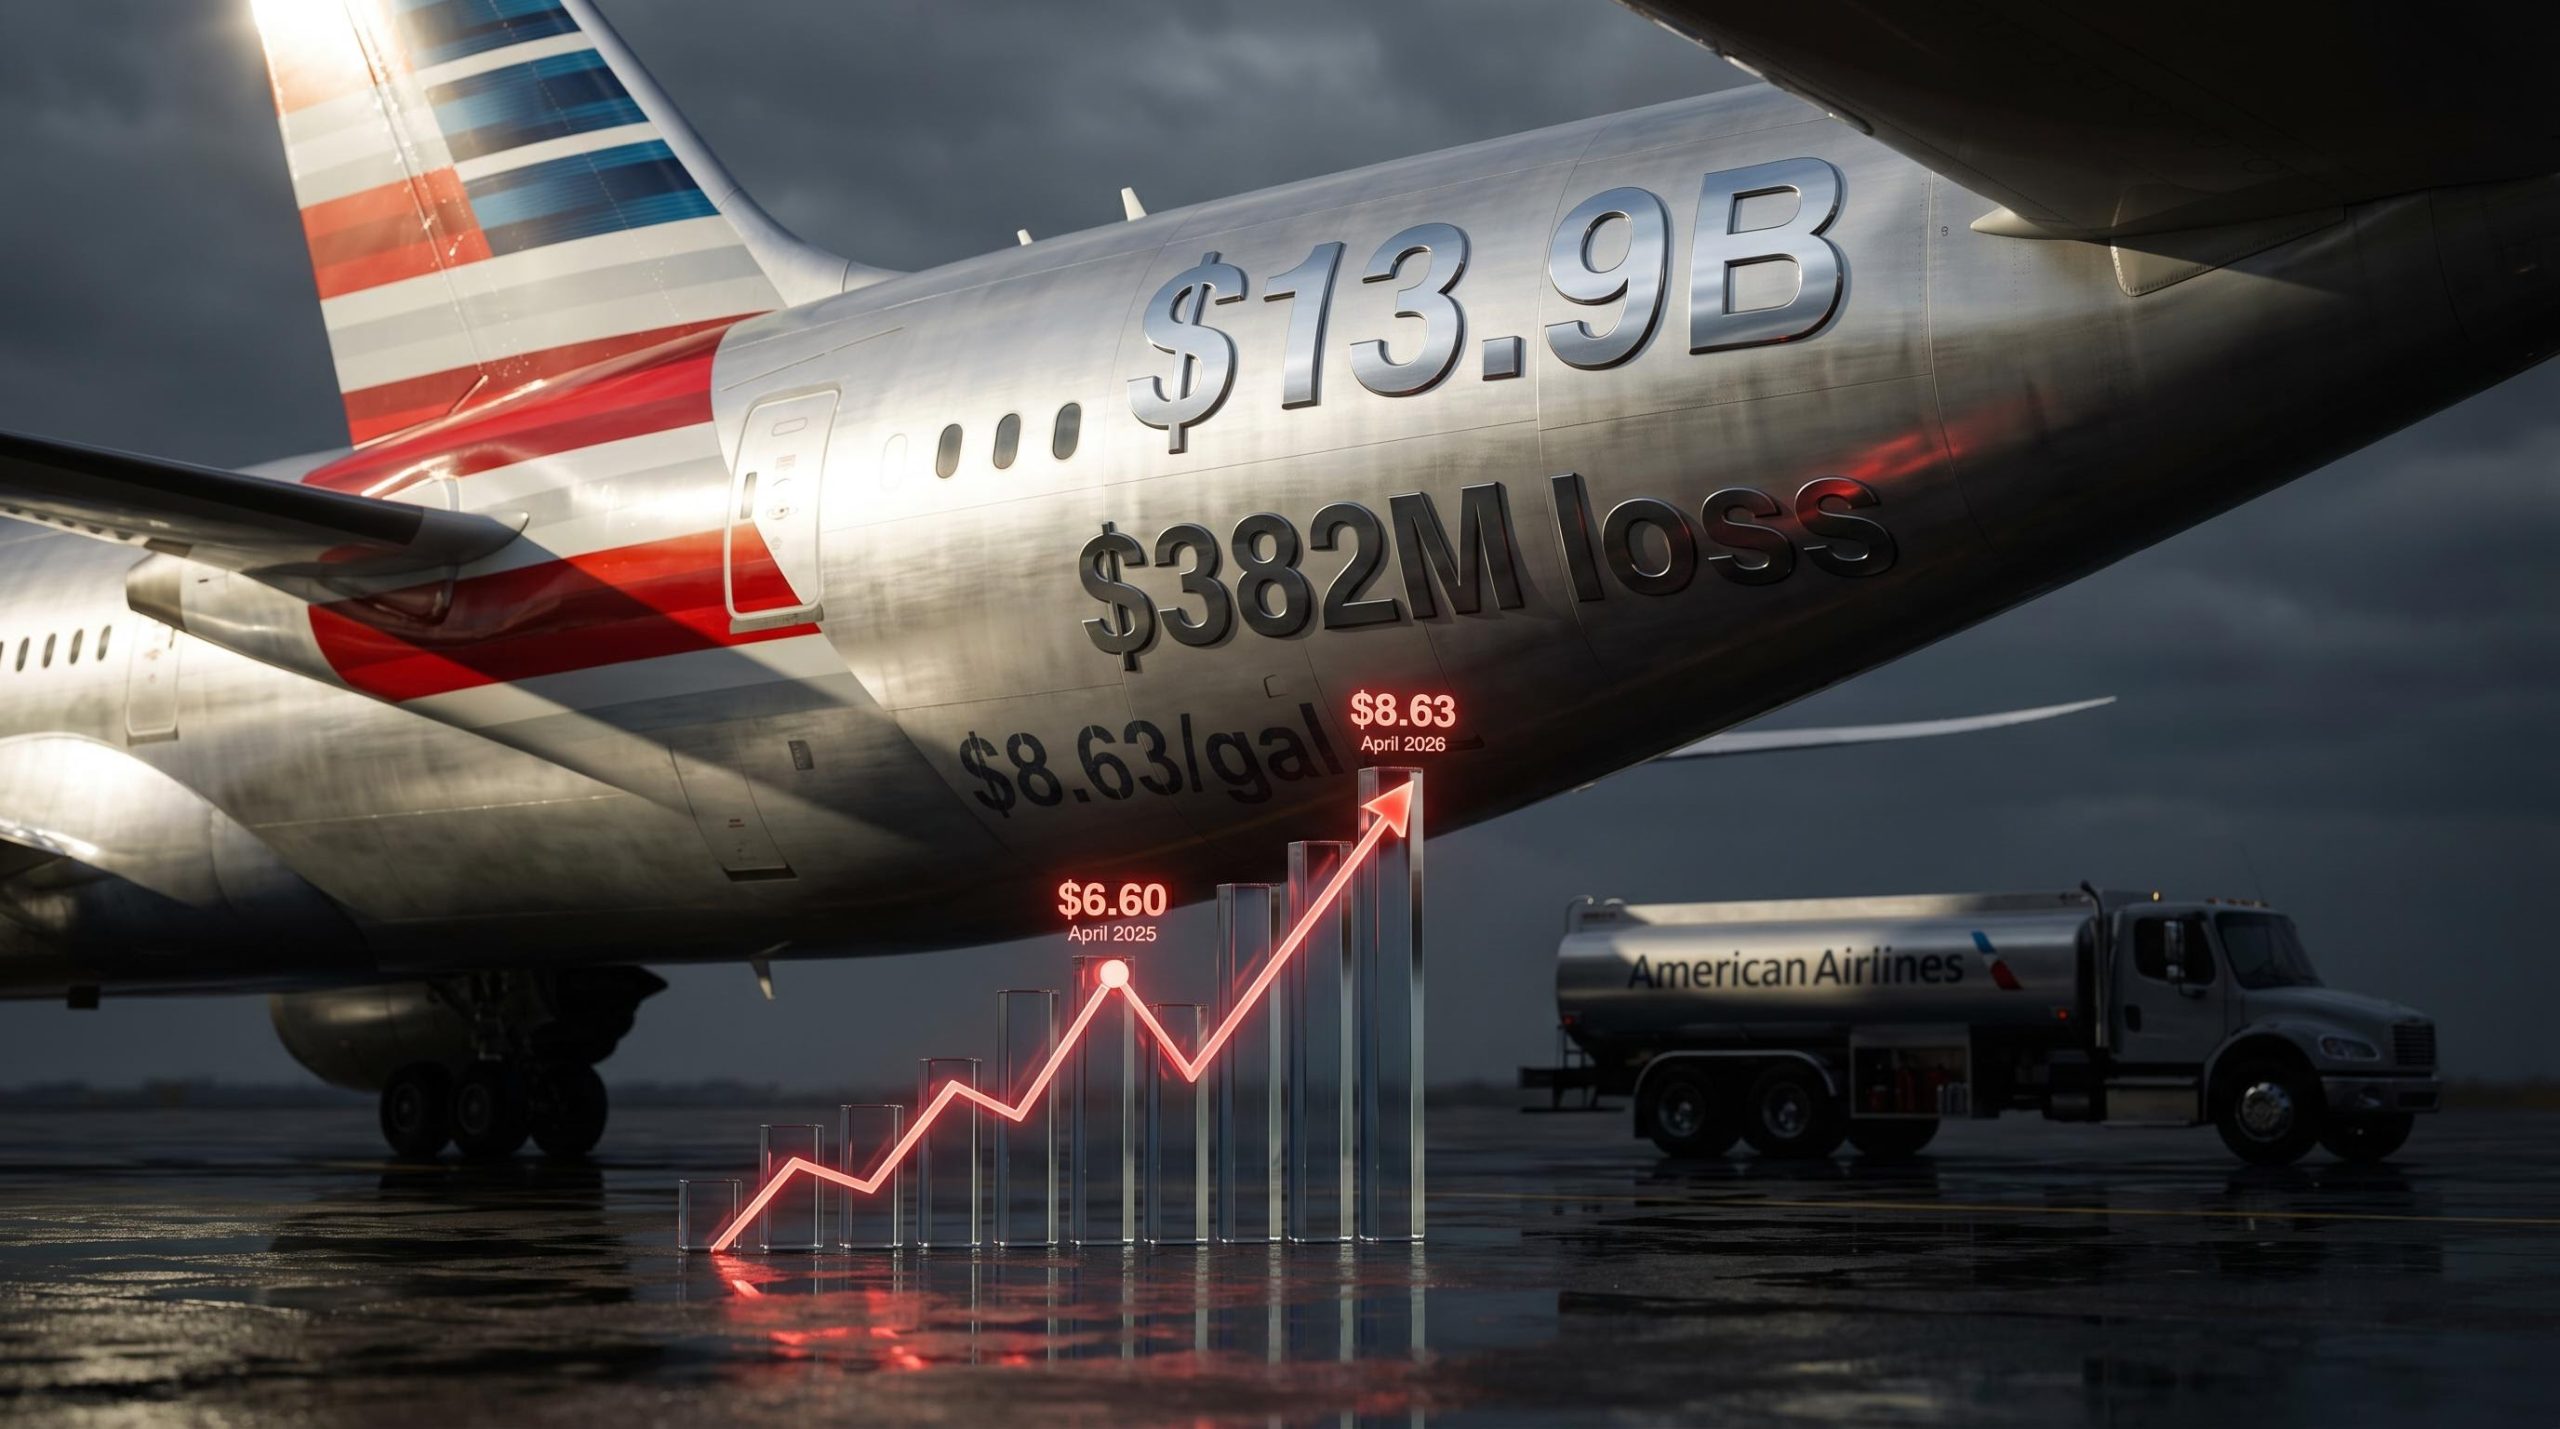
How $4B in Fuel Costs Erased American Airlines’ Record Q1
18 mins ago

The S&P 500 has posted five consecutive weekly declines, a pattern seen only twice in fifteen years, while oil surged over 5% on 20 April alone following U.S. vessel seizure headlines and renewed Strait of Hormuz closure fears. The truce announced in mid-April between the U.S., Israel, and Iran has produced relief rallies, but these gains are driven by hedge unwinds rather than fundamental diplomatic progress. The Strait of Hormuz remains closed, representing what the International Energy Agency calls the largest oil supply disruption in history.
This analysis unpacks what the U.S.-Iran conflict means for American investors across equities, commodities, and bonds, and provides a framework for navigating the weeks ahead as potential mid-May negotiations loom.
The mid-April truce halted immediate military escalation. Markets rallied. The S&P 500 clawed back some of its 5% decline from early March. Energy stocks that had spiked on supply fears pulled back. The relief felt real for about three trading sessions.
Then the details arrived. The Strait of Hormuz remains closed. No tankers are moving through the world’s most critical oil chokepoint. Energy infrastructure damaged during six weeks of exchanges has not been repaired. The truce paused the strikes, but it did not resolve the supply crisis that is driving market stress.
The International Energy Agency’s characterisation of the Strait closure as the greatest global energy security challenge in history reflects the unprecedented scale of disruption, with approximately 20-30% of global seaborne oil flow halted and no precedent for closures of this duration in the modern energy market.
Steven Cook from the Centre for Strategic and International Studies expressed skepticism regarding Iranian concessions in any potential deal during Bloomberg Surveillance on 17 April. His assessment reflects the professional view: this truce is a pause, not a resolution. The equity rebounds that followed the announcement reflect short covering and hedge removals, not improved fundamentals.
Two signposts would indicate genuine de-escalation:
Neither has occurred. Until they do, the relief rally is a positioning adjustment, not a risk-off signal.
“The truce has paused immediate escalation, but skepticism remains regarding Iranian concessions in any potential deal.” – Steven Cook, Centre for Strategic and International Studies, 17 April 2026
The S&P 500 has fallen 5% since early March, marking five consecutive weekly drops. The MSCI ACWI ex-U.S. declined over 10% in March. Markets slid toward correction territory following U.S.-Israeli strikes, rebounded sharply on de-escalation hopes, then reversed lower again on 20 April as Strait closure fears resurfaced. The pattern is headline-driven volatility, not directional conviction.
Oil markets are pricing physical scarcity. Brent crude surged over 5% on 20 April. Oil futures remain in steep backwardation, the structure that signals immediate supply tightness. Traders are willing to pay premium for near-term delivery because the Strait remains closed and alternative routing cannot offset the volume loss. Gold prices have risen as a safe-haven asset amid disruptions.
The VIX reflects elevated headline risk. Volatility is not collapsing despite the ceasefire, because the ceasefire has not resolved the supply disruption driving the volatility.
| Asset Class | Key Metric | Movement | Signal |
|---|---|---|---|
| Equities (S&P 500) | -5% since early March | Five consecutive weekly declines | Correction risk persists |
| Oil (Brent) | +5% on 20 April | Steep backwardation | Physical supply stress |
| Gold | Rising | Safe-haven demand | Safe-haven demand |
| Bonds (Yields) | Rising | Inflation concerns | Inflation concerns |
| Volatility (VIX) | Elevated | Headline risk | Headline risk elevated |
Bond yields are rising on inflation fears. Commodity price spikes feed inflation expectations, which erase rate cut expectations, which tighten financial conditions. The Federal Reserve’s projected rate cuts have been postponed as oil at elevated levels complicates the inflation outlook.
The inflation transmission mechanism from commodity shocks to monetary policy operates through multiple channels, with energy price spikes feeding headline inflation prints, which then anchor consumer expectations and force central banks to maintain restrictive stances even as growth slows.
Credit spreads are widening as financial conditions tighten. The transmission from geopolitical shock to commodity spike to inflation expectation to monetary policy is functioning exactly as textbooks describe, and the result is pressure across equities, commodities, and fixed income simultaneously.
Energy is the direct transmission mechanism. The Strait closure keeps supplies tight, prices elevated, and the sector volatile. Defence and energy sectors show unusual volatility tied to military operations and infrastructure risks. These are the sectors most exposed to the conflict’s physical effects.
The energy sector positioning across majors versus leveraged plays carries materially different risk-return profiles under sustained elevated oil prices, with integrated majors offering stability through downstream hedges while smaller exploration and production names deliver amplified exposure to price moves.
Airlines absorb the fuel cost channel. United Airlines dropped 6% on supply fears as elevated oil prices compress margins for carriers that cannot hedge away the exposure. Airlines face pressure from elevated fuel costs and supply chain disruptions that extend beyond the energy input itself.
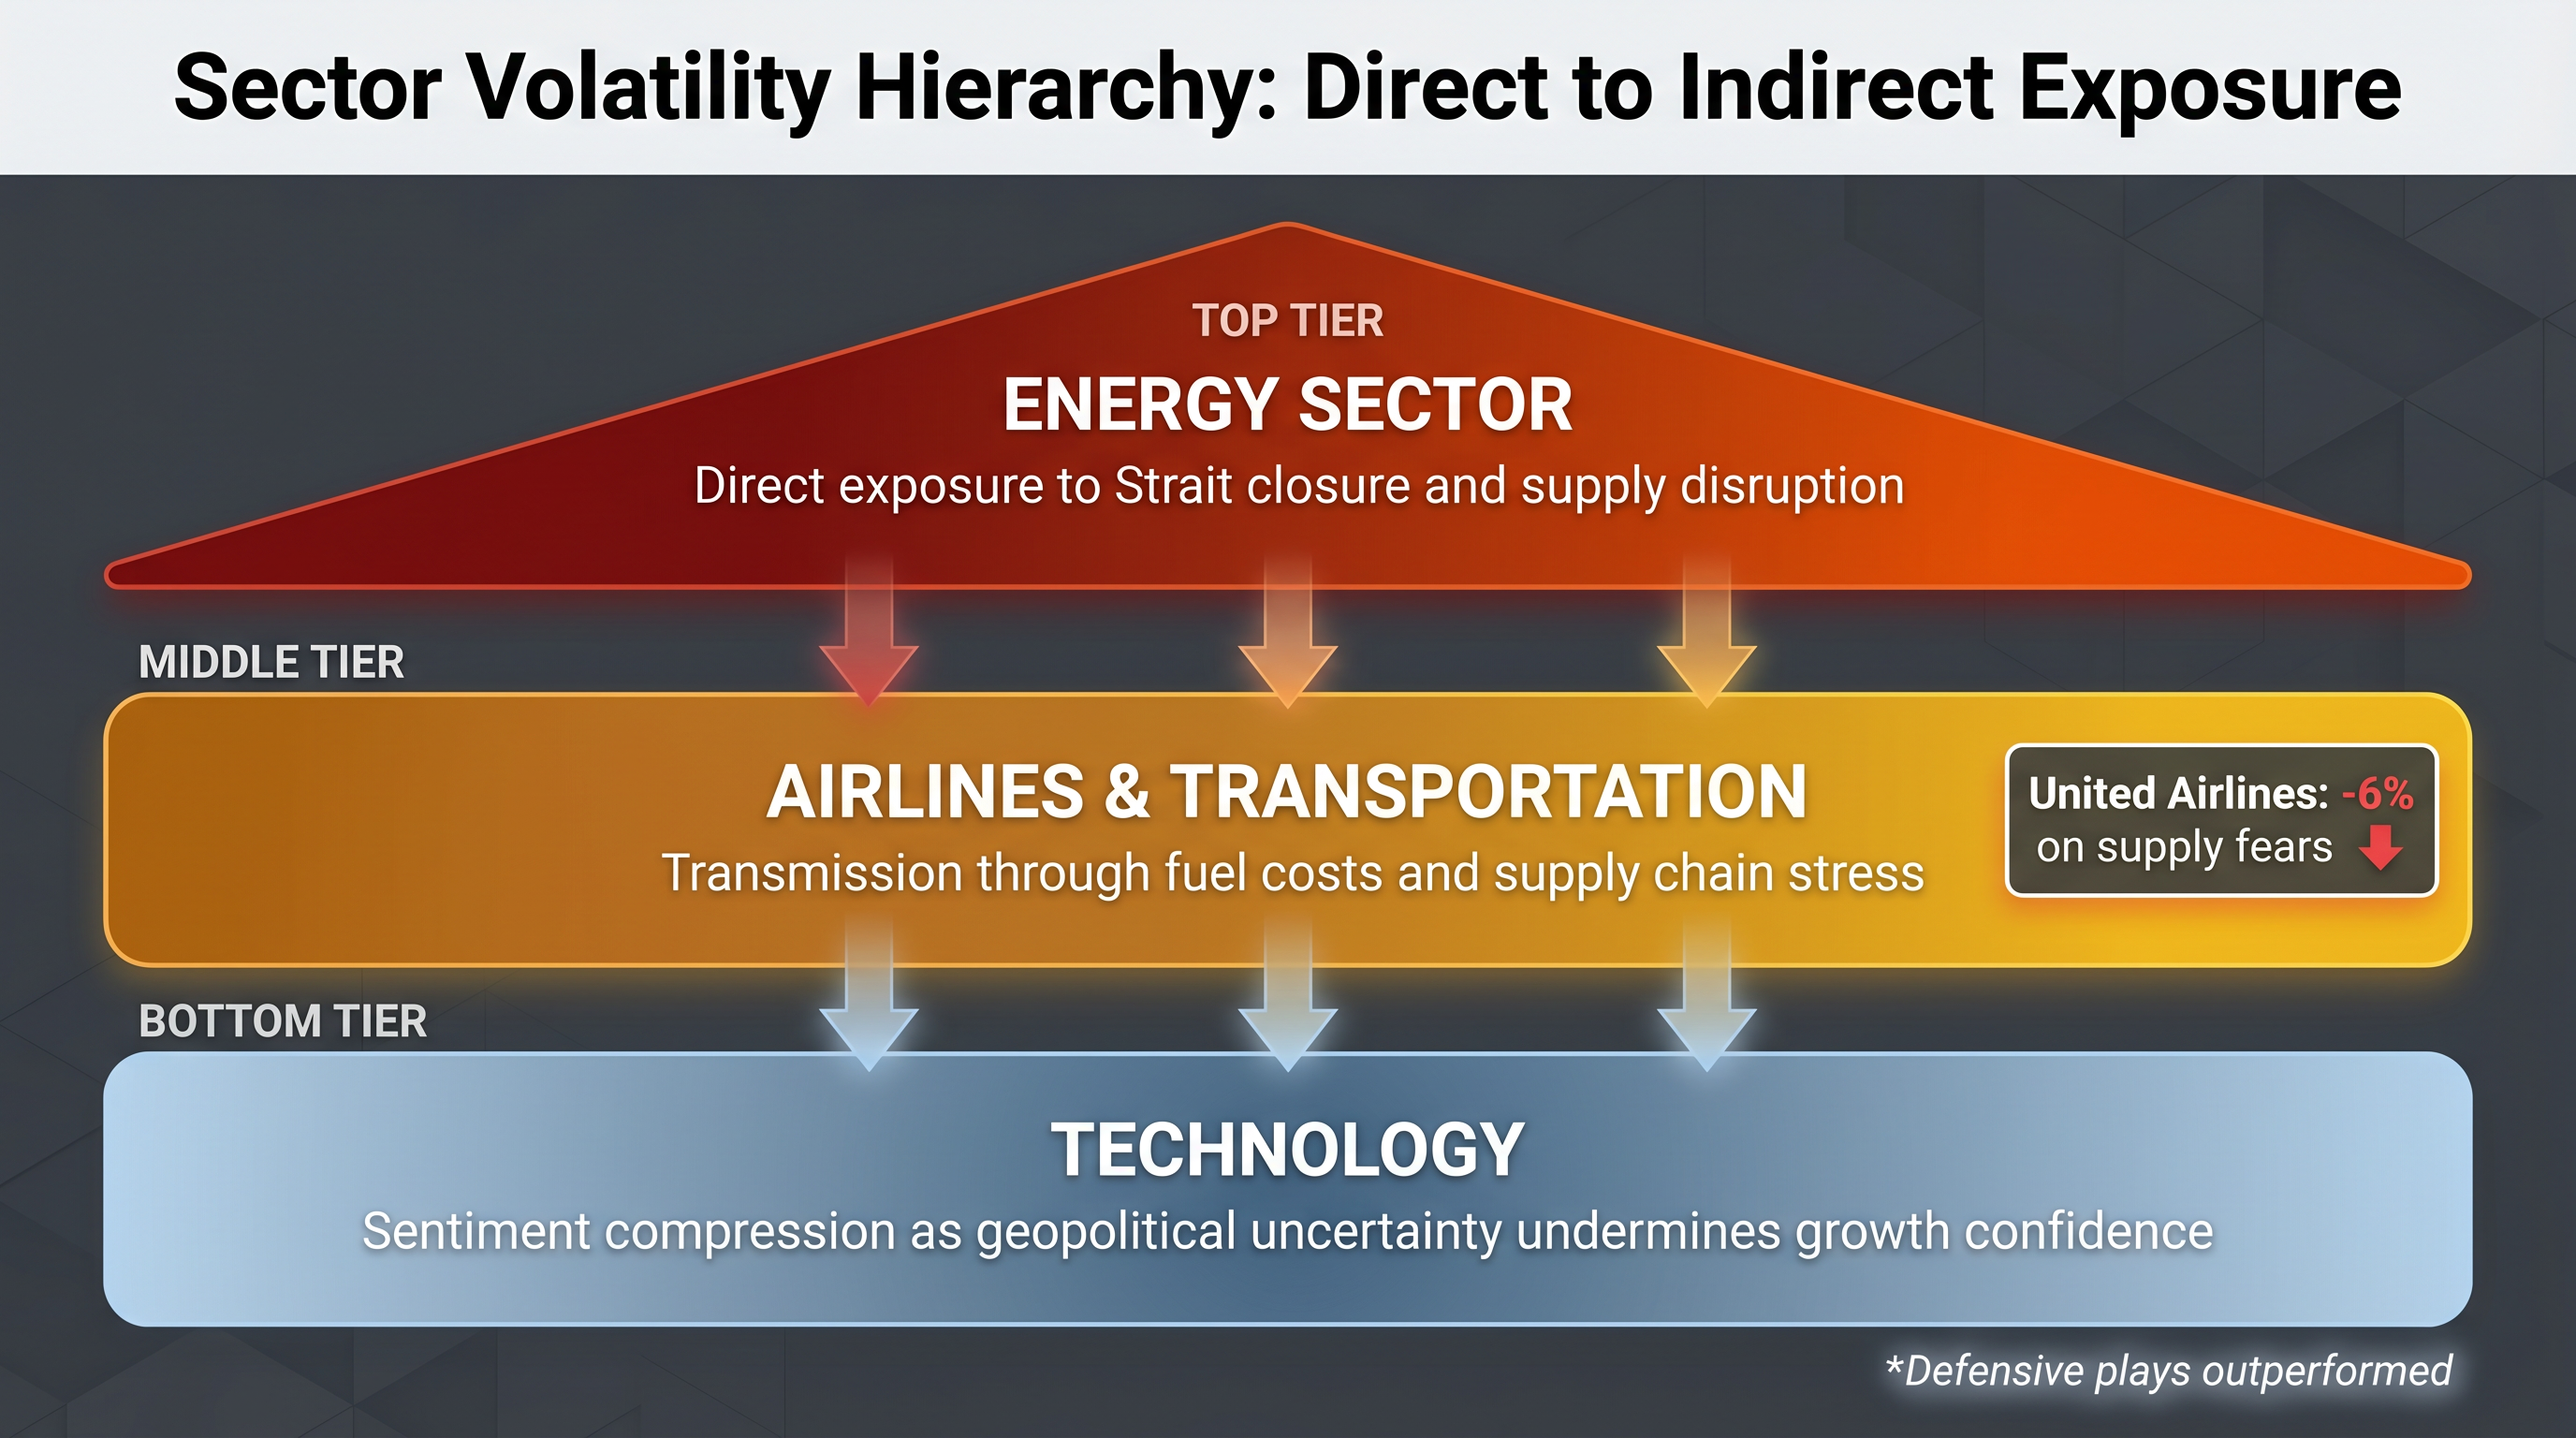
Technology’s underperformance reflects the cracking of pre-war AI optimism under geopolitical uncertainty. The sector is not collapsing, but the confidence that drove the 2025 rally is compressing under headline risk.
Defensive plays outperformed. The rotation pattern is clear: direct energy exposure leads, fuel-cost-sensitive industries absorb, growth-oriented technology lags, and defensives benefit.
The hierarchy operates as follows:
“United Airlines dropped 6% on supply fears, emblematic of airline sector stress as elevated fuel costs compress margins.”
Oil futures are in steep backwardation. Near-term contracts are trading higher than future contracts. The structure persists because physical demand is outstripping available supply with the Strait closed, not because of speculation alone.
Backwardation is the market’s real-time verdict on supply adequacy. When traders are willing to pay premium for immediate delivery, they are betting on scarcity continuing rather than easing. The shape of the oil curve right now signals that the market does not expect the Strait to reopen quickly, regardless of the truce.
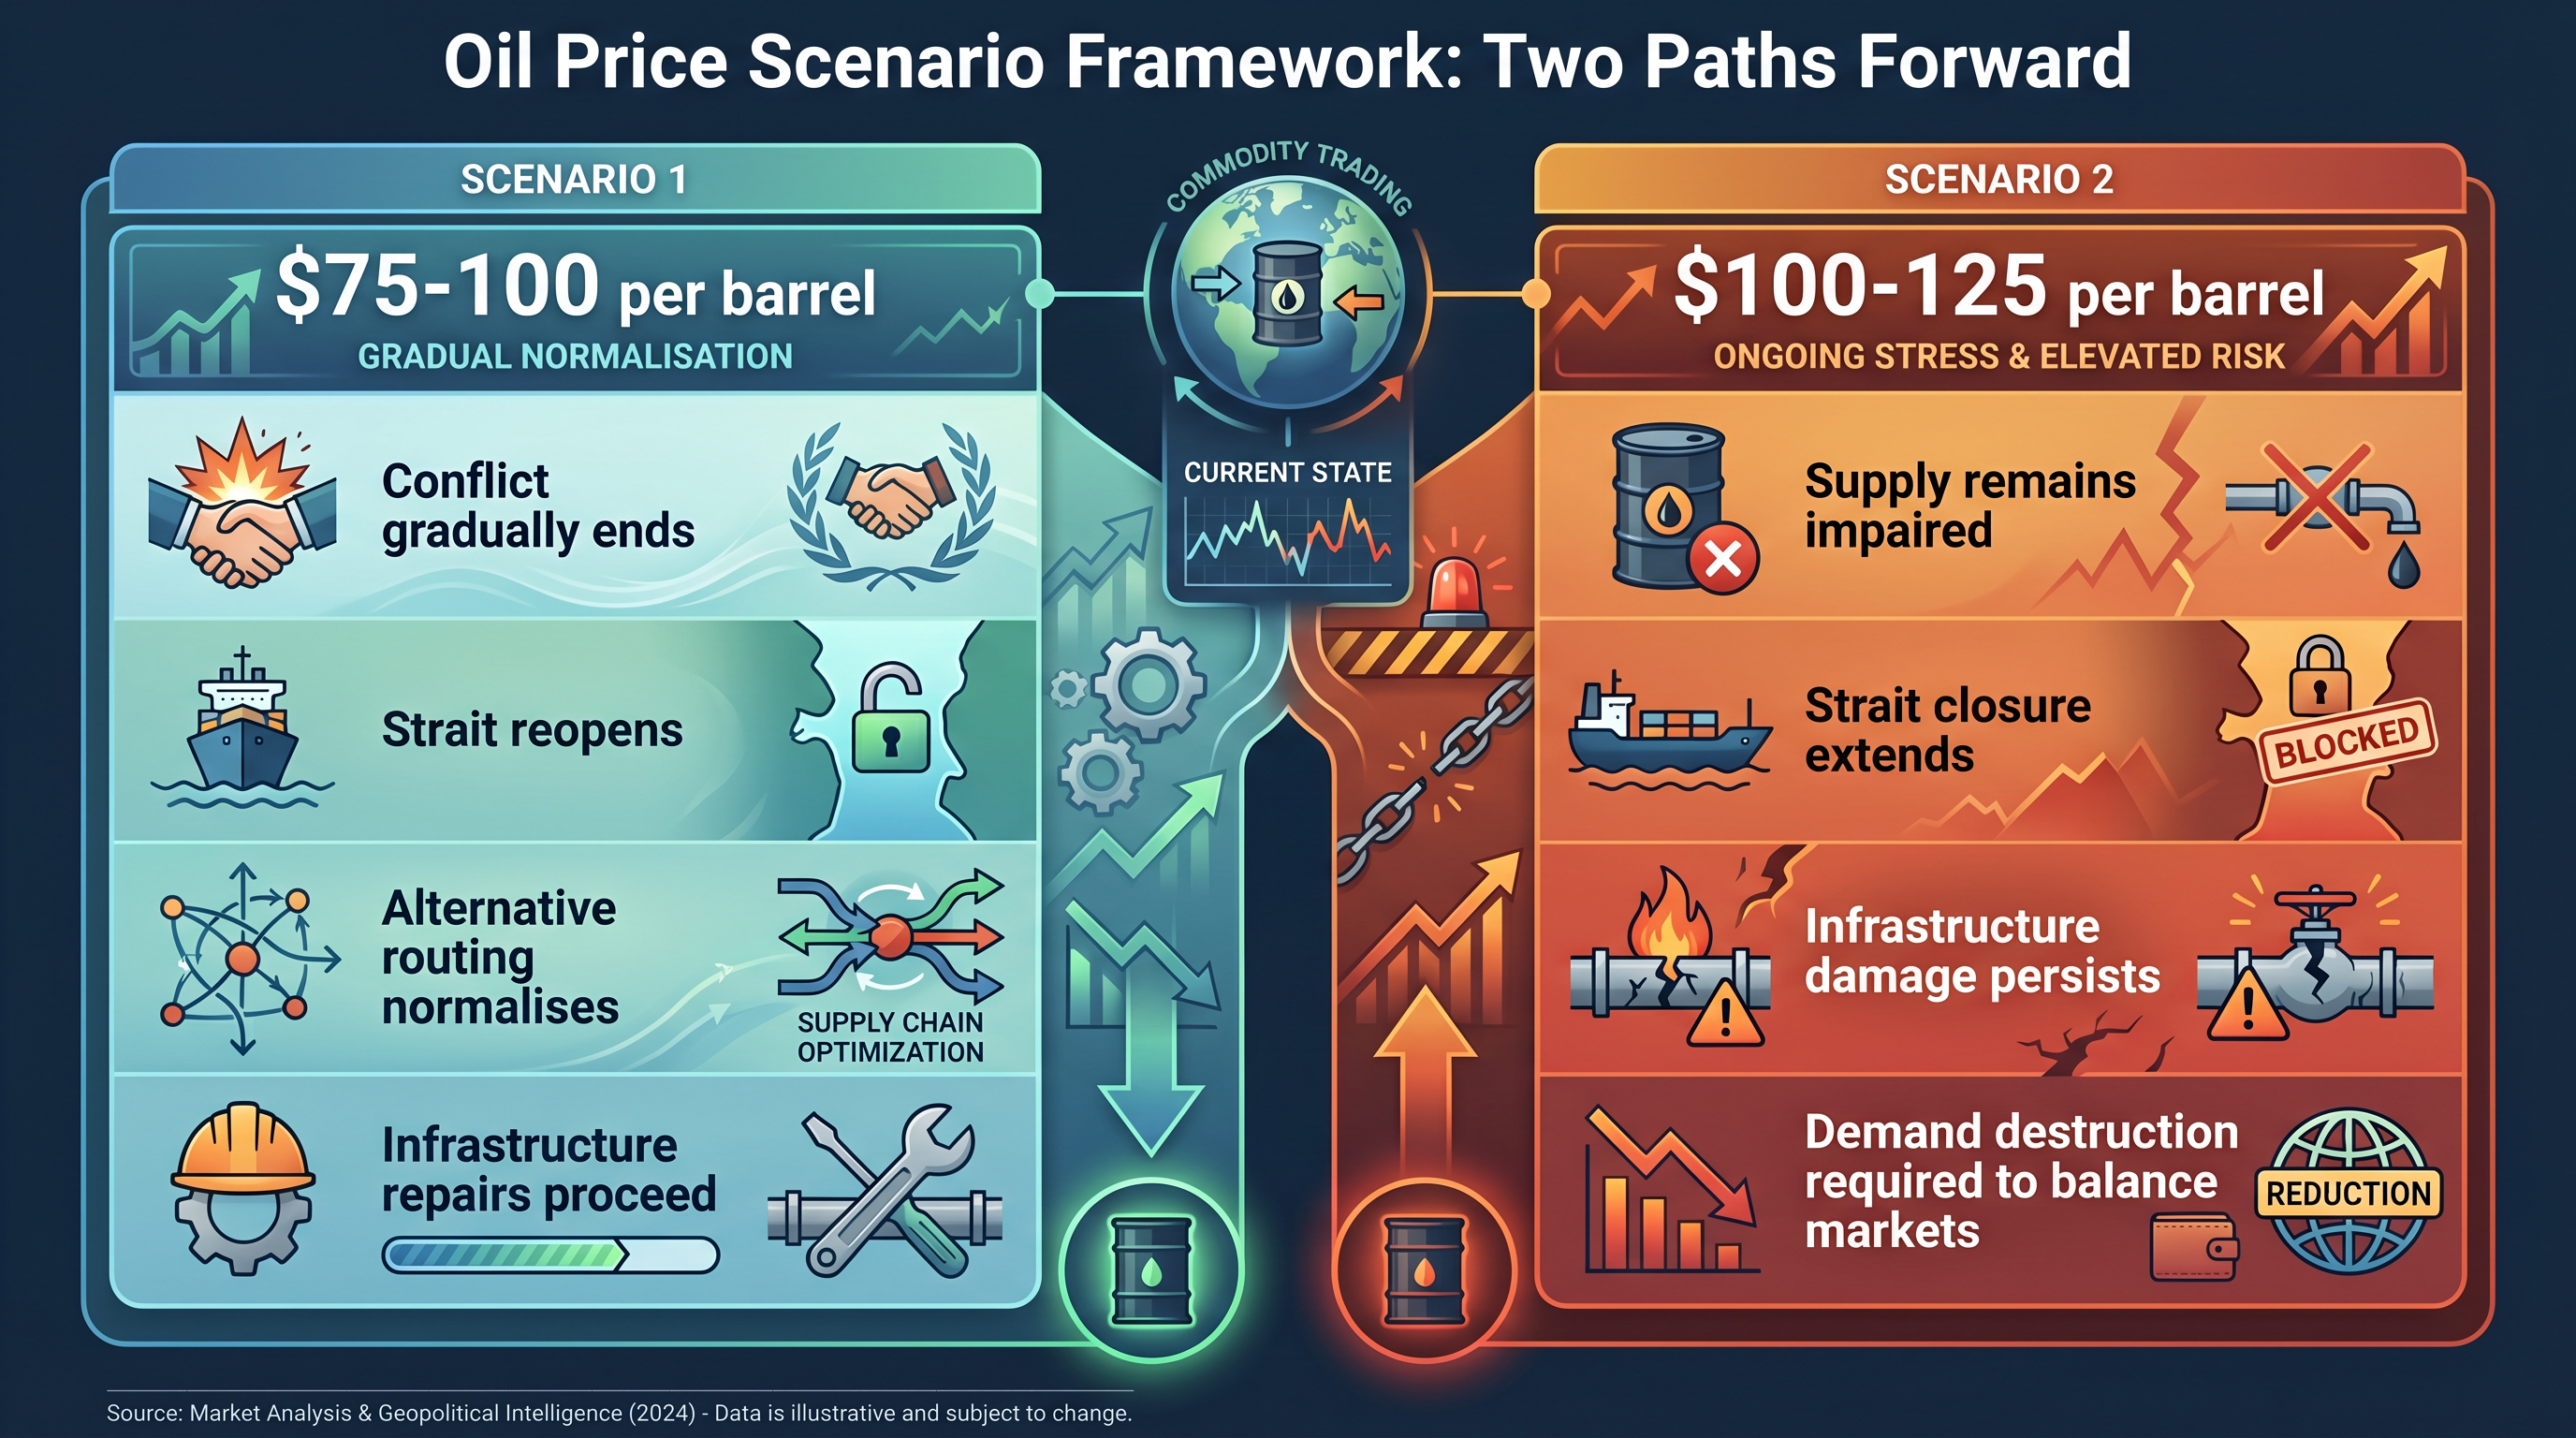
Two price scenarios frame the outlook:
The backwardation structure supports the higher scenario as long as the Strait remains closed. If traffic normalises, the curve will flatten quickly as physical tightness eases.
“The Strait of Hormuz closure represents the largest oil supply disruption in history, with oil markets in steep backwardation reflecting physical demand pressures and acute shortages echoing 1970s energy crises.” – International Energy Agency
Leading analysts warn of persistent headline-driven market swings despite the truce. The shared view across strategists is that the ceasefire paused immediate escalation but left critical uncertainties unresolved. Markets will remain volatile until Strait normalisation and energy flow clarity emerge.
Hank Paulson, former U.S. Treasury Secretary, noted in a recent interview that the war pressures energy markets, pushes inflation higher, elevates interest rates, and strains sectors from airlines to agriculture. He flagged U.S. economic resilience but highlighted mounting risks from debt levels and U.S.-China relations.
Ed Yardeni maintains equity optimism despite headwinds. JPMorgan’s Chang notes strong risk appetite driven by ceasefire hopes and AI growth expectations. Barclays’ Altmann flagged market repricing amid ongoing tensions during Bloomberg Surveillance on 17 April.
| Strategist | Affiliation | Key View |
|---|---|---|
| Hank Paulson | Former U.S. Treasury Secretary | War pressures energy, elevates rates, strains sectors; flags U.S. debt and China risks |
| Ed Yardeni | Independent Analyst | Maintains equity optimism despite geopolitical headwinds |
| Chang | JPMorgan | Strong risk appetite driven by ceasefire hopes and AI growth expectations |
| Altmann | Barclays | Markets repricing amid ongoing tensions (17 April 2026) |
The practical consensus among strategists is clear:
Scenario A assumes moderate de-escalation. Financial conditions remain tighter than pre-conflict levels but avoid major corrections. Bond yields stay range-bound as inflation concerns ease gradually. Energy markets normalise as Strait traffic resumes and infrastructure repairs proceed. Equity markets stabilise with defensive positioning still favoured over aggressive growth bets.
Under this scenario, the truce holds through mid-May negotiations involving China. Diplomatic progress produces incremental confidence. Oil prices drift toward the $75-100 range as supply fears ease. Rate cut expectations return cautiously. Credit spreads narrow modestly. Investors rotate back toward growth sectors as headline risk declines.
For investors seeking practical portfolio positioning strategies across different volatility regimes, our comprehensive guide to investing during market volatility in 2026 covers hedging techniques, sector rotation frameworks, and asset allocation adjustments tailored to geopolitical supply shocks.
Monitoring checklist for Scenario A confirmation:
Scenario B assumes adverse conditions persist. Impaired supplies trigger equity corrections beyond the current 5% decline. Credit spreads widen as financial conditions tighten further. Bond yields rise on inflation concerns driven by sustained commodity price elevation. The Strait closure extends beyond mid-May, forcing demand destruction to balance oil markets.
Under this scenario, the truce breaks down before or during mid-May negotiations. Military exchanges resume. Oil prices move toward the $100-125 range as physical scarcity intensifies. Stagflation risk emerges as growth slows while inflation persists. Rate cuts are postponed indefinitely. Equity markets enter correction territory with energy and defence outperforming while technology and consumer discretionary underperform sharply.
Positioning implications under Scenario B:
Both scenarios carry medium likelihood according to current analysis. The distinguishing variable is Strait normalisation. Traffic resumption shifts probability toward Scenario A. Extended closure confirms Scenario B.
The mid-April truce has paused immediate escalation, but the market’s work is not done. The Strait of Hormuz closure, steep oil backwardation, and erased rate cut expectations mean the crisis continues to price through equities, commodities, and bonds in real time. Relief rallies reflect positioning adjustments, not fundamental risk reduction.
Mid-May negotiations involving China represent the next major catalyst. Until Strait traffic normalises and infrastructure repair begins, headline risk remains elevated and sector rotation will continue to favour defensive positioning over aggressive growth bets.
Monitor the three key signposts: negotiation progress, Strait reopening, and infrastructure repair timelines. These will determine whether current prices represent the floor or merely a pause before further adjustment.
This article is for informational purposes only and should not be considered financial advice. Investors should conduct their own research and consult with financial professionals before making investment decisions.
US-Iran tensions have pushed the S&P 500 down 5% since early March, producing five consecutive weekly declines driven by oil supply fears, inflation concerns, and erased rate cut expectations rather than any fundamental diplomatic resolution.
The Strait of Hormuz carries approximately 20-30% of global seaborne oil, and its closure has been described by the International Energy Agency as the largest oil supply disruption in history, driving steep oil backwardation and widespread market volatility.
Brent crude surged over 5% on 20 April alone, and oil futures remain in steep backwardation, a structure signalling that physical supply is acutely tight and traders expect scarcity to persist as long as the Strait stays closed.
Energy and defence sectors face direct exposure to supply disruption and military risk, airlines are pressured by elevated fuel costs (United Airlines dropped 6%), while technology stocks have underperformed as geopolitical uncertainty compresses growth sentiment.
Strategists broadly recommend avoiding aggressive risk additions until Strait traffic normalises, overweighting energy and defensive sectors such as utilities and consumer staples, and holding gold as an inflation and geopolitical hedge while monitoring mid-May negotiation progress.