A $100,000 investment in a single S&P 500 index fund grows to roughly $6.74 million over 30 years. The same $100,000, split across five Fidelity funds with a deliberate technology tilt, projects to approximately $20.1 million. That is a $13.36 million gap from the same starting balance, the same timeline, and the same brokerage platform.
The gap is real, but so is the fine print. Contrary to what the word “diversification” might suggest, the five-fund structure actually underperformed the S&P 500 on a risk basis in 2022, falling roughly 22% compared to the index fund’s 18%. What the five-fund portfolio is doing is something more specific and more volatile: it is making a concentrated bet on technology-sector compounding that happens to be wrapped in a five-position structure.
Here is what the projection data actually shows at year 10, year 20, and year 30, why a single assumption about technology returns controls most of the outcome, and what it costs, in real behavioural terms, to hold this strategy long enough to collect its theoretical advantage. This is the analytical framework for a decision you may already be weighing, not a verdict on which approach wins.
What FXAIX alone actually delivers over 30 years
The baseline deserves respect before any comparison arrives. Fidelity’s 500 Index Fund (FXAIX) charges an expense ratio of 0.015%, effectively nothing, and has delivered an annualised return of approximately 15.5% over the past decade. Applied to a $100,000 starting balance, the projection across three decades looks like this:
The SEC guidance on mutual fund fees and expenses establishes that even small differences in expense ratios compound into material return gaps over multi-decade holding periods, which is why FXAIX’s 0.015% charge is structurally significant when compared against funds with higher cost structures.
| Horizon | Projected value |
|---|---|
| Year 1 | ~$115,100 |
| Year 10 | ~$470,000 |
| Year 20 | ~$1,666,000 |
| Year 30 | ~$6,740,000 |
By the 30-year mark, that position alone is projected to generate annual dividend income of approximately $71,500, equivalent to around $5,960 each month, given a yield just above 1%. That is a genuinely compelling outcome from a single, near-zero-cost instrument.
FXAIX’s top 10 holdings account for more than a third of the fund’s total weight. Despite its name, the S&P 500 operates in practice as a heavily concentrated US mega-cap technology vehicle. Recent strong performance reflects that concentration, but it also means the fund carries no meaningful exposure to market segments outside US large-cap equities.
Index fund concentration risk is the structural tension the five-fund model is partly designed to address: FXAIX’s top 10 holdings account for more than a third of its total weight, meaning a single-fund strategy already carries a heavy technology skew before any deliberate tilt is added.
The real structural risk here is not underperformance. It is the lack of any buffer against a future in which US mega-cap technology no longer leads markets. Choosing the five-fund structure means giving up FXAIX’s $6.74 million projection as your floor and accepting that the upside depends on one specific sector continuing to compound at rates drawn from a historically unusual window.
When big ASX news breaks, our subscribers know first
How the five-fund blend changes the trajectory at each decade
The five-fund structure splits the same $100,000 equally across five positions, $20,000 each, each one filling a defined role within the portfolio: a US large-cap core, a concentrated technology growth sleeve, international market exposure, small-cap representation, and an income-generating position. No rebalancing, no taxes, no additional contributions. Each fund compounds at its own historical annualised average for the full 30-year period.
At year 1, the blend trails FXAIX. By year 10, it still trails by roughly $50,000. That deficit is not a rounding error. It is a real gap, large enough to feel like a mistake.
Over time, the mathematics of compounding shift the picture entirely. The technology sleeve, growing at approximately 24% annually, progressively takes over as the dominant driver of the portfolio’s total value, eventually dwarfing the other four positions combined. By year 20, the blend has pulled ahead by about $900,000. By year 30, the gap has widened to approximately $13.36 million.
| Horizon | Five-fund blend | FXAIX only | Yield-chasing (FREL) |
|---|---|---|---|
| Year 1 | ~$113,560 | ~$115,100 | — |
| Year 10 | ~$420,000 | ~$470,000 | — |
| Year 20 | ~$2,550,000 | ~$1,666,000 | — |
| Year 30 | ~$20,100,000 | ~$6,740,000 | ~$640,000 |
After three decades, the five-fund blend reaches a projected $20.1 million while FXAIX lands at $6.74 million, a difference of roughly $13.36 million on an identical starting balance. The technology sleeve’s outsized compounding rate is the primary mechanism behind that gap.
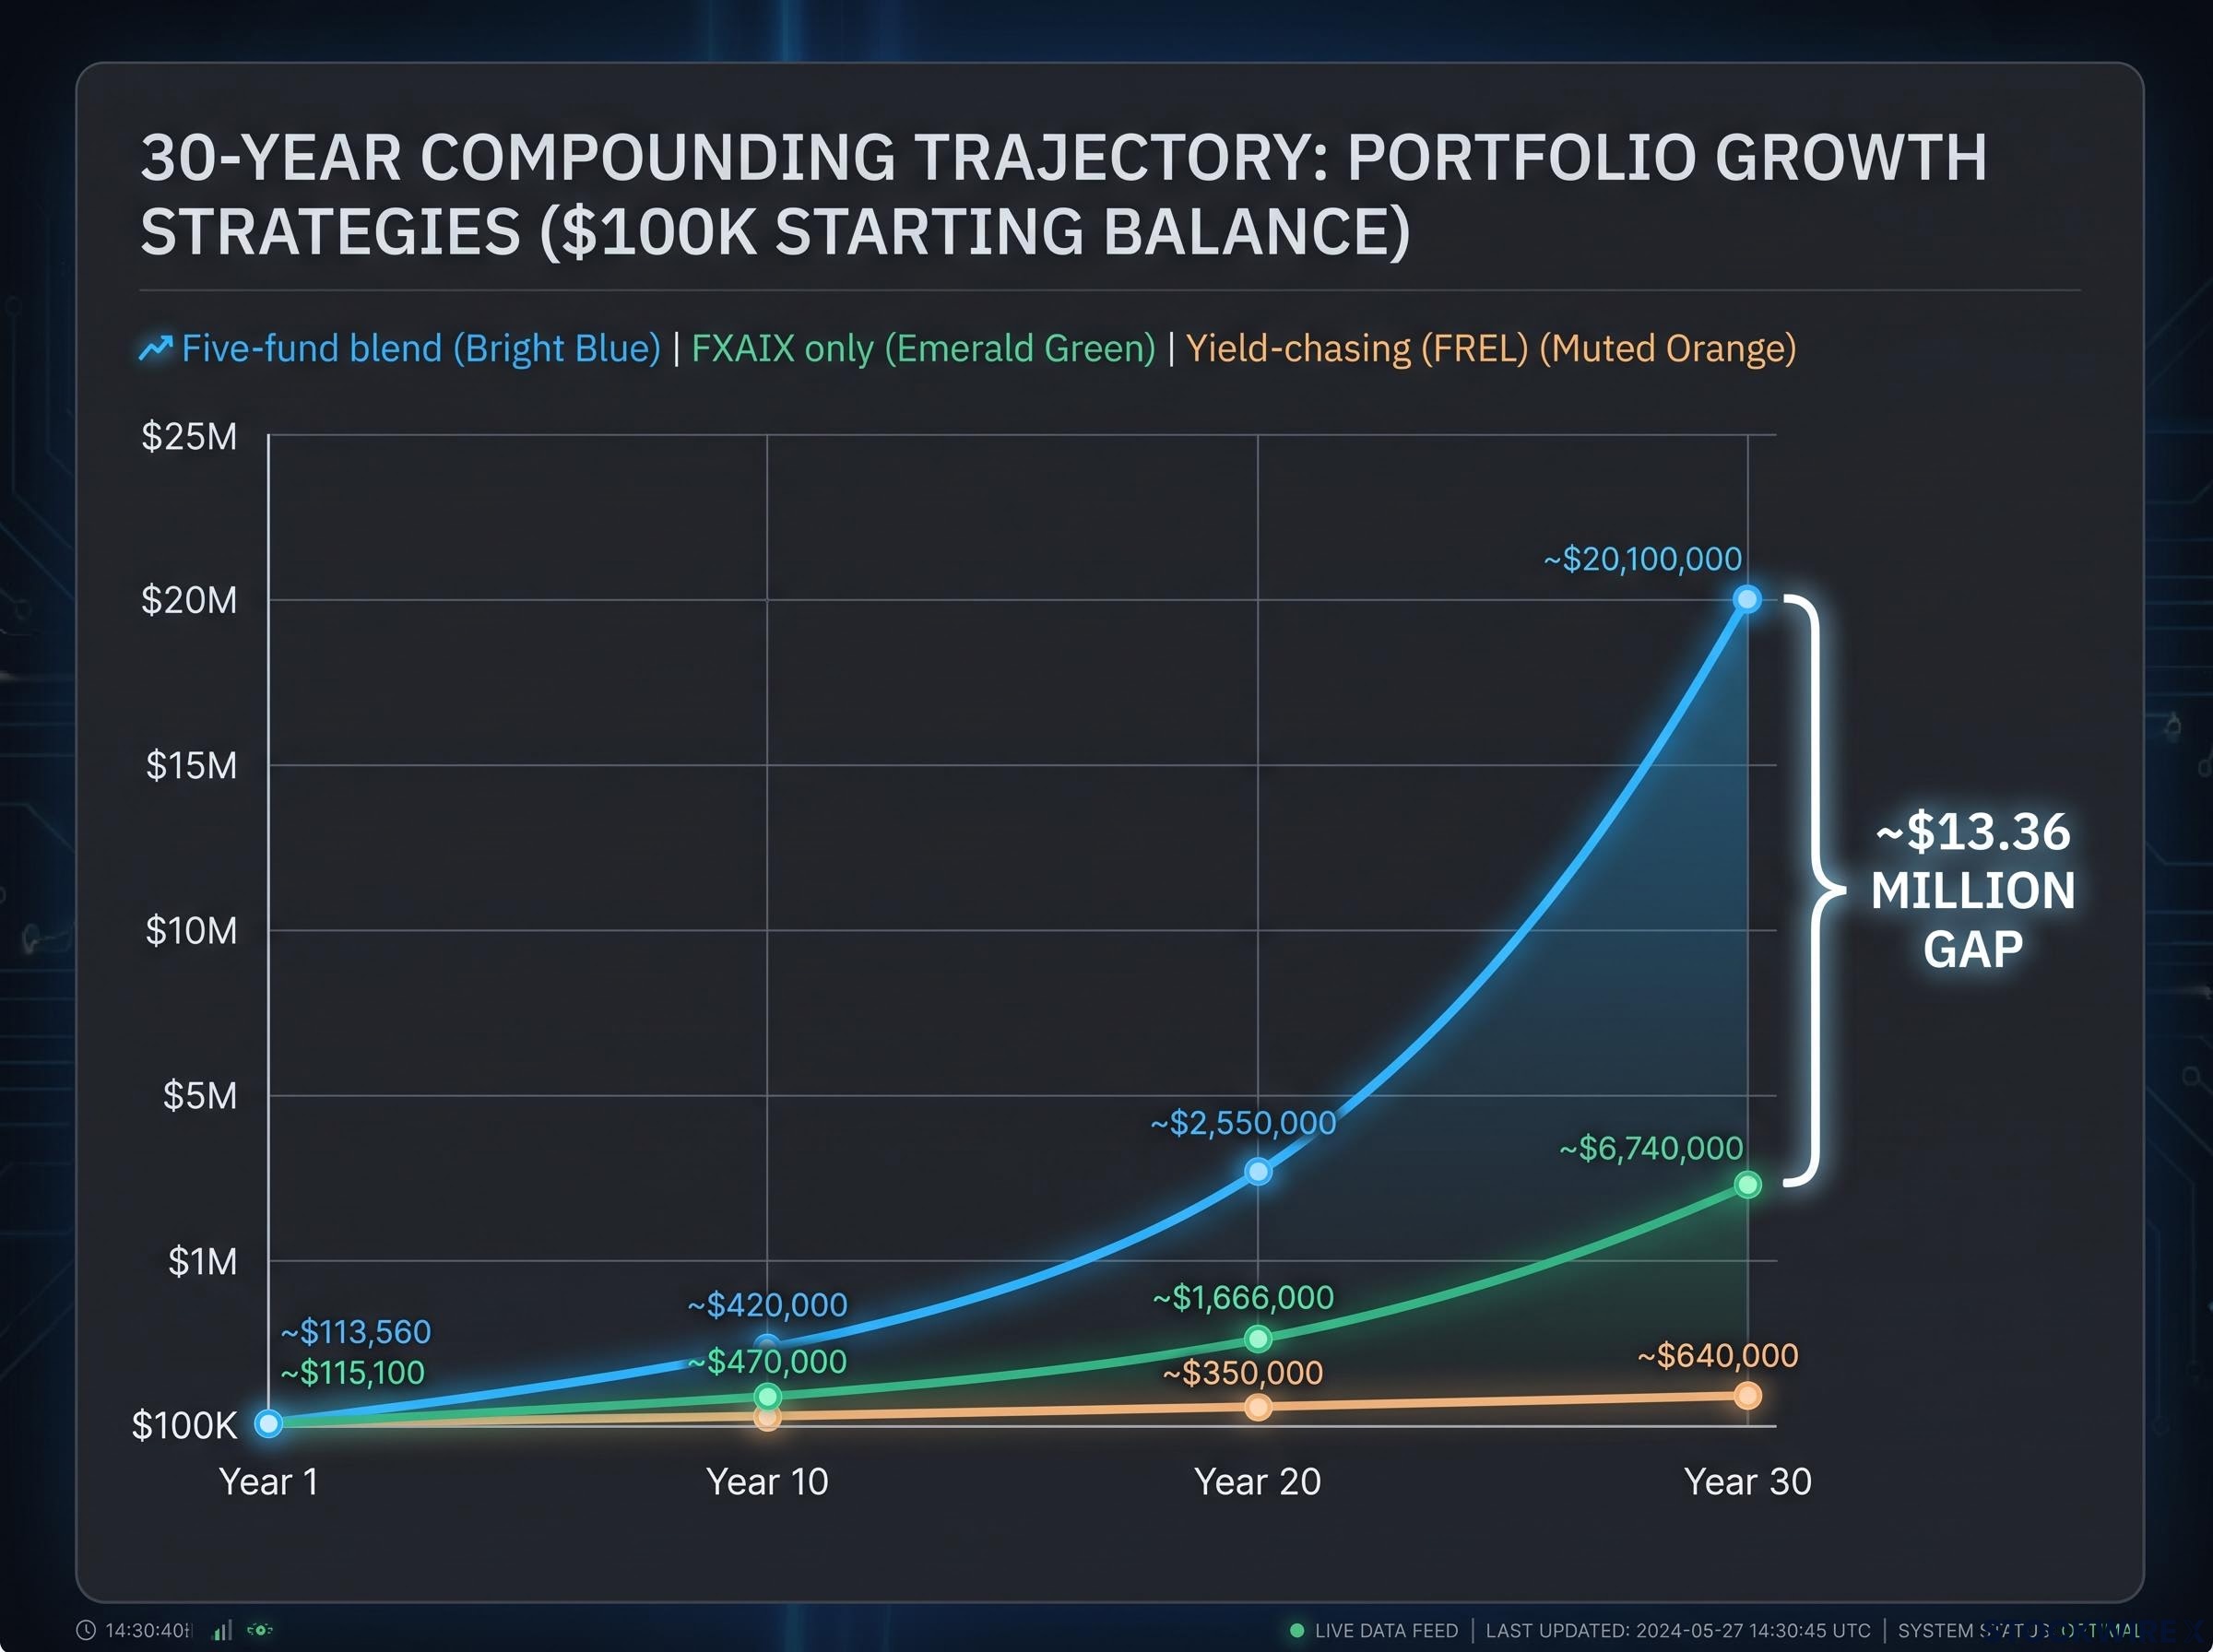
The year 10 deficit is not a signal that the strategy is failing. It is exactly what the model predicts, and an investor who exits at that point has absorbed all of the drawdown risk without waiting long enough to capture any of the long-run upside.
What the yield-chasing comparison reveals
The concentrated REIT position (FREL) finishes at approximately $640,000 after 30 years. In the early years the regular quarterly distributions are visible and feel reassuring, which can make a yield-focused strategy appear more productive than it actually is. The underlying trade-off, however, is stark: high current income structurally limits long-term capital accumulation.
This critique applies specifically to a concentrated REIT-only allocation, not to all income-oriented investing. Balanced strategies that generate income without structurally capping growth potential operate on different mathematics entirely.
Why a “diversified” portfolio had a worse 2022 than the S&P 500
Here is where the conventional assumption breaks. Rather than limiting losses in 2022, the five-fund blend deepened them.
- FXAIX (S&P 500): approximately -18.13%
- FKIDX (international): approximately -23.3%
- Five-fund blended portfolio: approximately -22%
The blend dropped roughly 4 percentage points more than the single-fund alternative in a single calendar year.
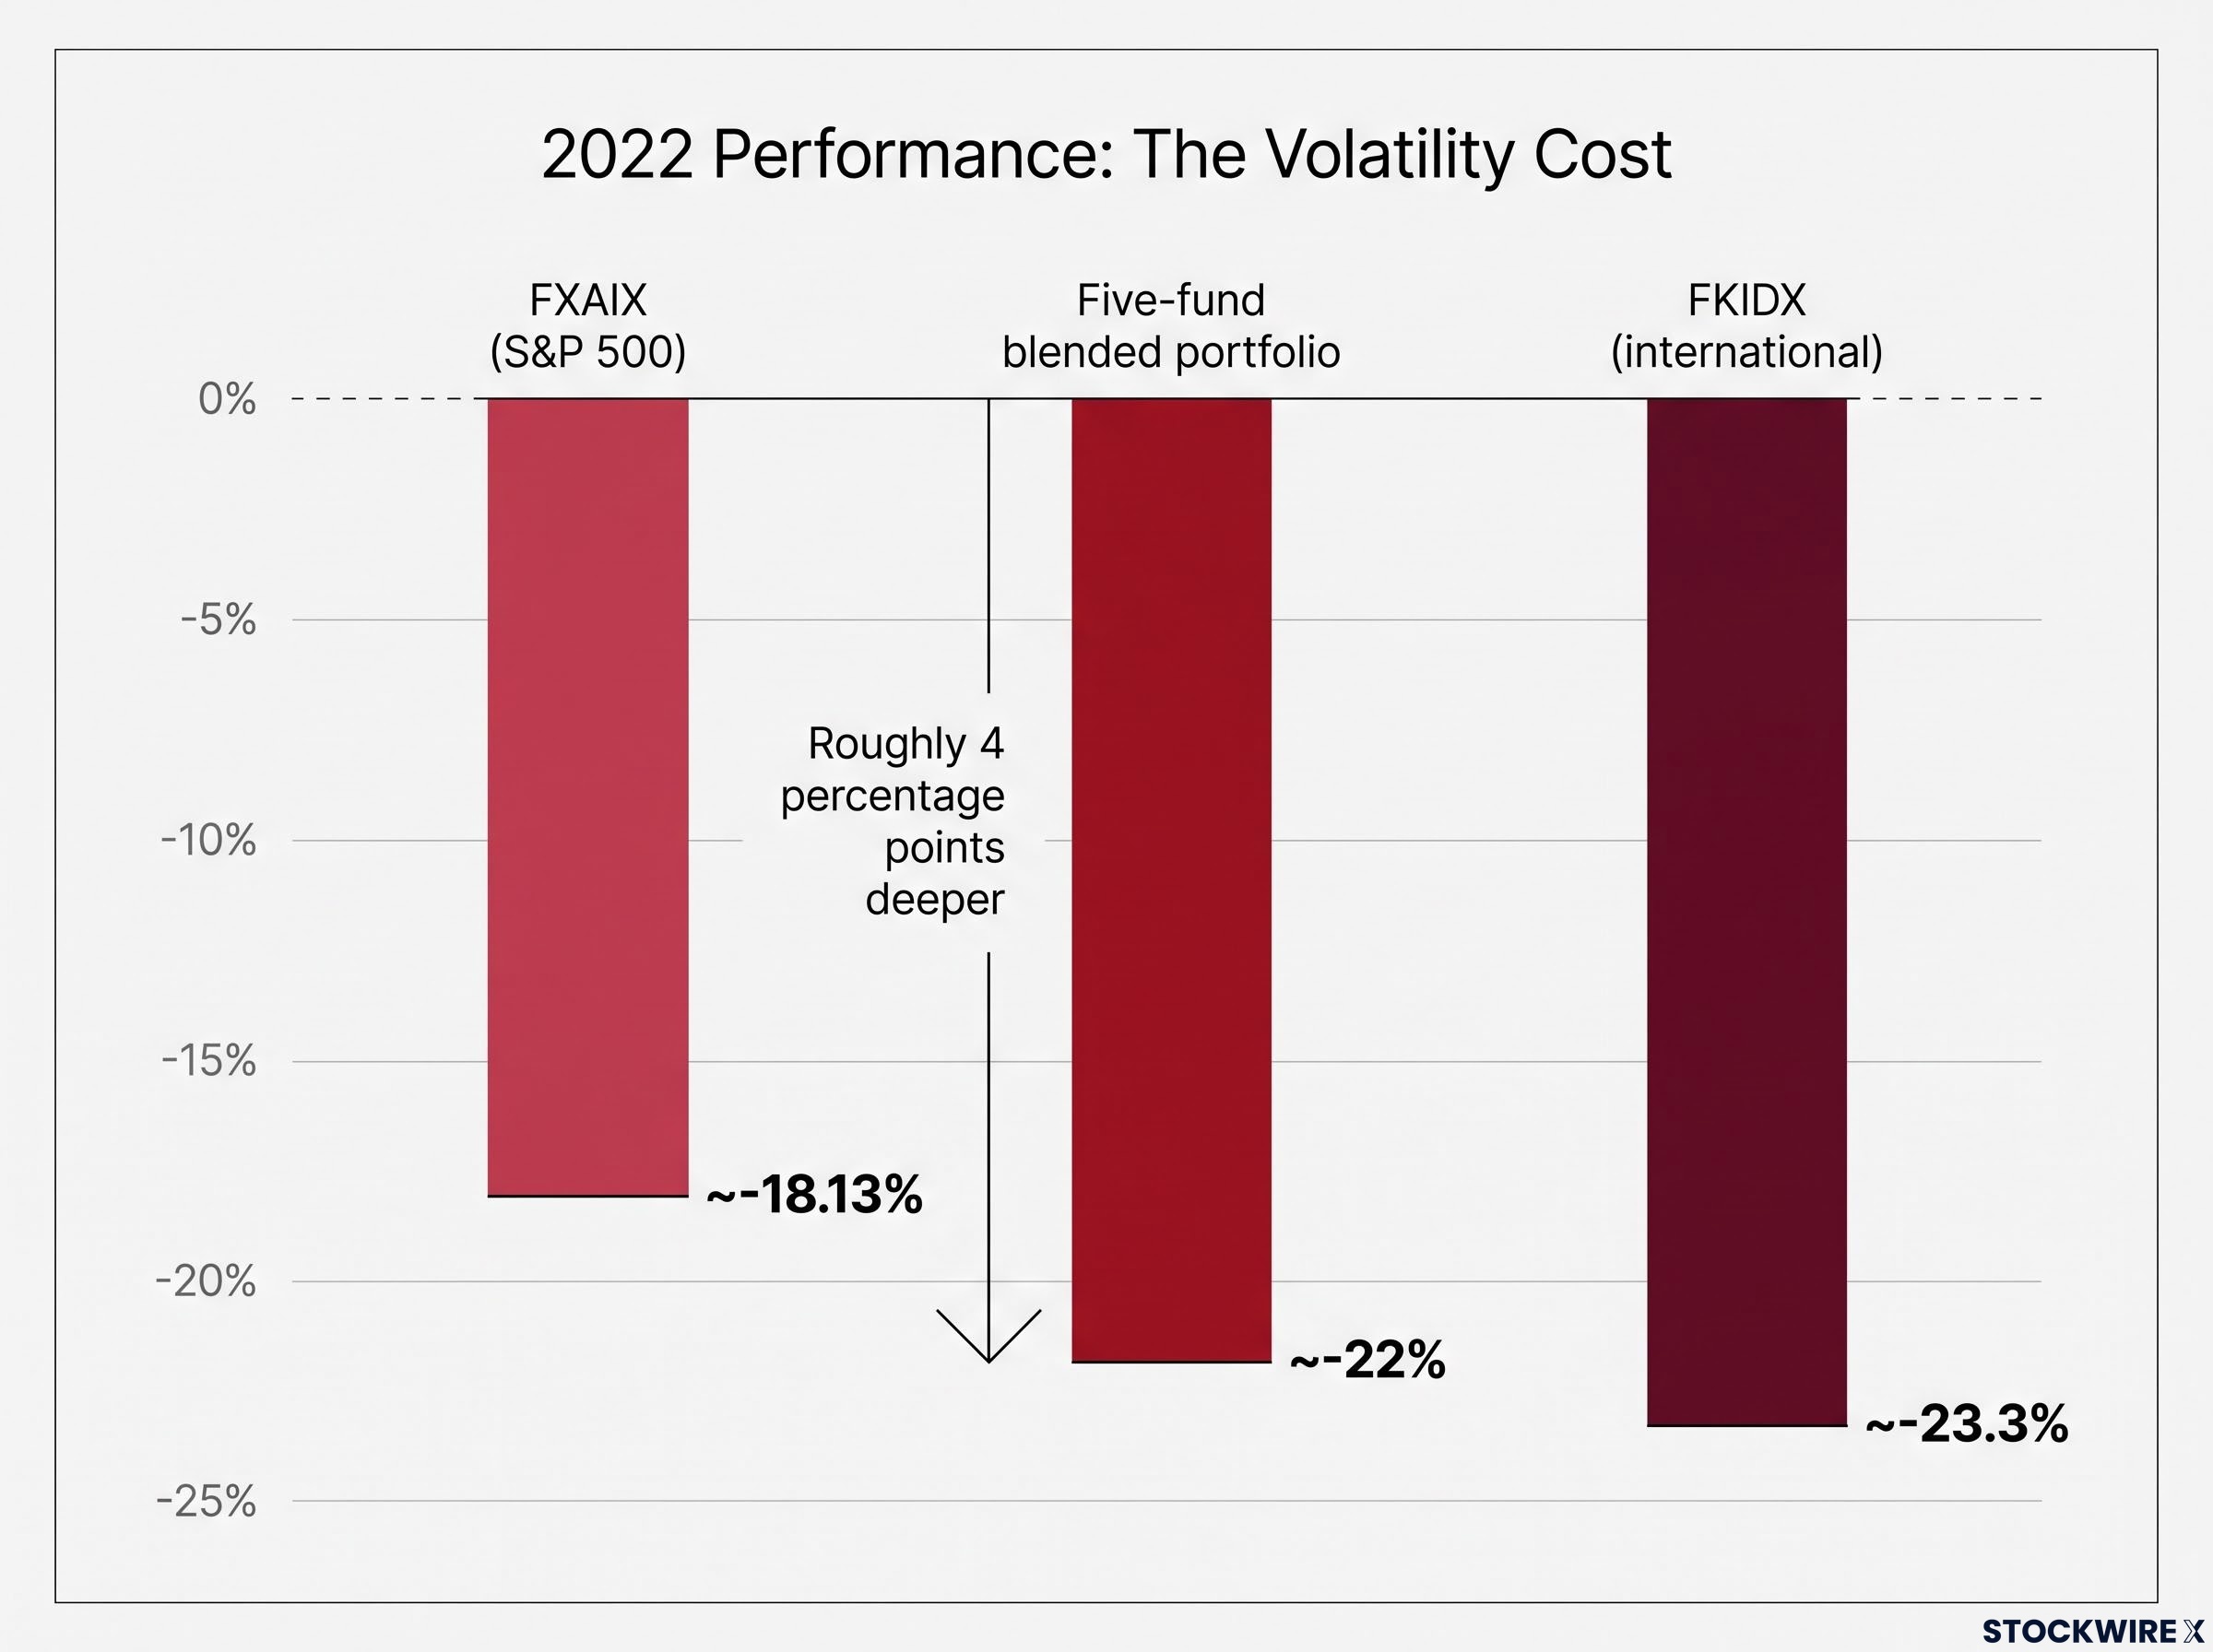
The mechanism is straightforward. Both real estate and technology are acutely sensitive to rising interest rates: real estate because borrowing costs directly affect property valuations, and technology because higher rates compress the present value of long-duration growth expectations. When rates climbed sharply throughout 2022, both sleeves were hit simultaneously. The portfolio’s tilt toward these two sectors meant that the other three positions provided little offsetting effect.
Genuine portfolio diversification, in the Dalio framework, requires each sleeve to carry a correlation below approximately 0.3 with every other position; the 2022 performance data for the five-fund blend, where technology and real estate were hit simultaneously by the same rate shock, illustrates precisely how two sleeves can appear distinct while responding to identical macro drivers.
Holding five funds rather than one did not reduce the pain in 2022; it made the portfolio more exposed to the specific macro conditions driving that year’s losses. The extra volatility is the price of admission to the technology sleeve’s long-run compounding potential, and the 2022 performance is the clearest single-year demonstration of what that price looks like.
If your reason for considering the five-fund structure was a belief that spreading across more funds smooths short-term losses, this data should prompt a reassessment. The question is not whether the strategy can fall harder than FXAIX in a bad year. It already has. The question is whether your risk tolerance matches the actual volatility profile, not just the return ambitions.
The one assumption that controls almost everything
Examine the five-fund projection closely and one number carries almost all the weight: the technology sleeve’s approximately 24% annualised historical return. Remove that figure, or reduce it materially, and the portfolio’s long-run advantage over FXAIX shrinks to something modest or disappears altogether.
The reason lies in how exponential growth behaves at different rates. A 24% annual return and a 15% annual return do not produce outcomes that diverge in a straight line over 30 years; they diverge on a curve that accelerates with each passing decade. Your actual view on whether technology-sector returns can sustain anything close to their recent pace is therefore the central judgment this strategy asks you to make. The remaining sleeves, the international fund, the small-cap position, and the income allocation, are largely secondary to that single variable.
| Tech annualised return assumption | Implication vs. FXAIX over 30 years |
|---|---|
| 24% | Dramatically higher terminal value |
| 20% | Meaningfully higher terminal value |
| 18% | Moderately higher terminal value |
| 15% | Roughly comparable or slightly behind |
At 15%, the technology sleeve compounds at roughly the same rate as FXAIX itself, and the remaining four positions (some of which trail the S&P 500 historically) pull the blend’s total return down to parity or slightly below. At that point, any performance advantage the five-fund structure might have held over FXAIX is gone entirely.
The five-fund structure is a tech-tilted core-satellite strategy. The $13.36 million terminal value gap at year 30 is not a reward for holding multiple funds; it is the output of a single sleeve compounding at a rate that history produced over one particular window and may or may not reproduce going forward.
A data constraint worth flagging directly: the international fund (FTIHX) launched in June 2016 and its return history is shorter than the other four funds in the portfolio, which each have full decade-long records. The return figure used in this model covers only the period from that launch date, which represents a known gap in the projection’s underlying data.
The 24% figure is a mechanical extrapolation from historical data, not a performance forecast. Technology funds have achieved returns at that level during periods shaped by specific macro conditions and valuation dynamics that may not recur. The projection model has no mechanism to account for whether the next three decades will look anything like the last ten.
Technology sector valuations have compressed sharply from the extreme discounts that shaped the last decade’s return window, with MSCI EAFE trading at roughly a 50-55% forward P/E discount to the S&P 500 IT sector, a spread that institutional managers including BlackRock and JPMorgan now treat as a rotation signal rather than a permanent premium.
What it actually costs to hold this strategy for 30 years
Every projection table in this article assumes an investor who holds each position untouched for three full decades and never intervenes. That bears little resemblance to how investing actually unfolds in practice.
The most common point of failure is not choosing the wrong funds at the outset. It is walking away from the structure in year 8 or 12 after watching FXAIX consistently pull ahead, convinced that the original thesis was simply wrong. At year 10, the five-fund portfolio trails by approximately $50,000. That is large enough to feel like a genuine mistake but early enough that the compounding advantage has not yet materialised.
Behavioural barriers to staying invested are well-documented: loss aversion operates in dollar terms rather than percentages, meaning a 10% drawdown on a growing balance produces an absolute paper loss large enough to feel like a meaningful portion of annual income, creating selling pressure at precisely the moment the compounding model requires the investor to hold.
Beyond behavioural pressure, the model ignores real-world frictions that erode the theoretical edge:
- Taxes: Rebalancing in a taxable account triggers capital gains events that compound the drag over decades
- Rebalancing complexity: Five positions require monitoring and periodic adjustment; a single fund does not
- Behavioural tinkering: The temptation to intervene in whichever sleeve is lagging (selling the underperformer, doubling the winner) undermines the structure’s design
- Fund-level changes: Over 30 years, any individual fund could close, shift its mandate, or raise its expense ratio
Sequence-of-returns risk, the impact of the order in which good and bad years arrive, is also absent from the constant-return model. In real investor experience, a bad decade early can produce a materially different terminal value than a bad decade late, especially for anyone making contributions or withdrawals along the way.
Staying invested through the underperformance years is what converts the theoretical terminal value advantage into actual wealth. Exiting during the early deficit period means bearing the full volatility cost while forfeiting the long-run compounding benefit the strategy was designed to deliver.
Who this structure is actually built for
Before committing, three conditions are worth confirming honestly:
- You understand the strategy as a tech-tilted growth bet rather than a diversification play. The 2022 drawdown showed the difference, and you are comfortable with it.
- You are holding in a tax-advantaged account (or a tax-efficient structure) where rebalancing and capital gains do not erode the compounding edge.
- You have a genuine 20-30 year horizon with no anticipated need for major withdrawals, meaning you can absorb multi-year stretches of trailing the S&P 500 without losing conviction.
These are your own checklist items, not prescriptive advice. The strategy demands a specific type of investor, and the projection only rewards those who match the profile.
What the data settles and what it leaves open
The 30-year projections establish one finding clearly: a five-fund structure with a meaningful technology tilt can plausibly produce a dramatically larger terminal value than FXAIX alone ($20.1 million versus $6.74 million), and the yield-chasing alternative ($640,000) underperforms both on a total-return basis. The mathematics of compounding at different rates across three decades are not in dispute.
The projections cannot determine whether the macro and valuation conditions that produced those historical returns will carry forward. The technology sleeve’s 24% annualised figure reflects an unusually strong period for the sector, and as that assumed rate declines toward 15%, the performance gap between the five-fund blend and FXAIX narrows toward rough equivalence. The 2022 drawdown, where the blend fell approximately 22% versus FXAIX’s 18%, is the concrete cost of the trade in a single difficult year.
No model can answer the most consequential question either: whether you will stay in the position when it is losing ground to a simpler alternative. The year 10 deficit, the 2022-style drawdowns, the sustained periods where a single S&P 500 fund quietly outperforms the more complex structure; these are the moments that determine whether the theoretical advantage converts to actual wealth.
Whether the projected terminal value ever becomes real money depends entirely on your ability to remain invested through the years when the strategy looks like a mistake. That is not something a projection table can tell you.
This article is for informational purposes only and should not be considered financial advice. Investors should conduct their own research and consult with financial professionals before making investment decisions. Past performance does not guarantee future results. Financial projections are subject to market conditions and various risk factors.