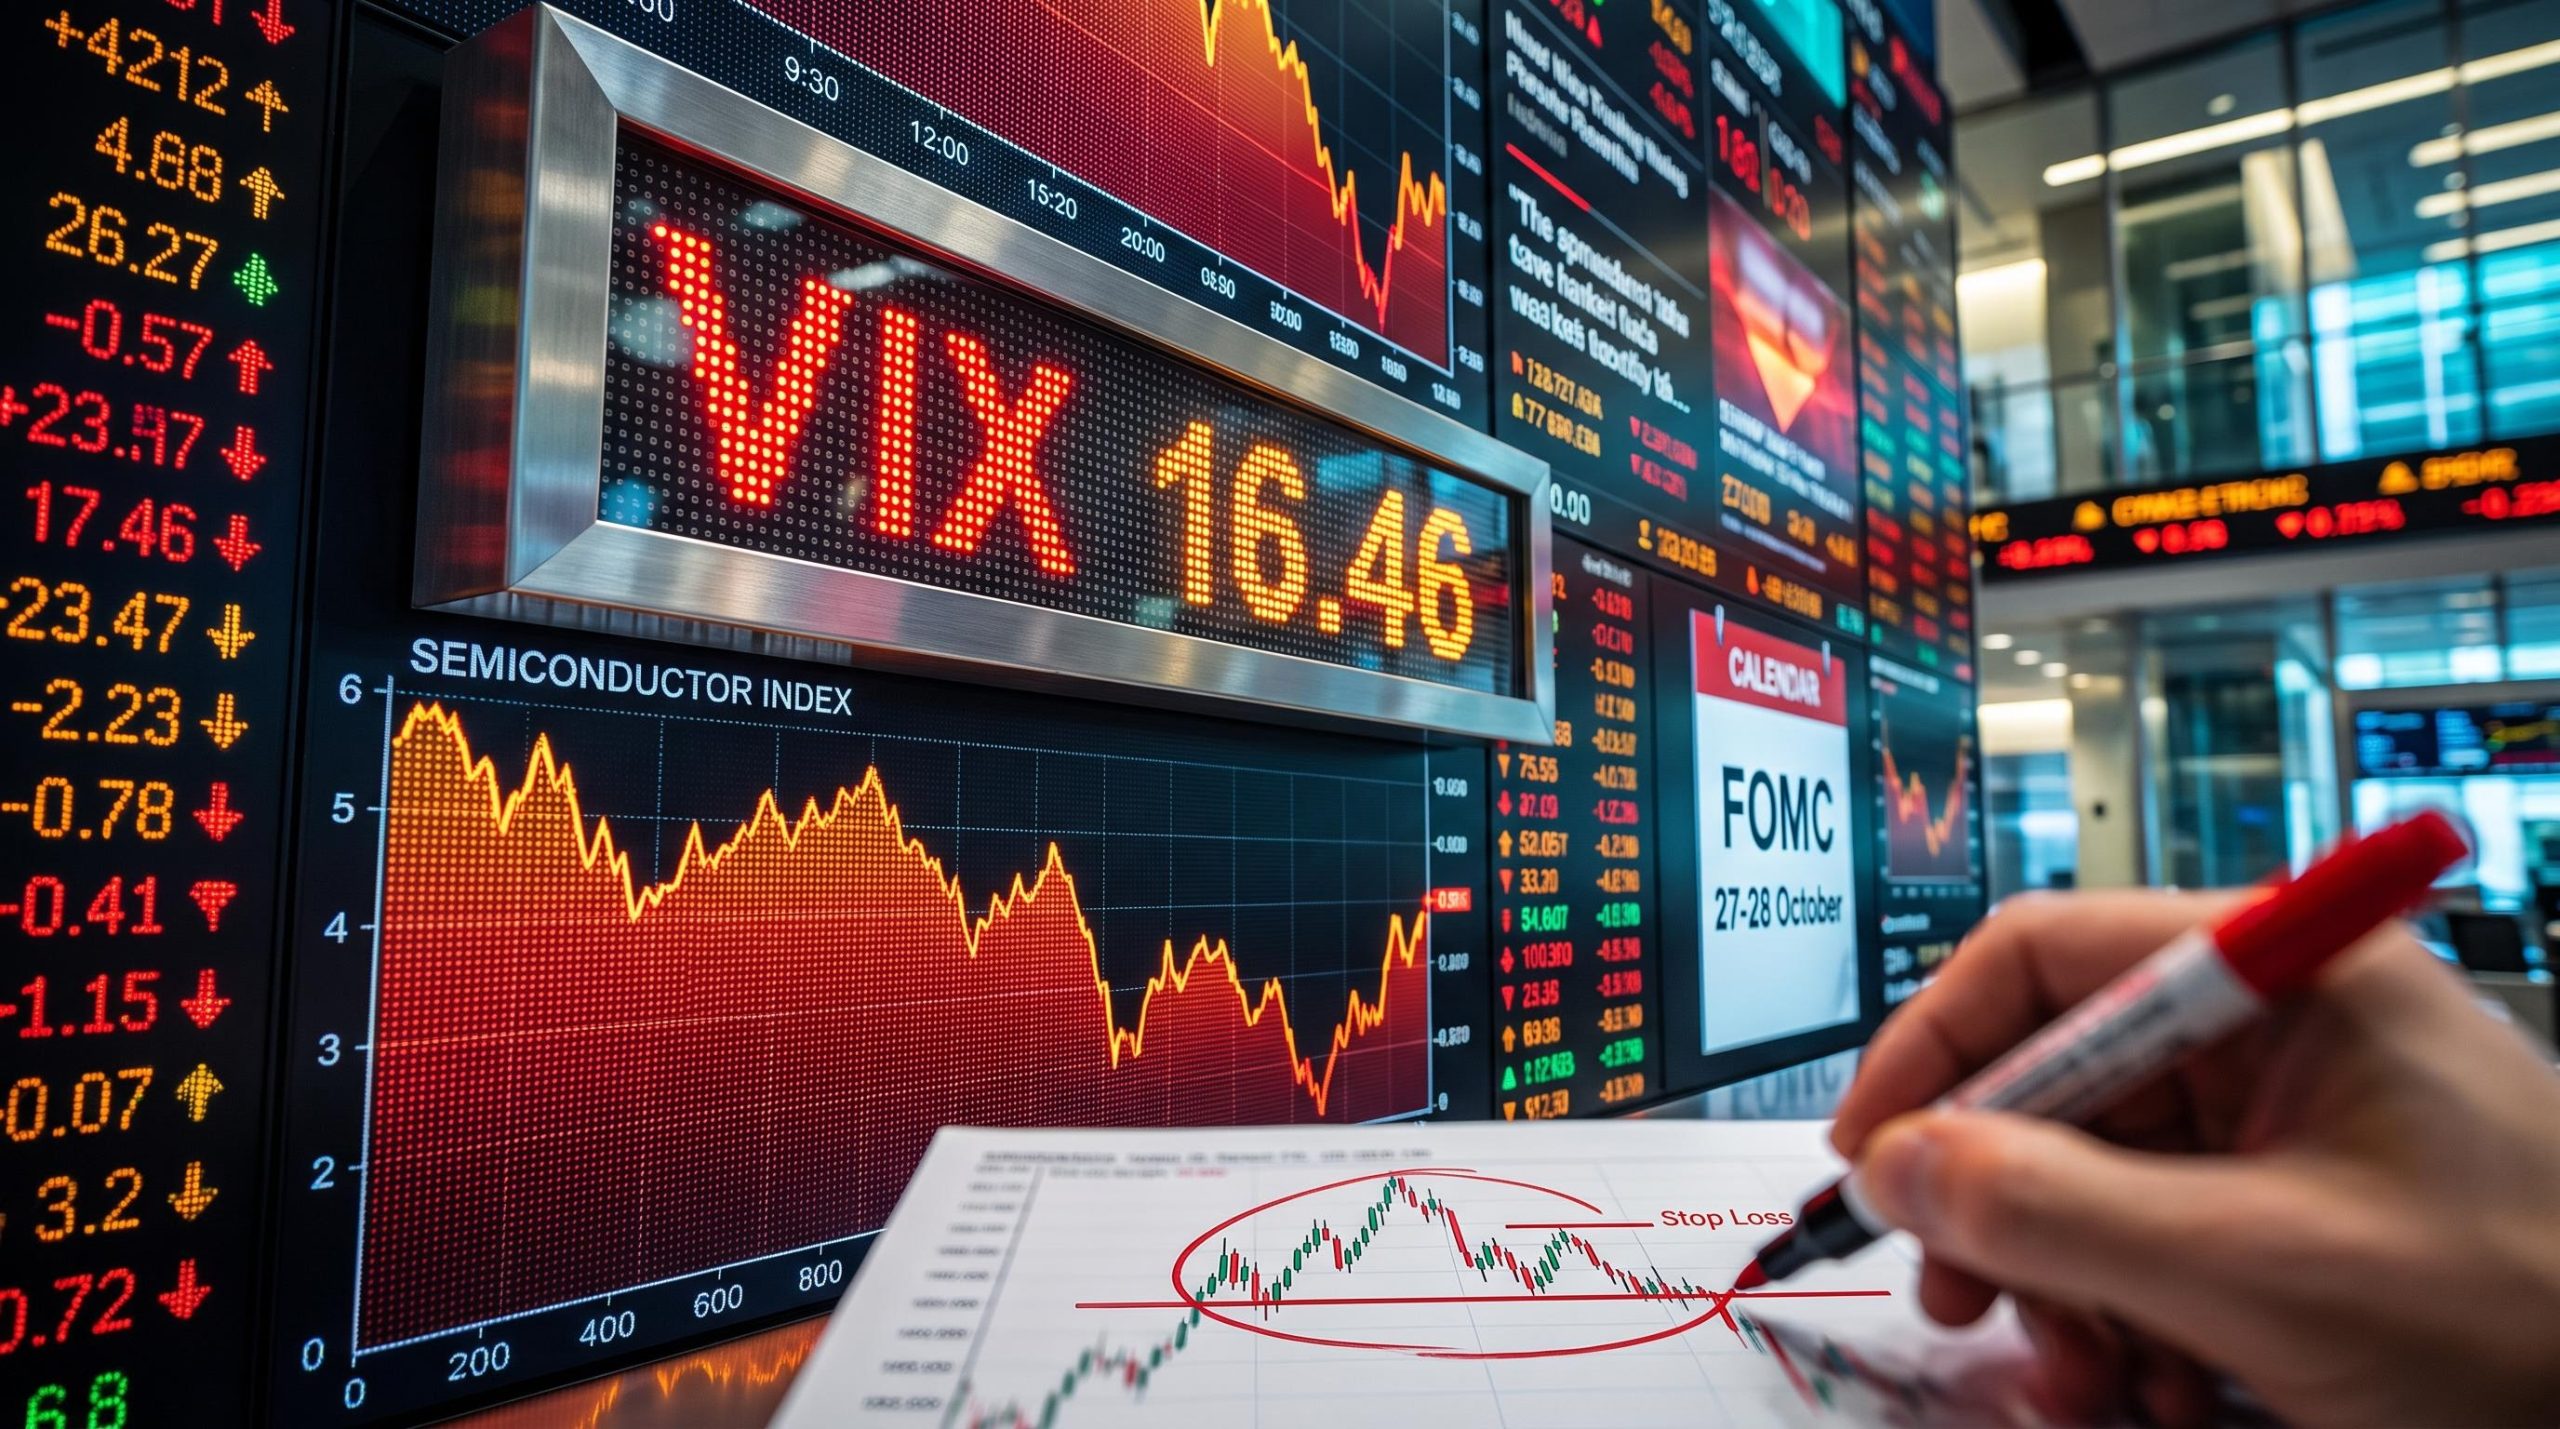
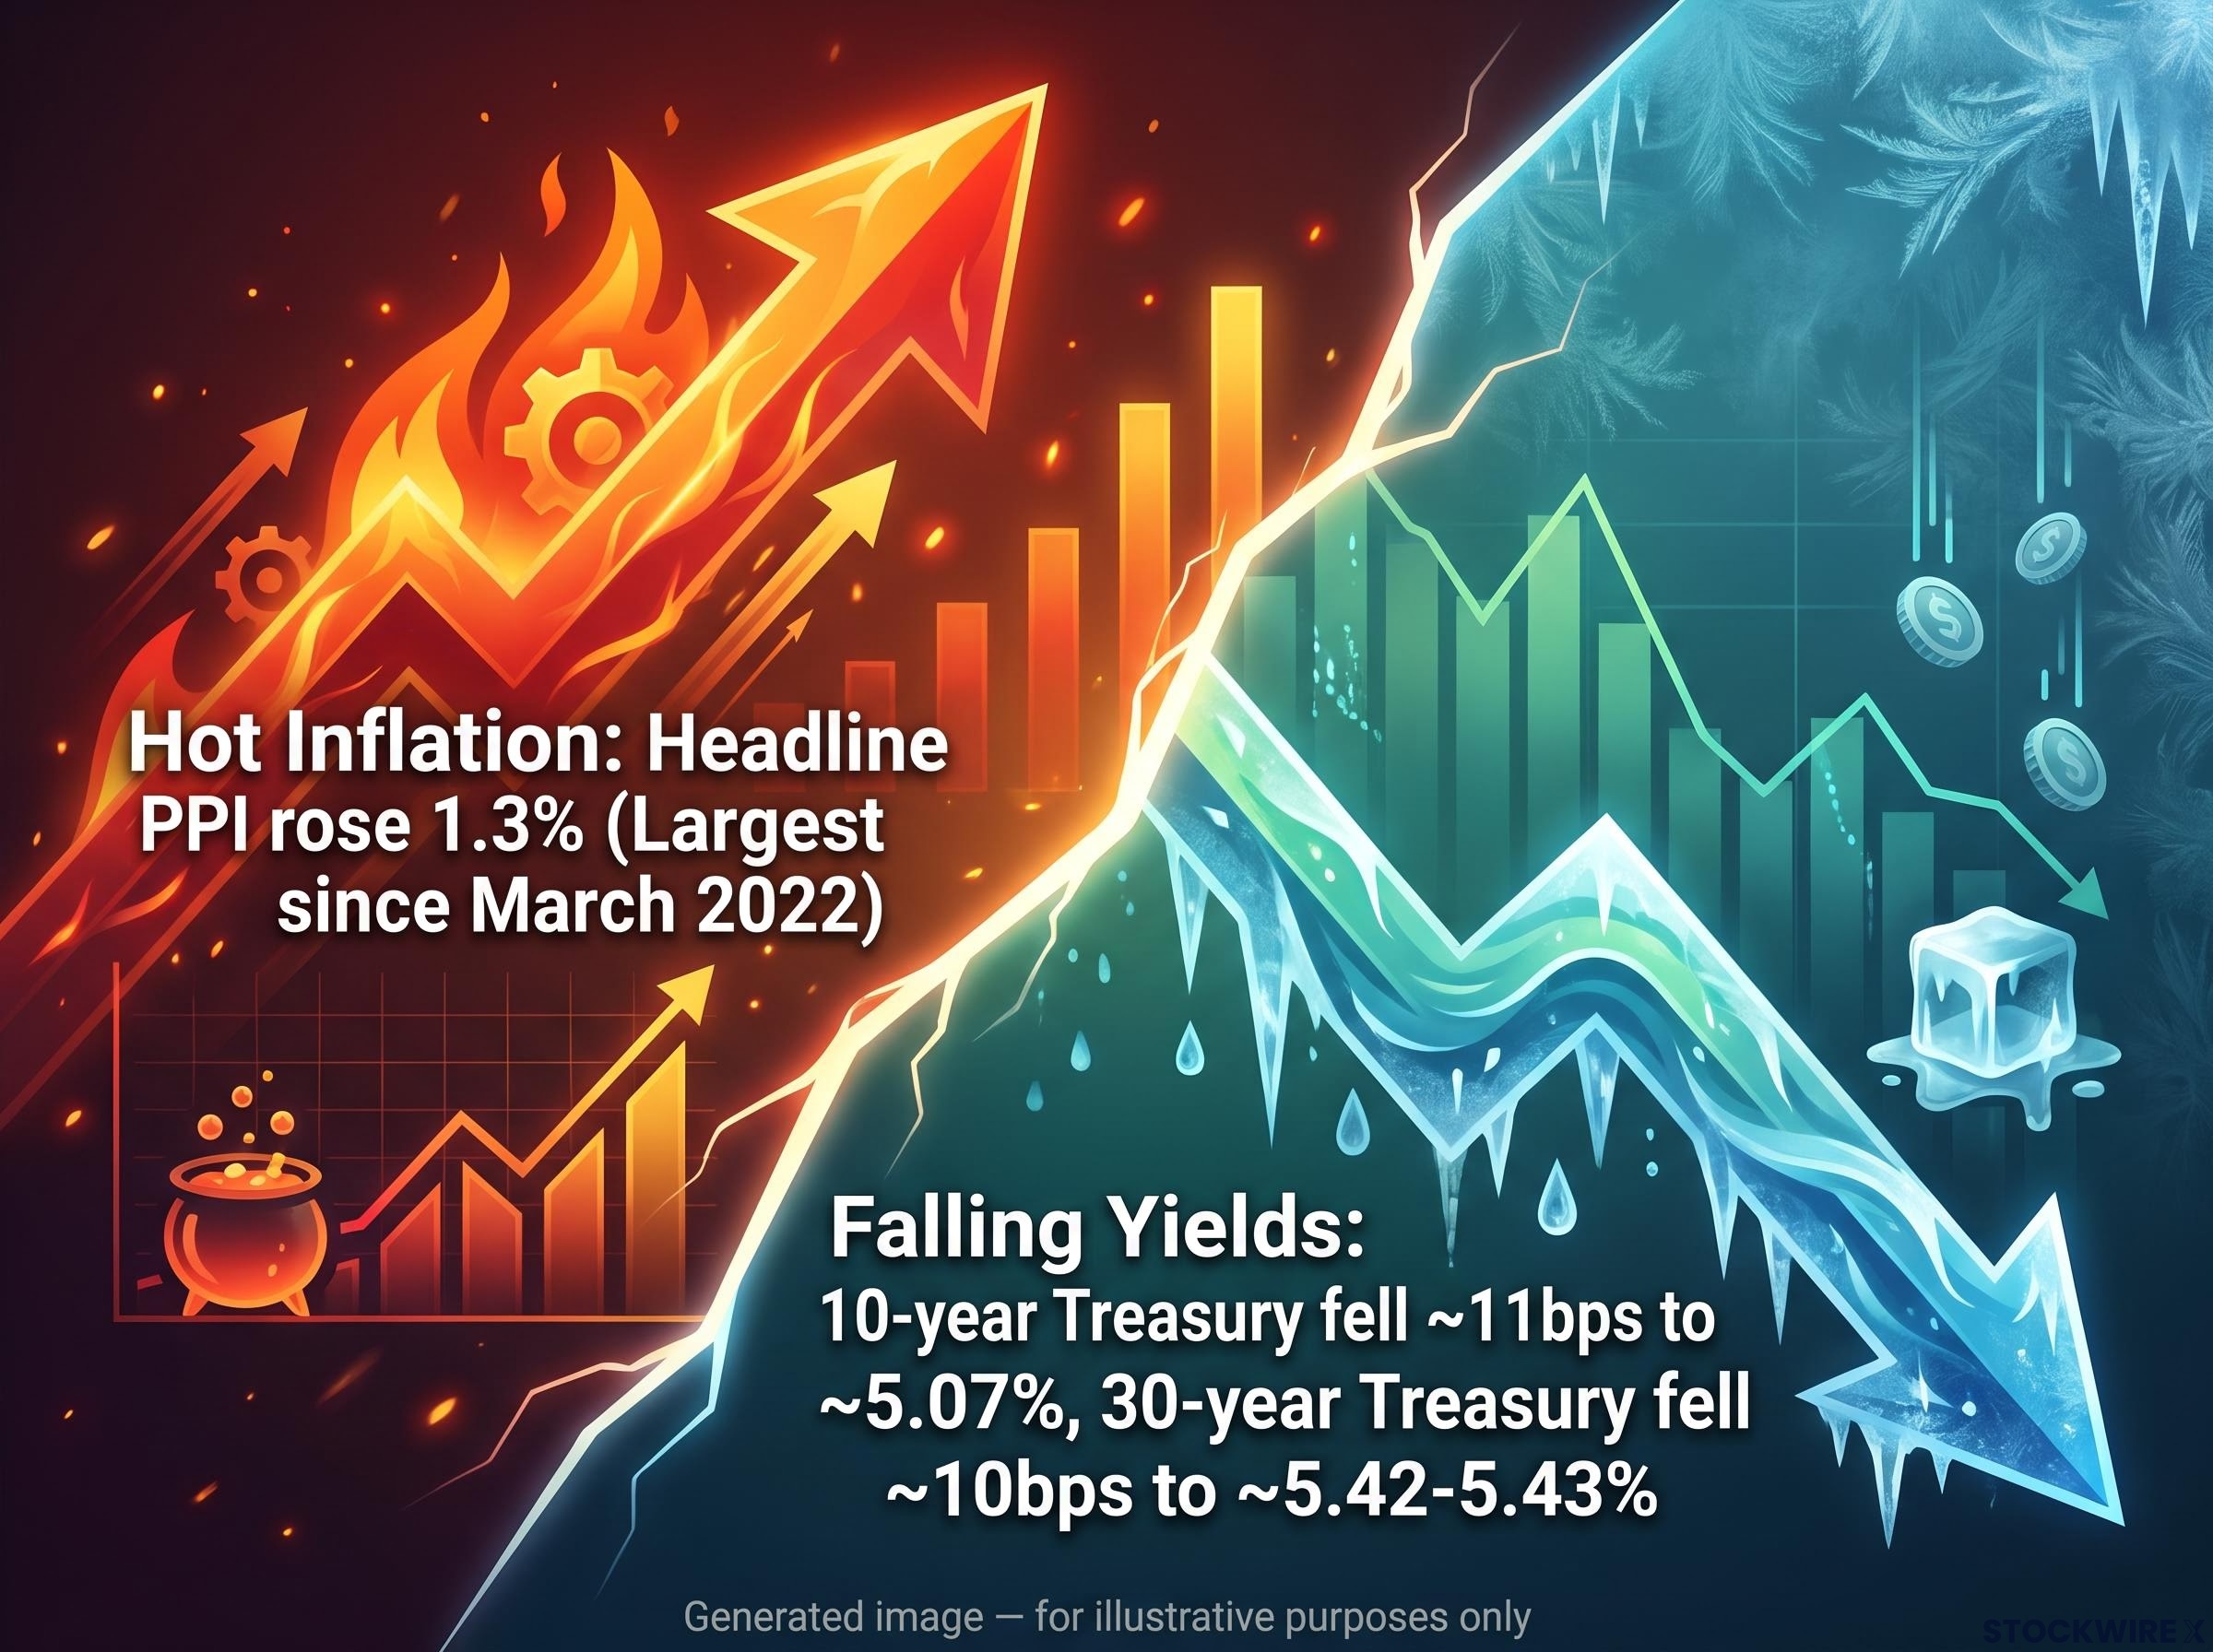
Producer prices just posted their biggest monthly jump since March 2022, rising 1.3% in September. The obvious reaction would be higher bond yields, since hot inflation usually means the market prices in more Fed rate hikes. Instead, the 10-year Treasury yield fell about 11 basis points to roughly 5.07% on Thursday.
That gap between the data and the market’s reaction is the story. The Federal Reserve meets on 27-28 October, and Chair Kevin Warsh speaks on 16 October. Right now, the inflation data and the bond market are pointing in different directions.
If you hold bonds, rate-sensitive stocks or cash, you need to know which signal to trust.
Here is why long yields fell on hot data, how the odds of an October move compare with a December move, and the scenarios that should shape how you think about rates-sensitive positions over the coming weeks.
What did the September PPI report actually show?
The Producer Price Index (PPI) measures the prices businesses receive for the goods and services they sell. It tracks inflation at the wholesale level, before costs reach shoppers.
The September headline was a shock. PPI rose 1.3% for the month, against a Reuters economist forecast of about 0.5%, and rose a reported 6.3% from a year earlier. All four PPI readings beat every forecast in a Bloomberg survey.
| Measure | September result | Comparison |
|---|---|---|
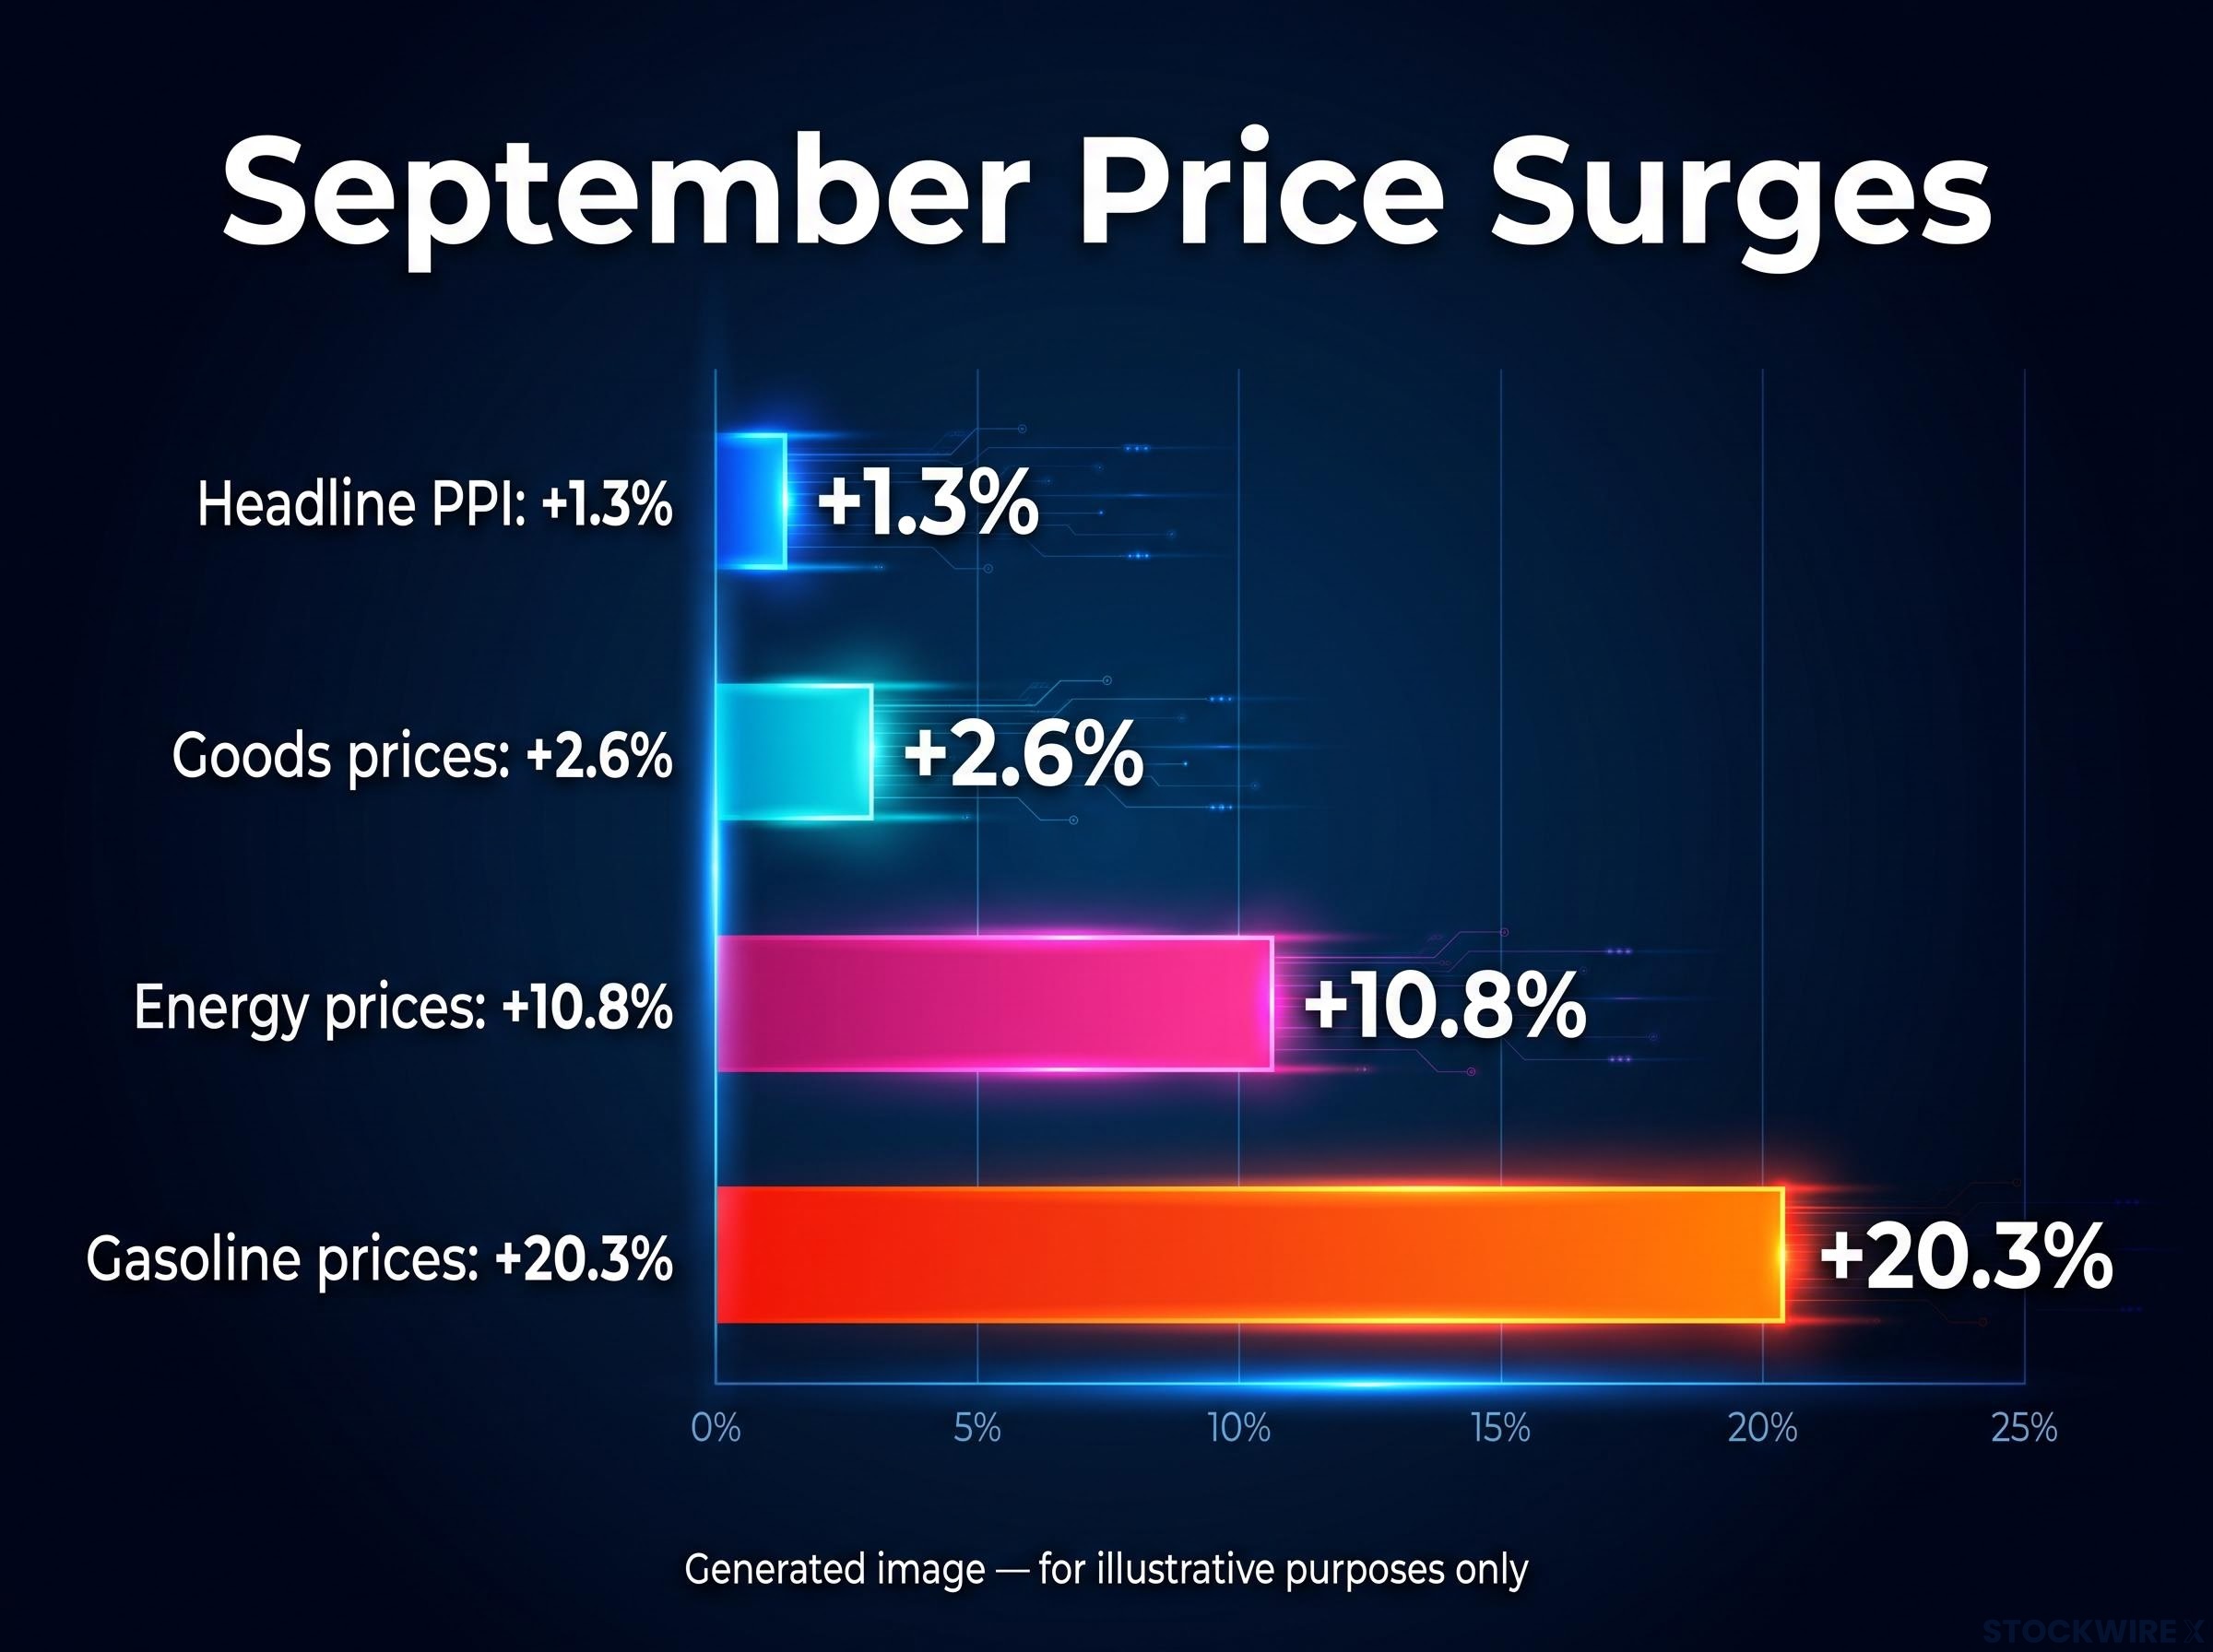
| Headline PPI, monthly | +1.3% | Largest since March 2022; forecast about +0.5% |
| Core PPI, monthly | +0.7% | Reported forecast roughly +0.3% |
| Goods prices, monthly | +2.6% | Most since series began in December 2009 |
| Energy prices, monthly | +10.8% | More than 80% of the goods increase |
| Gasoline prices, monthly | +20.3% | Roughly half the rise in final-demand goods |
Energy clearly drove the spike. Gasoline alone jumped 20.3% in a single month.
The core reading is what matters more for you. Core PPI strips out food, energy and trade services, and Bloomberg reported it rose 0.7%. A narrower gauge cited elsewhere showed 0.5%, so check which measure a source is quoting. Either way, 0.7% suggests the shock may be spreading beyond fuel into wider pricing. That spread is what separates a one-off spike from a problem the Fed has to respond to.
Mizuho’s view Alex Pelle of Mizuho said the data give the Fed little reason to hesitate on hikes.
Why the retail sales data adds a caution flag
The Census Bureau’s retail sales report, released the same day, looked strong on the surface. Sales rose 0.8% against a consensus of about 0.3%.
Look underneath and the picture weakens. Gasoline-station receipts accounted for about 71% of the monthly increase, with station sales up 6.4% on Census figures. The control group, a measure that strips out volatile categories and feeds into GDP, rose just 0.1% against an expected 0.3%.
That combination raises the risk of stagflation, where prices keep rising while growth slows. Higher fuel bills are eating into what households can spend on everything else.
Rising oil prices have already revived stagflation fears, because a Fed that cannot cut to support slowing growth without risking entrenched inflation has few good options when fuel costs squeeze household spending.
When big ASX news breaks, our subscribers know first
Why do Treasury yields fall when inflation runs hot?
On screen, Thursday looked contradictory. The inflation numbers flashed red, yet the 10-year yield dropped about 11bps to somewhere between 5.07% and 5.11% (sources vary because the session moved fast). The 30-year fell about 10bps to roughly 5.42-5.43%, and is now down about 25bps over five sessions.
The answer lies in what else happened that day. An AI-stock sell-off sent investors out of technology shares and into government bonds, which are treated as a safe haven. That buying pushed bond prices up and yields down.
Because the coupon is fixed, a higher bond price mechanically compresses the yield, which is why safe-haven buying explains how bond yields move even on a day when inflation data looks alarming for your holdings.
Four forces were acting on long-dated yields at once:
- Safe-haven demand: money leaving AI and tech stocks flowed into long Treasuries.
- Growth and credit worries: a disorderly equity decline tightens financial conditions, meaning credit becomes harder and costlier to get, which weakens growth expectations and pulls long-term real yields lower.
- Lower October hike odds: expectations shifting toward a December move limited upward pressure on the long end.
- Term premium: this is the extra yield investors demand for holding longer bonds. DZ Bank analysts, cited by Morningstar on 13 October, put the 10-year term premium at about 91 basis points, the highest since 2014, so much risk was already priced in.
BNY’s read BNY Chief Executive Officer Robin Vince argued in Reuters coverage that a 10-year yield near 5.25% is not historically extraordinary, and that the retreat reflected safe-haven buying rather than a sign that long-term inflation risk had gone away.
How the front end and long end read the same data differently
The two-year yield mostly tracks where traders expect Fed policy to go. It reacts directly to inflation data because inflation drives rate decisions.
The 10- and 30-year yields carry more baggage: growth expectations, government bond supply, foreign demand and the term premium. On Thursday, those long-end forces outweighed the inflation signal.
So the fall in long yields tells you the market weighted growth and market-stress risk more heavily than near-term inflation. A lower yield today is not proof that inflation worries are over. Treat it as a positioning event, not an all-clear.
Is an October rate hike still on the table?
Here is the counterintuitive part. After the hottest PPI print in more than four years, the odds of an October hike fell.
According to CME FedWatch, October hike odds dropped below 30%, with an Exante snapshot showing 27.1%. CNBC reported odds briefly spiked to 53.7% right after the data before sliding back. The odds of at least one hike by December sit much higher, though sources disagree: CME FedWatch showed 91%, while Exante’s snapshot showed 86.3%.
Reuters reported that most economists still expect a hold in October and a hike in December, though the October call has become closer. That gap tells you the market expects a hike but is giving the Fed time to gather evidence.
Futures-implied hike odds can swing by 20 percentage points on a single Fed speech, so you should treat any snapshot, whether 27% or 54%, as a fragile reading rather than a settled forecast.
The energy shock is the reason the debate is so live. Iran has intensified attacks on shipping in the Strait of Hormuz, keeping Brent near $105 and WTI settling at $97.55. US crude inventories fell by more than 8 million barrels. The shock travels through the economy in stages:
- Hormuz disruption reduces the capacity to move oil and fuel.
- Freight, insurance and delivery costs rise, lifting crude and gasoline prices.
- Producers face higher fuel, transport, electricity and input costs.
- Some costs pass into wholesale prices, as seen in the 10.8% energy and 20.3% gasoline PPI rises.
- Retail gasoline and transport costs push headline consumer inflation up first.
- If the shock persists, firms pass logistics, materials and wage costs into core goods and services.
Duration is the key question. The Dallas Fed’s model estimates that a Hormuz closure lasting one, two or three quarters would add about 0.35, 0.79 and 1.47 percentage points to Q4/Q4 headline PCE inflation, the Fed’s preferred price gauge.
Fed officials are split on tone. Chicago Fed President Austan Goolsbee said the Fed may need to treat the shock as potentially persistent, Governor Lisa Cook said recent supply shocks proved surprisingly persistent, and Kansas City Fed President Jeff Schmid called the inflation implications difficult to assess.
| Case for an October hike | Case for holding |
|---|---|
| Headline PPI up 1.3% monthly, a reported 6.3% annually | Energy dominated the PPI increase |
| Core PPI up 0.7%, suggesting broader pressure | Retail control group rose only 0.1% |
| Oil and gasoline prices remain elevated | Gasoline and crude could reverse; producer-to-consumer lags |
| Fed officials warn supply shocks may persist | AI sell-off already tightening financial conditions |
History cuts both ways. In 2022, the Fed first called inflation transitory, then tightened aggressively as it spread into rents, wages and services. The 1970s showed how oil shocks can entrench when wages chase prices, though today’s policy credibility and energy production differ.
Reading the Fed’s likely calendar
- 16 October: Warsh speaks with the IMF’s Kristalina Georgieva in Bangkok.
- 27-28 October: FOMC meeting and decision.
- December: the meeting markets currently see as the most likely hike point.
The Fed can afford to wait for more data. That means the next CPI, PCE and wage figures, plus Warsh’s tone, are what could pull the date forward.
How should investors position for rates and inflation uncertainty?
The useful frame here is scenarios, not forecasts. The PPI raised near-term inflation risk; the AI sell-off raised longer-term growth and market-stress risk. Which one dominates depends largely on how long energy prices stay high.
| Scenario | Likely market pattern | Practical framework |
|---|---|---|
| Temporary disruption, October hold | Front end volatile; long Treasuries supported | High-quality duration selectively; do not assume the yield drop is permanent |
| Persistent oil shock, December hike or more | Short and intermediate yields rise; curve may flatten or invert | Lean toward short-duration or floating-rate exposure |
| Stagflation | Bonds and equities both pressured; commodities outperform | Inflation-linked bonds, commodities, pricing-power companies |
| AI-led growth shock | Long yields fall; Treasury demand rises | Duration as a hedge, sized for inflation volatility |
| Inflation broadens beyond energy | Bearish for nominal bonds and rate-sensitive equities | Wait for core and services confirmation |
| Energy prices reverse | Headline inflation falls; Fed can delay | Add duration gradually |
Stagflation and an AI-led growth shock are the two outcomes that break the normal relationship between bonds and stocks. Cross-asset moves already show the strain: gold rose 1.59% to US$4,170.81, while copper fell about 0.8% to US$6.61/lb, a split between fear hedging and growth doubts.
A caveat on PPI PPI is not a one-for-one forecast of consumer inflation. Energy passes through quickly, producer-service costs can take months, and some increases are absorbed in company margins.
That is why the yield drop is a reason for you to stay flexible, not a signal to lock in long duration. Watch these indicators to see which scenario is taking hold:
- Core CPI: whether consumer prices outside energy are accelerating.
- Core PCE: the Fed’s preferred measure of underlying inflation.
- Wages: whether pay growth starts chasing higher prices.
- Energy prices: whether Brent and gasoline reverse or hold.
This is general information to help you think through scenarios, not personal financial advice. Past performance does not guarantee future results, and projections are subject to market conditions and various risk factors.
What the bond rally changes, and what it does not
Thursday delivered two shocks at once. The PPI report raised near-term inflation risk, while the AI sell-off raised growth and market-stress risk. Long yields fell because the market weighted the second more heavily on the day.
What has not changed is the underlying direction. Markets still price a December tightening far above the October odds, so the path for Fed rate hikes has been delayed, not removed.
Three checkpoints will decide which scenario is playing out: Warsh’s 16 October remarks, the 27-28 October FOMC decision, and the next CPI and PCE prints. Until those arrive, your decision is less about predicting the Fed and more about holding positions that can survive either outcome.
Investors exploring where duration risk sits should read our dedicated guide to rate-sensitive assets, which shows how TLT, IEF, LQD and XLU react together.
This article is for informational purposes only and should not be considered financial advice. Investors should conduct their own research and consult with financial professionals before making investment decisions.