Pricing for a September rate move has dropped to around 30%, a sharp retreat from the consensus expectation of a certain hike just a few weeks ago. The repricing has been fast, directional, and driven by data rather than speculation.
The timing makes it volatile. The Jackson Hole Economic Policy Symposium opens August 27-29, and Fed Chair Powell will speak into a market that has already placed a strong bet on a pause. Meanwhile, the 10-year Treasury yield closed at 4.68% on 14 August, sitting just beneath the 4.74% level that analysts have flagged as technically significant, even as equities push higher in a way that treats elevated borrowing costs as an abstraction. The bond market and equity market are telling different stories, and that tension has not been resolved.
Here is what you need to understand before Jackson Hole arrives and before the market narrative can reprice sharply again in either direction: the data that moved the odds, the bond-equity tension that makes the stakes unusually high, and the three ways this could resolve.
How July’s inflation data knocked the September hike off its pedestal
The repricing happened in stages, and the speed tells you as much as the direction.
- Fully priced: Several weeks ago, a September rate hike was the consensus expectation
- 67%: Earlier in the summer, conviction began to soften
- 50%: Following the most recent FOMC meeting, odds dropped further
- Approximately 30%: After the July CPI release, September fell to a one-in-three chance
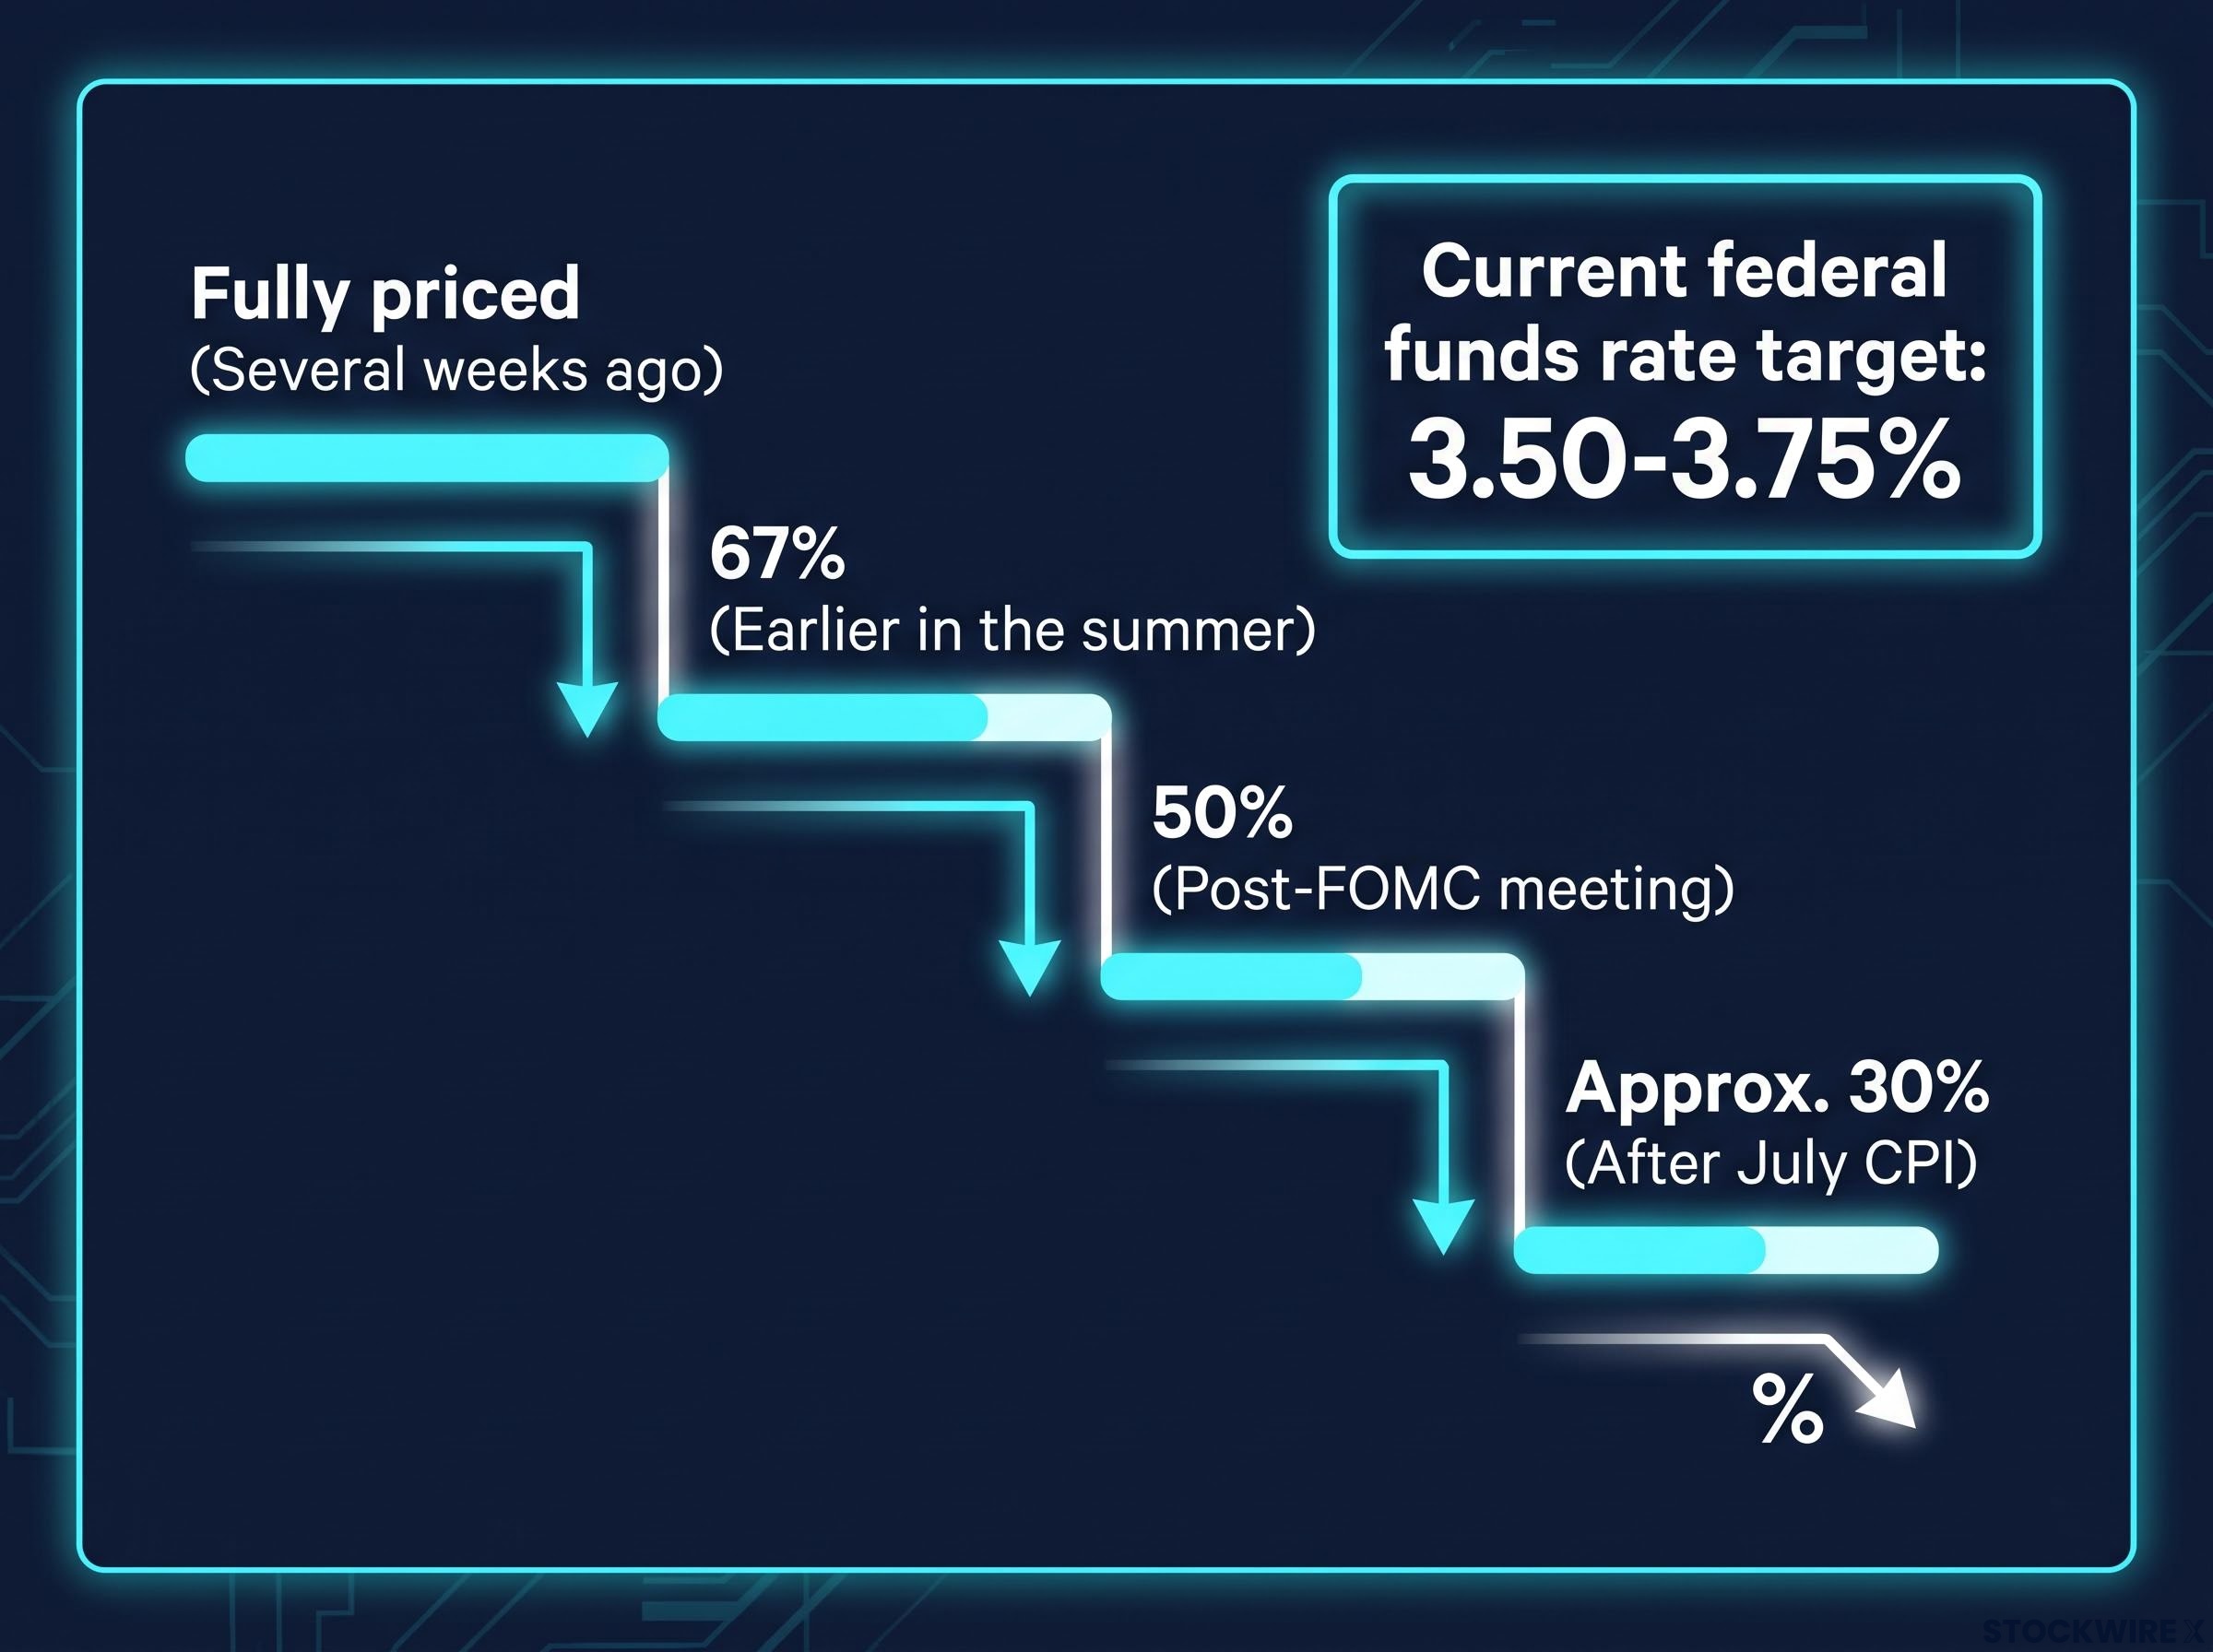
Softer July employment data reinforced the CPI signal, giving markets two data points in the same direction rather than one ambiguous reading. The current federal funds rate target range sits at 3.50-3.75%, and with both inflation and labour figures easing, the case for an immediate move weakened considerably.
September rate hike odds were sitting at approximately 44% heading into the July CPI release, meaning the data carried enough weight to shift the market’s modal expectation from hike to pause in a single print, which is precisely what occurred in the days that followed.
The official July FOMC policy statement maintained this exact target range while emphasising a commitment to assessing incoming economic data before considering further tightening.
The year-end hike probability remains at approximately 90%. The market has not concluded tightening is over. It has concluded September specifically is unlikely, and that distinction matters enormously for how to interpret whatever Powell delivers at Jackson Hole.
A market positioned for a pause is far more sensitive to any hawkish surprise than one that has already priced a hike. That asymmetry shapes everything that follows.
When big ASX news breaks, our subscribers know first
What the 10-year Treasury yield near 4.74% is actually telling you
The 10-year Treasury yield functions as the backbone of global borrowing costs. Mortgage rates, corporate debt pricing, and the discount rates used to value equities all move in relation to it, making it one of the most consequential numbers in financial markets.
At 4.68% as of the 14 August close, the yield is trading within a recent range of 4.63%-4.70% and approaching a level that has drawn pointed attention from analysts. Vantage Markets analyst Jamie Dutta has identified 4.74% as a key technical resistance zone, a ceiling that, if broken, would signal a further repricing in rate expectations across asset classes.
| Metric | Value | Date / Context |
|---|---|---|
| Current yield | 4.68% | 14 August 2026 close |
| Recent trading range | 4.63%-4.70% | Mid-August 2026 |
| Key resistance level | 4.74% | Vantage Markets / Jamie Dutta |
| One year prior | ~4.29%-4.32% | August 2025 |
The yield approaching a technically significant resistance zone at precisely the moment a major Fed communication event is days away means the market is being asked to make a directional bet on rates with very little cushion in either direction. The 10-year is not a background data point here; it is the mechanism through which any shift in Fed tone will transmit directly into equity valuations.
The equity risk premium and why a compressed spread changes everything
Right now, investors are being paid relatively little extra for owning stocks over Treasuries. That is what a compressed equity risk premium tells you in practical terms: the reward for taking equity risk, relative to the safety of government bonds, has narrowed.
The equity risk premium (ERP) is the additional return investors expect for holding equities over risk-free Treasuries. When it compresses, it means equities have less room to rerate higher without something fundamental changing. It functions as a valuation signal, one that flashes caution when bond yields are elevated and stock multiples remain stretched.
What the current numbers show
Estimates for the ERP range from approximately 4.4% (according to Damodaran’s July 2026 update) to 5.1% (per a recent StreetStats snapshot). That range reflects an environment where equities remain highly sensitive to any further upward move in the 10-year yield.
The equity risk premium as measured by Damodaran’s implied model stood at 4.24% as of 1 May 2026, and historical data from the 4%-5% ERP band shows average one-year forward returns of approximately 5%, a baseline that assumes yields do not push materially higher from current levels.
For equities to sustain current valuations from here, one of three things needs to happen:
- Bond yields fall, widening the spread and giving equities breathing room
- Corporate earnings accelerate, justifying current multiples on fundamentals
- Both occur simultaneously
A compressed ERP tells you the current rally is not cheap insurance. Equities are priced for things to go reasonably well, and a hawkish Jackson Hole surprise has limited shock-absorber capacity built into current valuations. Returns must increasingly come from actual profit growth rather than multiple expansion.
Three ways Jackson Hole could break the current standoff
The Jackson Hole symposium runs August 27-29 under the topic “Financial Innovation: Implications for Payments and Policy.” Powell’s remarks will land in a market that has already made a strong directional bet. Here are the three scenarios that framework produces:
Bank of America strategist Michael Hartnett’s Jackson Hole warning, issued on 1 August 2026, flagged the same 28 August inflection date and named the 10-year Treasury yield and the US Dollar Index as the leading indicators to watch, not the S&P 500, which he characterised as the lagging signal in the current macro setup.
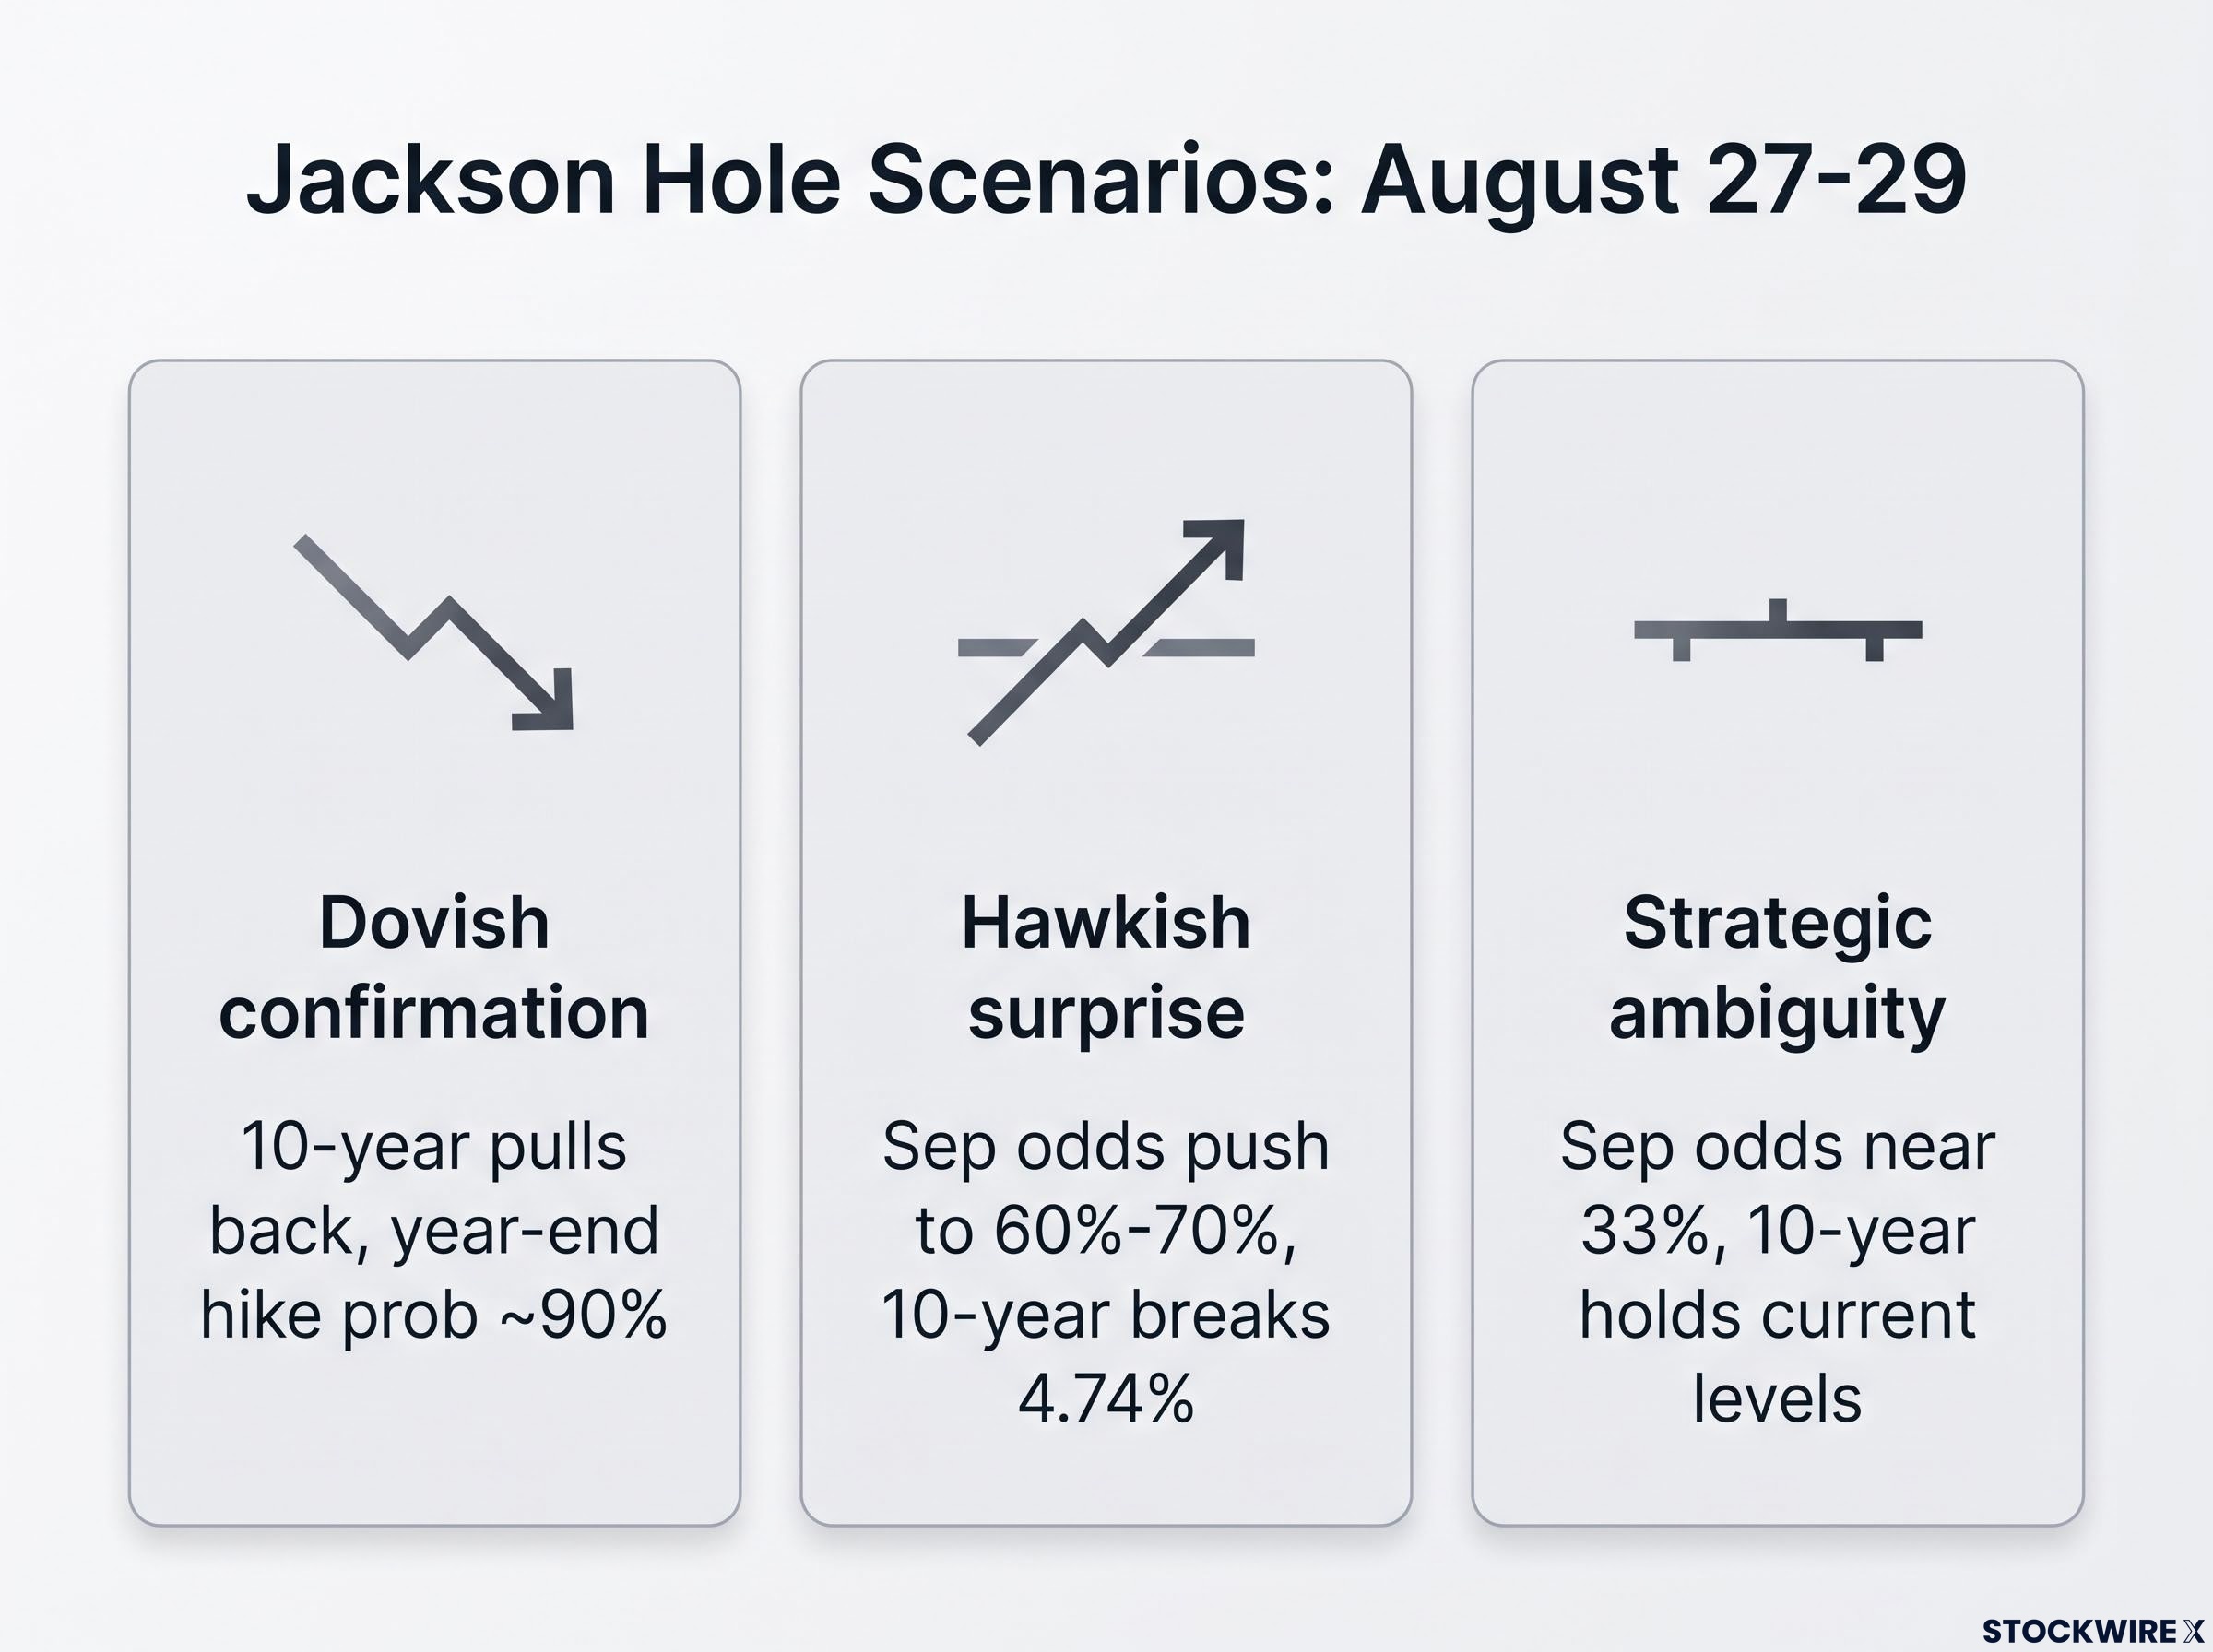
- Dovish confirmation. Powell emphasises patience and data-dependence, validating the decline in September odds. The 10-year pulls back from resistance. Cyclicals and growth stocks respond positively. But relief has limits: the year-end hike probability at approximately 90% caps how far any rally can extend, because the hiking cycle remains active even if September is skipped.
- Hawkish surprise. Powell signals September remains live, pushing odds back toward 60%-70%. The 10-year breaks above 4.74%. Long-duration growth names, speculative tech, utilities, and REITs face the sharpest multiple compression. This scenario hits markets harder than Scenario 1 helps them, because the pause is already largely priced.
- Strategic ambiguity. Powell stays deliberately non-committal, consistent with his demonstrated preference against explicit forward guidance. September odds hover near one-third. The 10-year holds near current levels. The ERP remains compressed, and volatility builds around each subsequent data release as markets search for resolution elsewhere.
Even under the most dovish outcome, year-end hike probability remains near 90%. A pause is not a pivot. The hiking cycle stays active regardless of what happens in September.
The asymmetry is the critical takeaway. A hawkish surprise likely inflicts more damage than a dovish confirmation delivers upside, because the market has already partially anticipated the positive outcome.
Rate-sensitive sectors and where the stress shows up first
Most exposed segments
If the 10-year breaks above 4.74%, the first wave of pressure hits the most rate-sensitive parts of the equity market:
- Unprofitable growth names, where the discount rate effect on future cash flows is most mechanically direct
- Speculative tech, where valuations are built on distant earnings that compress fastest when rates rise
- Utilities, traditionally defensive but long-duration in nature and sensitive to yield competition
- REITs, which carry both leverage exposure and yield-comparison pressure from higher Treasury rates
These are long-duration assets. When the discount rate rises, their valuations absorb the impact first.
Where resilience lives
The positioning case shifts toward companies with characteristics that can deliver returns through earnings rather than multiple expansion:
- Strong free cash flow that supports shareholder returns regardless of rate environment
- Low leverage that limits the cost-of-capital squeeze
- Pricing power that protects margins when input costs and borrowing costs rise simultaneously
When multiple expansion is constrained by yield levels, stock selection shifts from macro repricing trades to fundamentals-based analysis. The early August repricing episode, when hike odds moved materially within days of softer data, demonstrated how quickly the narrative can shift in either direction.
What to watch between now and August 27
The analytical framework above becomes operational when you know exactly what signals to track. In priority order:
- CME FedWatch September hike probabilities. This is the primary real-time instrument for tracking whether the market’s pause bet is holding, strengthening, or reversing. Movement above 40% would signal a meaningful shift in positioning.
- The 10-year Treasury yield relative to 4.74%. A sustained break above this resistance zone would confirm that bond markets are repricing toward a hawkish outcome regardless of what Powell says explicitly.
- Equity risk premium estimates. Any further compression from the current 4.4%-5.1% range would indicate equities are becoming even more vulnerable to a rate shock.
- Subsequent inflation and labour data releases. The early August episode proved that a single data print can move hike odds materially within days. Portfolios should not be positioned for a single narrative.
Powell has shown a clear reluctance to offer explicit forward guidance and is likely to maintain that posture at Jackson Hole. Investors should expect to read between the lines on tone and framing rather than receiving a direct signal, which makes thinking through the scenarios in advance far more useful than scrambling to interpret headlines after the fact.
Powell’s preference against offering explicit forward guidance is not a stylistic choice; under Kevin Warsh the Fed formally scrapped the forward guidance regime in June 2026, meaning every data release between now and 27 August carries greater pricing weight than it would have under the prior communication framework.
This article is for informational purposes only and should not be considered financial advice. Investors should conduct their own research and consult with financial professionals before making investment decisions. These statements are speculative and subject to change based on market developments and company performance.
Before August 27, the divergence is the message
With September hike odds near 30%, markets have placed a firm bet on a pause, yet year-end odds sitting at roughly 90% make clear that the tightening cycle remains intact. The gap between those two numbers is where the fragility in current equity pricing lives, and Jackson Hole is the event most likely to force a resolution.
Yields near cycle highs and equities rallying is not a stable equilibrium. Something has to give, and Powell’s remarks on 27 August are the most likely catalyst.
Investors who understand the scenario structure, the sectors most exposed, and the four indicators to monitor are better equipped to respond to whatever Powell delivers than those reacting to headline summaries after the fact. The monitoring framework is the practical edge; use it before the headlines write themselves.