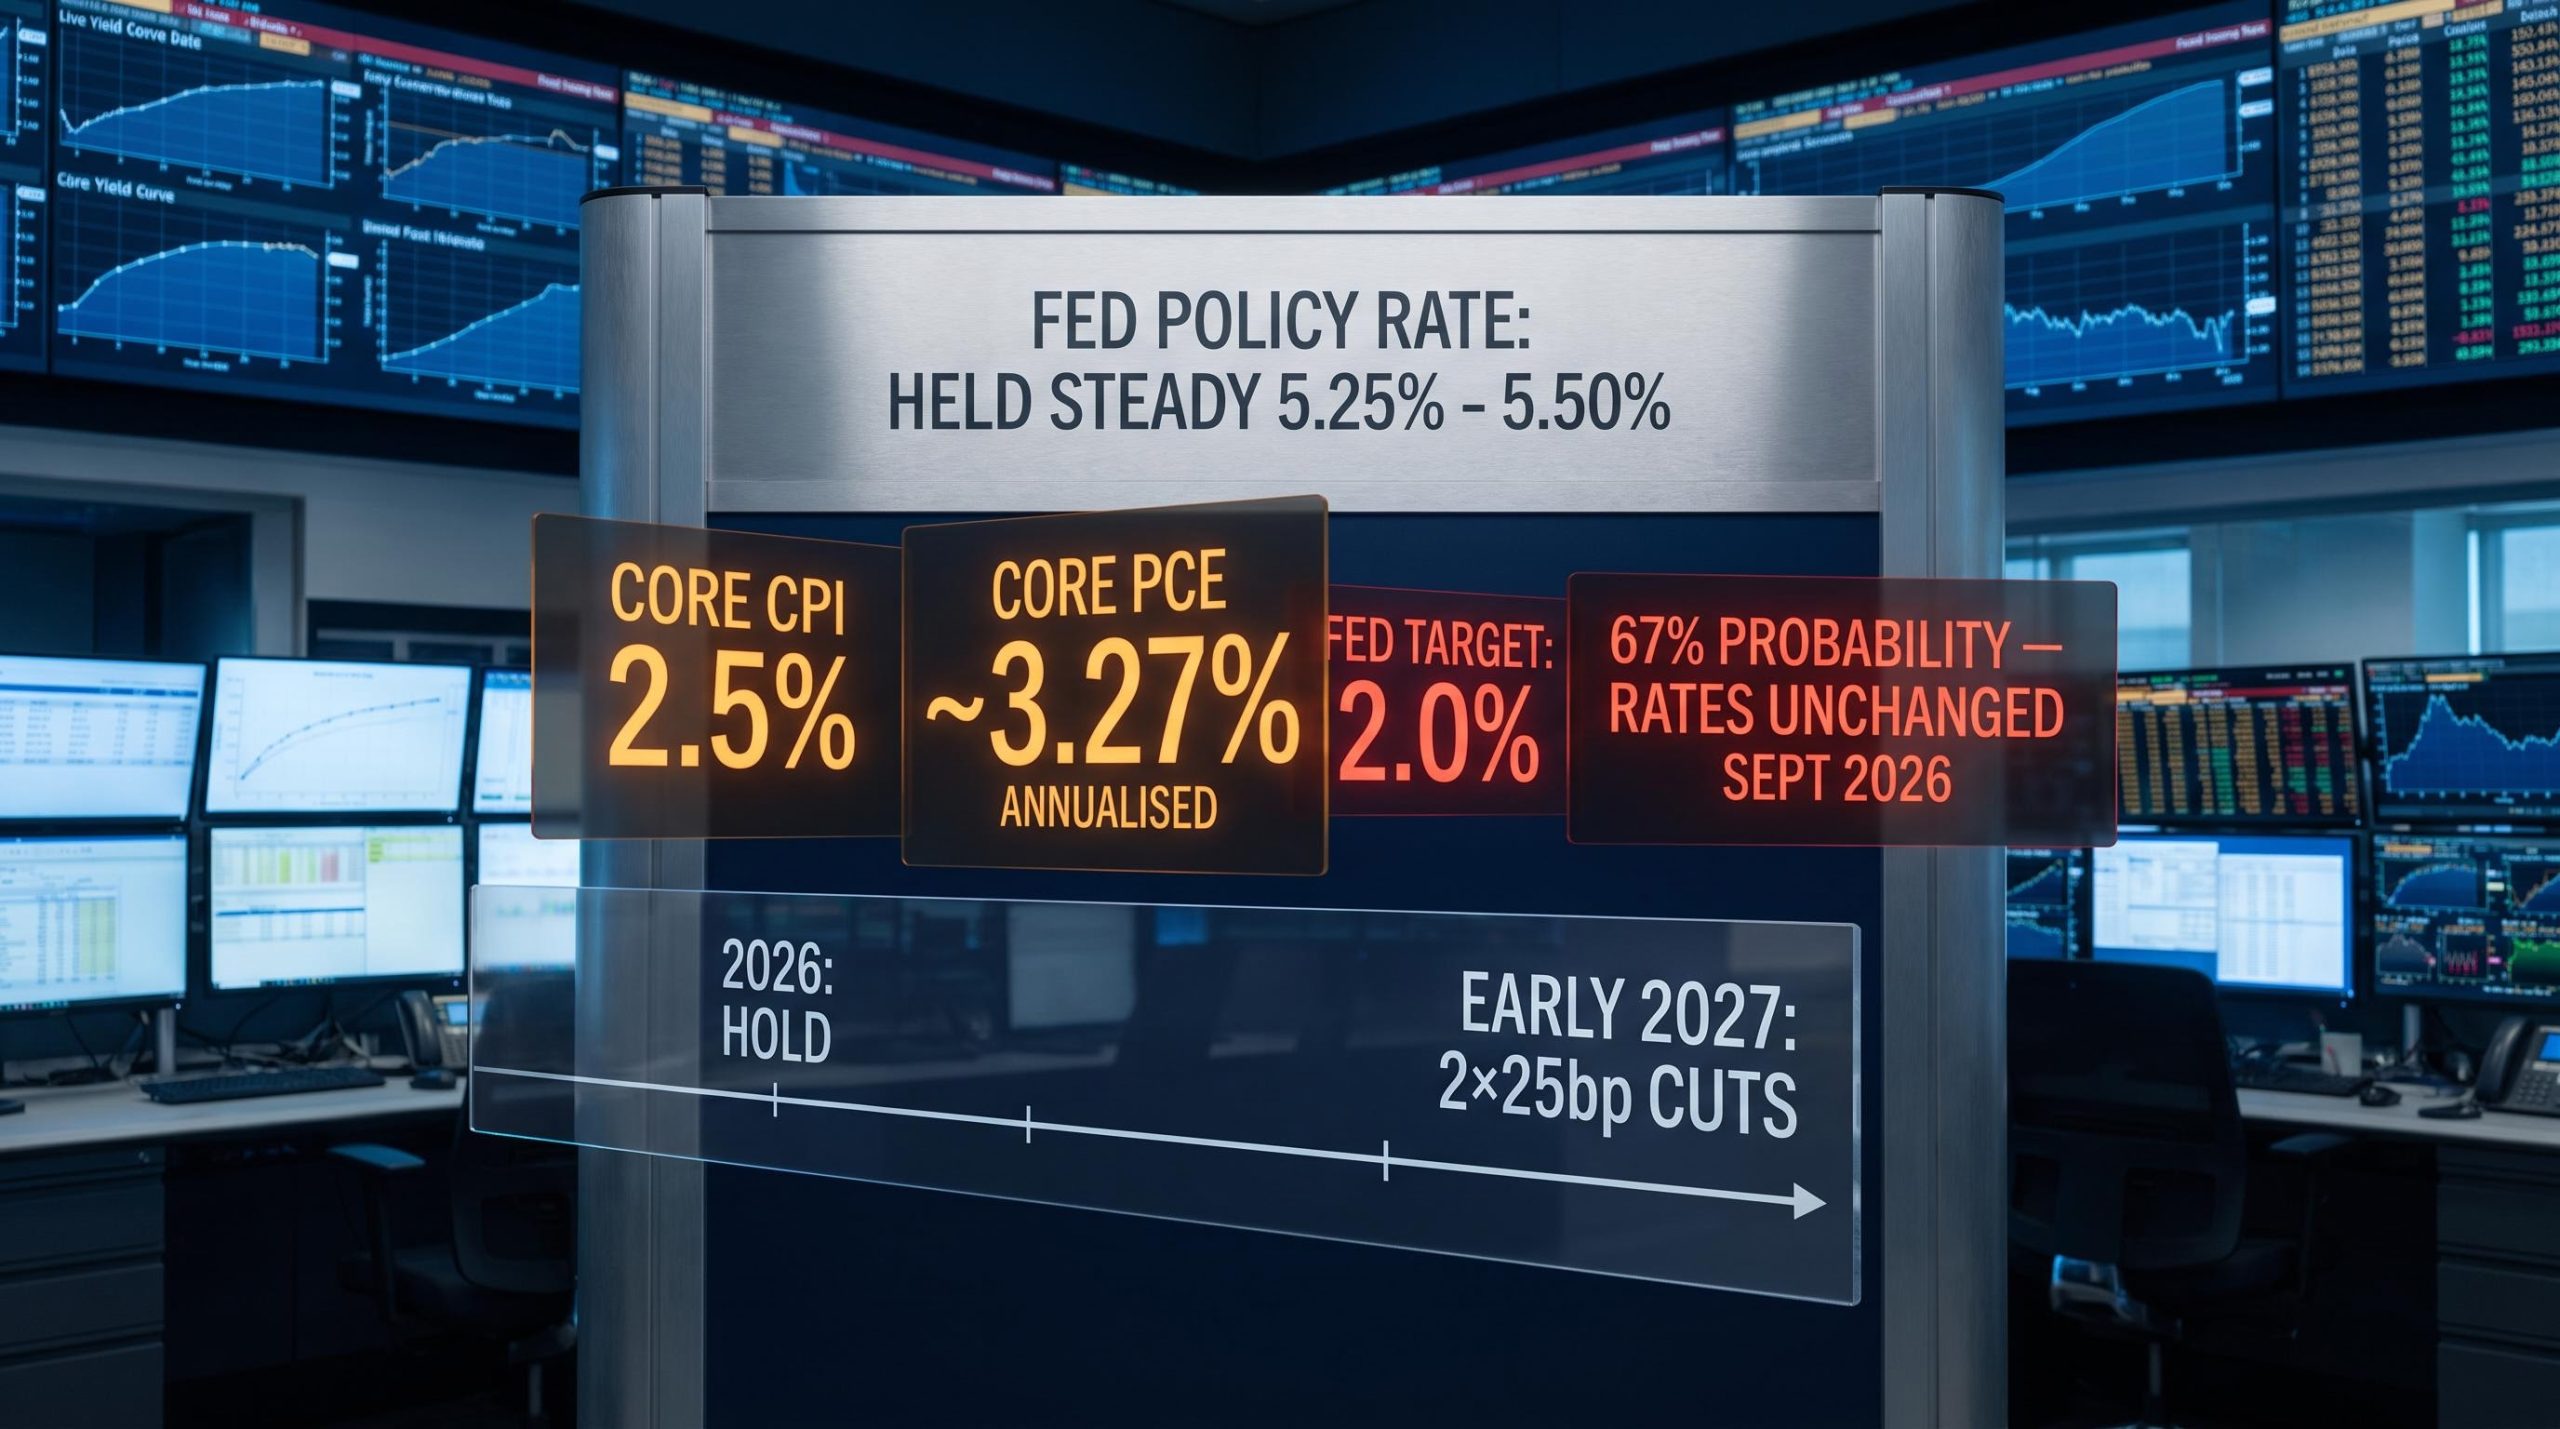
July’s CPI print came in cooler than expected, PPI softened alongside it, and the immediate market read was straightforward: rate cuts are coming. The logic feels clean. The problem is that “cooler inflation” and “rate cuts in 2026” are not the same conclusion, and the gap between those two ideas is where the real analytical work sits.
That gap matters right now because the Federal Reserve has held rates steady through most of 2026, Morgan Stanley has placed its first cut forecast in early 2027, and the inflation data arriving this month is the evidence that will either confirm or unravel that timeline. If you are making decisions about borrowing costs, asset allocation, or fixed income duration, you need a view on this.
Here is a framework for reading each new data point as it arrives, understanding whether it moves the Fed closer to cutting or further away, and knowing which scenario is actually unfolding beneath the headlines.
What July’s inflation numbers actually showed
The Bureau of Labor Statistics (BLS) reported that headline Consumer Price Index (CPI, the broadest measure of consumer prices) growth slowed to 3.4% year-over-year in July 2026, easing back from 3.5% the prior month. Core CPI, which strips out volatile food and energy prices, moved down to 2.5% from 2.6%. Monthly core CPI rose 0.2%.
On the producer side, July brought a softening in PPI readings as well. Those figures matter because components drawn from both CPI and PPI flow into the Fed’s preferred inflation gauge, personal consumption expenditures (PCE), published by the Bureau of Economic Analysis (BEA), rather than CPI being the primary policy reference. Morgan Stanley’s model-based estimate for July core PCE, incorporating the latest PPI inputs, pointed to a monthly rise of approximately 0.23%, translating to an annualised rate of roughly 3.27%. On the headline side, the bank estimated a monthly gain of approximately 0.14%, or 3.64% annualised.
| Measure | June 2026 | July 2026 | Fed Target |
|---|---|---|---|
| Headline CPI (YoY) | 3.5% | 3.4% | 2.0% |
| Core CPI (YoY) | 2.6% | 2.5% | 2.0% |
| Core PCE (annualised, MS est.) | N/A | ~3.27% | 2.0% |
| Headline PCE (annualised, MS est.) | N/A | ~3.64% | 2.0% |
(Morgan Stanley PCE figures are model-based estimates derived from CPI and PPI inputs, not official BEA releases.)
The direction of travel is right. The distance still to cover is not small. At 2.5% core CPI and an estimated 3.27% annualised core PCE, inflation remains meaningfully above the Fed’s 2% target. These numbers represent progress, not arrival, and that distinction is what makes 2026 cuts unlikely even as the data improves.
The BLS July 2026 CPI release confirmed headline inflation at 3.4% year-over-year and core CPI at 2.5%, providing the official government figures that underpin the PCE estimates and scenario analysis discussed throughout this piece.
When big ASX news breaks, our subscribers know first
Why prices are falling, and where the pressure is coming from
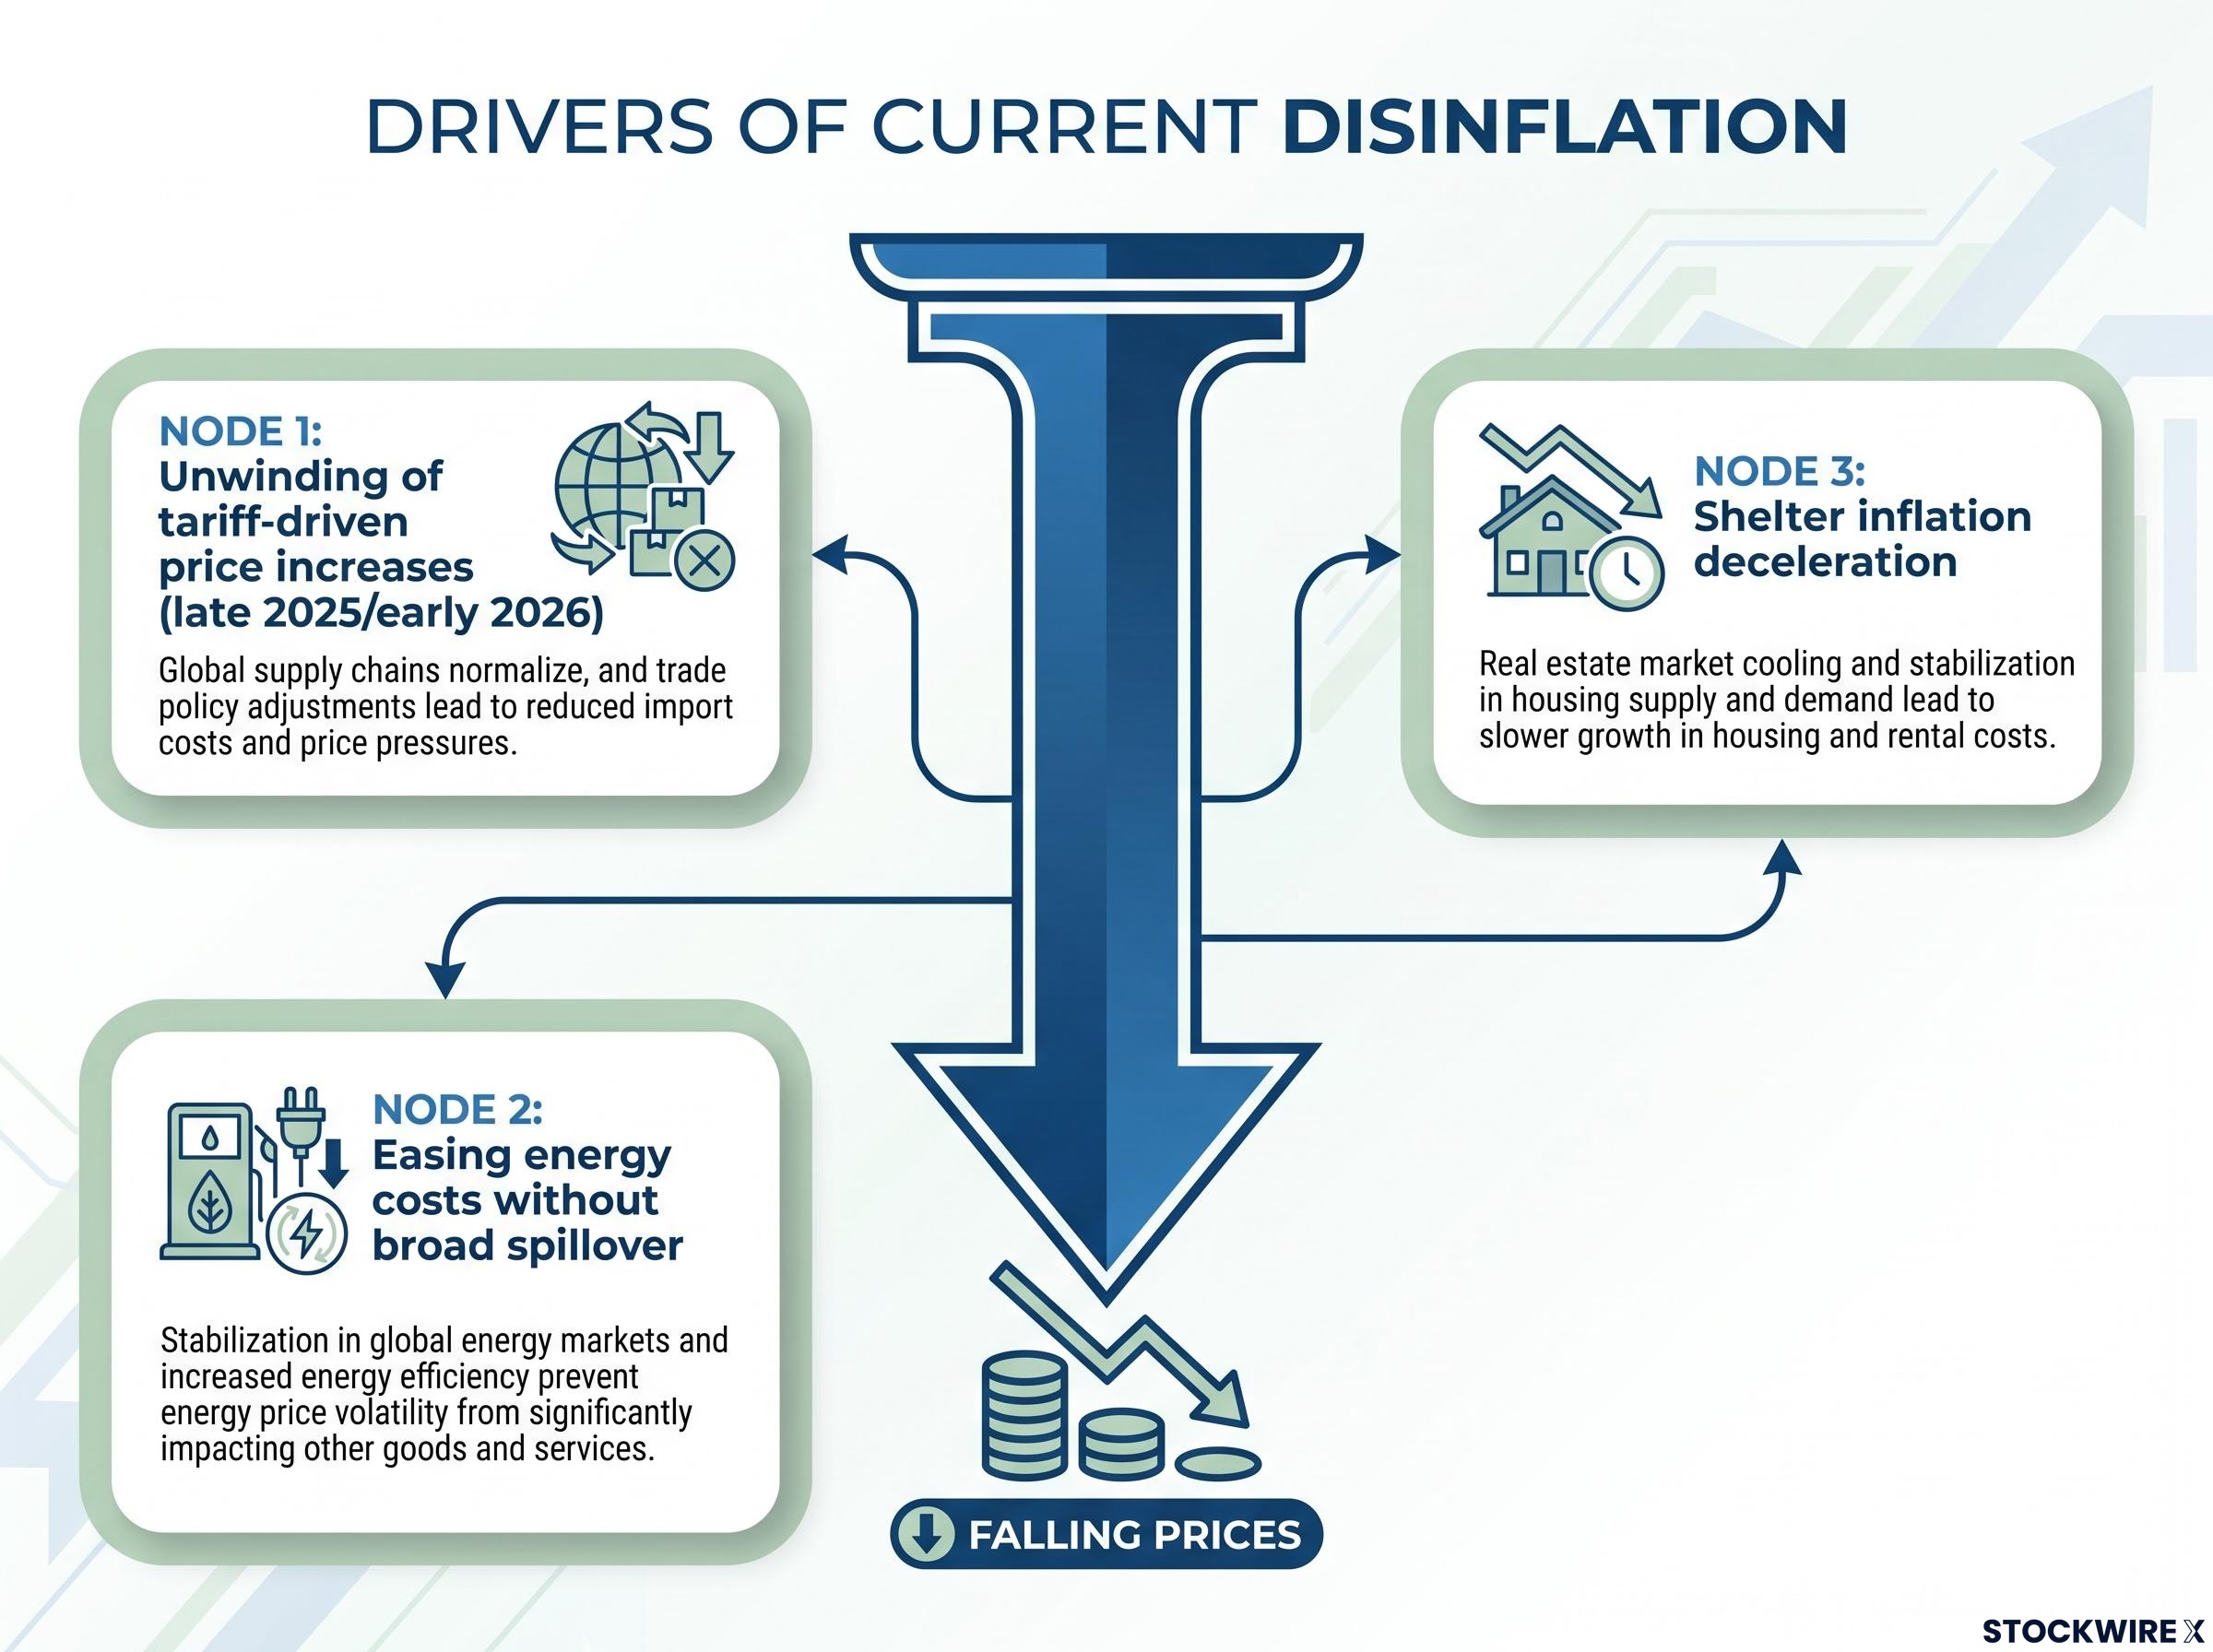
Morgan Stanley identified three distinct forces behind the current disinflationary move. Each operates through a different channel and carries a different vulnerability to reversal, which is why separating them analytically matters.
- Unwinding of tariff-driven price increases: Cost pressures that were embedded in goods prices by tariff rounds in late 2025 and early 2026 are now fading, removing upward momentum that had been built into the price level.
- Easing energy costs without broad spillover: Softer energy prices have fed through to headline numbers, and critically, they have not produced secondary price increases elsewhere. Businesses have not used the energy relief as an opportunity to lift prices in unrelated categories.
- Shelter inflation deceleration: Housing-related costs, which carry significant weight in CPI calculations, have begun to cool, pulling the headline number lower.
The absence of significant second-round effects is the positive signal that keeps the disinflationary path open. When initial price increases from tariffs or energy do not embed themselves into broader wage and price expectations, the pass-through remains contained. A softer-than-expected nonfarm payrolls report in mid-2026 reinforced this picture, suggesting demand is cooling in a way that supports continued disinflation without forcing an abrupt slowdown.
What could interrupt the disinflationary trend
The two pillars of Morgan Stanley’s forecast are an assumption that no fresh supply-side shock emerges, and that demand linked to AI adoption does not produce significant upward price pressure. These are conditions embedded in the forecast, not outcomes the bank is predicting with certainty.
The practical read is that the current disinflation is real but conditional. It depends on supply-side stability, and any reversal in tariff dynamics or energy prices would shift the trajectory meaningfully.
How the Fed is reading this data, and why patience is the policy
The Fed has been explicit about what it needs before cutting: sustained evidence of disinflation, not a single soft print. One month of cooler data confirms a direction. It does not confirm a destination.
Kevin Warsh’s first FOMC meeting in June 2026 established this posture formally, stripping forward guidance from the policy statement entirely and recentring Fed communication around a strict data-dependent framework that makes each monthly inflation print carry more market-moving weight than investors had been accustomed to under prior chairs.
The Fed’s institutional position is that a single soft reading is not sufficient to justify easing. Policymakers are explicitly waiting for a pattern of evidence, not a data point.
The labour market context gives the Fed room to wait. Softer-than-expected job gains in mid-2026 are consistent with cooling demand, which means the economy is not overheating in a way that forces urgent action. But neither is the labour market deteriorating fast enough to create urgency for immediate cuts. The Fed is in the space between those two pressures, and it is using that space deliberately.
Market pricing reflects this patience. According to CME FedWatch data as of 16 August 2026, traders assigned roughly 67% probability to the Fed leaving rates unchanged at the September 2026 FOMC meeting, a notable increase from around 55% just a week earlier. These probabilities shift quickly and should be understood as a historical snapshot rather than a forward guarantee.
The Fed’s patience is not complacency. It reflects a deliberate strategy of accumulating enough evidence to avoid cutting too early and then having to reverse course. A premature cut followed by a re-hike would be more damaging to credibility and markets than a delayed first cut. That calculation is what keeps rates where they are.
Morgan Stanley’s base case, and where it differs from the rest of Wall Street
The outlook published by Morgan Stanley, under the direction of chief U.S. economist Michael Gapen, calls for the Fed to keep its policy rate on hold through the rest of 2026 before delivering a pair of 25-basis-point reductions in early 2027, bringing the total easing to approximately 50 basis points.
That forecast is contingent on two inflation conditions being met:
- Core PCE reaching approximately 3.0% by December 2026.
- Core PCE falling further to approximately 2.4% by end of 2027.
The precise sequencing of the two cuts has varied across Morgan Stanley publications. Some notes cite March and June 2027; others reference January and March. The consistent and defensible characterisation is two 25bp cuts in early 2027 after holding through 2026. The variation in specific months is worth noting because it signals that even within a single institution’s framework, the exact timing carries real uncertainty.
That uncertainty extends across Wall Street. The “no cuts in 2026” position is Morgan Stanley’s specific house view, not a uniform consensus. Some forecasts include late-2026 cuts; others push the first cut to early 2027. Futures market pricing has moved across this range throughout the year. What this tells you, particularly if you hold fixed income or rate-sensitive equity exposure, is that positioning around a single date carries meaningful execution risk. The analytical value is in the framework and the conditions attached to it, not in the specific month.
Morgan Stanley has also published concrete hike triggers that sit alongside its base-case no-cut forecast: sustained monthly core inflation at or above 0.3% month-over-month and the unemployment rate falling below 4.0%, two measurable thresholds that convert the scenario framework into real-time signals rather than qualitative judgments.
Three scenarios, from soft landing to rate hike reversal
Morgan Stanley structured its forward outlook around three scenarios, each anchored to a specific core PCE trajectory. They escalate in order of disruption.
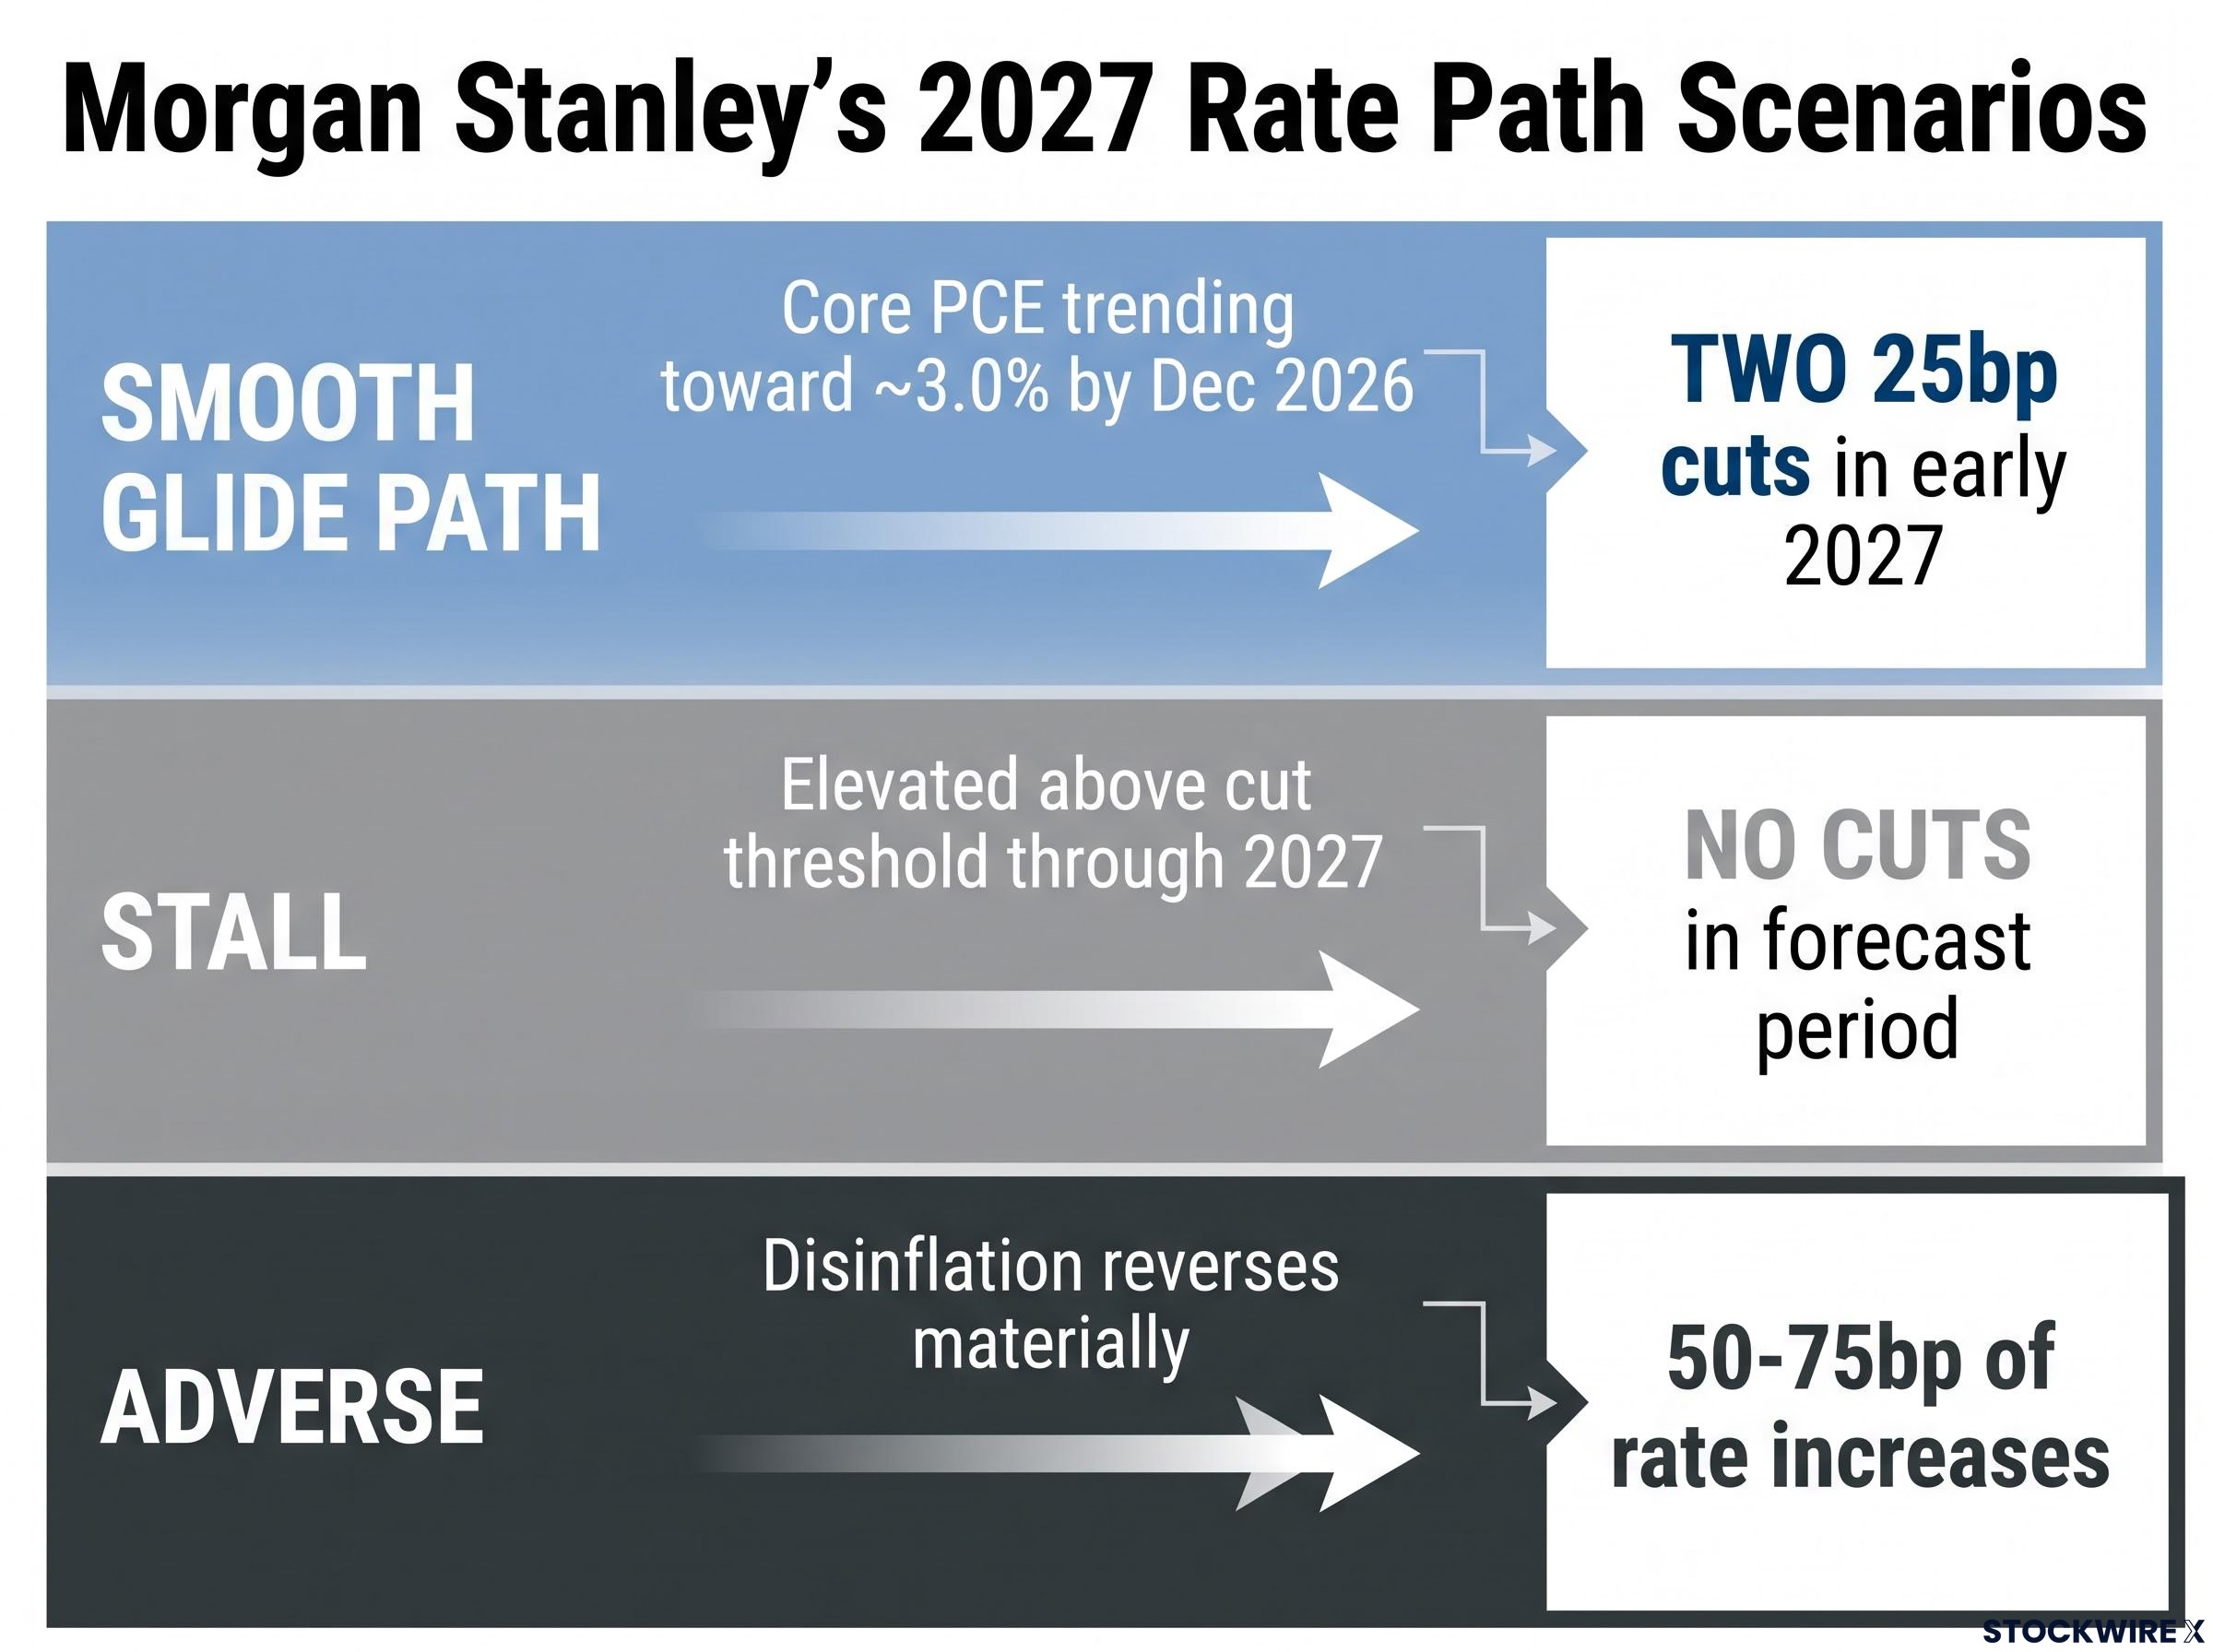
| Scenario | Core PCE Trajectory | Fed Action in 2027 | Key Trigger |
|---|---|---|---|
| Smooth glide path | Trending toward ~3.0% by Dec 2026 | Two 25bp cuts in early 2027 | Disinflation continues on track |
| Stall | Elevated above cut threshold through 2027 | No cuts in forecast period | Inflation slows but remains too sticky |
| Adverse | Disinflation reverses materially | 50-75bp of rate increases | New supply shock or demand surge |
The smooth glide path is the base case: disinflation holds, core PCE trends toward 3.0% by December 2026, and the Fed has enough confidence to begin easing in early 2027.
In the stall scenario, conditions neither deteriorate sharply nor improve by enough to clear the Fed’s threshold. Price growth moderates but settles in a range that leaves the central bank without sufficient grounds to act. The result is rates held in place across the entire forecast horizon, with no easing delivered at all.
Under the adverse scenario, the current disinflationary trend goes into reverse in a meaningful way, and Morgan Stanley’s analysis points to the Fed responding with 50 to 75 basis points of rate increases to unwind the risk-management cuts implemented in the prior year.
The possibility of 50 to 75 basis points of additional tightening under the adverse scenario represents the sharpest tail risk in Morgan Stanley’s framework. Its presence in the analysis is a signal that the bank views the path to lower inflation as genuinely uncertain, not merely delayed.
The two baseline assumptions whose failure drives the stall and adverse scenarios are the same ones identified earlier: new supply-side shocks materialising, or AI-driven demand generating significant price pressures. The range of outcomes is genuinely wide, and the tail risk includes higher rates, not just slower cuts.
What to watch in the months ahead, and how to use this framework
Three forward variables will determine which scenario materialises. Each one has a specific directional signal and a threshold to compare against.
- Monthly core PCE trajectory: The December 2026 core PCE reading relative to the approximately 3.0% threshold is the primary checkpoint for the base case. July’s Morgan Stanley estimate of 0.23% monthly is the current benchmark. A monthly print above 0.25% pushes toward the stall or adverse scenario.
- New supply-side shocks: A new tariff escalation or energy disruption is the fastest route to the adverse outcome. Any material policy change on trade or a significant supply-chain disruption should immediately shift your reading of the scenario framework toward the stall or adverse paths.
- Shelter inflation deceleration: If shelter costs remain sticky, the glide path to 3.0% core PCE by December delays. Shelter carries significant weight in the CPI calculation, and its trajectory is the component most likely to determine whether disinflation arrives on schedule or stalls.
Brookings research on shelter inflation persistence highlights the structural lag between market rent movements and CPI shelter measurements, a dynamic that makes shelter the component most resistant to rapid normalisation even when new lease prices begin to soften.
The September 2026 FOMC meeting is the next significant event for observing how the Fed characterises the inflation trajectory in its public communications. Watch the language closely: any shift from “patience” toward “accumulating evidence” or “approaching confidence” would signal the base case is gaining ground.
These three variables convert the analysis built across this piece into something you can monitor with each new data release, rather than a one-time read you set aside.
What the data confirms, and what it still cannot tell you
The July data has established something real: the disinflationary trend is intact, the Fed has room to be patient, and Morgan Stanley’s base-case path to early-2027 cuts remains coherent as of mid-August 2026. The direction is right. The conditions attached to the forecast are being met, so far.
What remains unresolved is whether those conditions hold. The two baseline assumptions, no new supply shocks and no AI-driven demand surge, are conditions, not guarantees. The distance between the smooth glide path (two 25bp cuts in early 2027) and the adverse scenario (50 to 75 basis points of potential hikes) is not trivial. That width is the honest measure of how much uncertainty remains.
The conditional nature of the current disinflationary path sits within a larger debate about whether the forces driving it are cyclical reversals or the surface expression of a structural inflation regime, one in which 13 simultaneous reversals of the forces that produced four decades of low inflation create a durably higher price floor than the Fed’s 2% target implies.
Progress toward the Fed’s target is visible in the data, but the conditions required to unlock a first cut have not yet been fully satisfied. Acting on a single month’s improvement, in either direction, would mean mistaking a data point for a trend.
The monitoring framework from the previous section is how the picture clarifies over time. Each core PCE print, each FOMC communication, each supply-side development narrows the range of live scenarios. The December 2026 core PCE reading relative to the approximately 3.0% threshold is the single most important checkpoint between now and the first potential cut.
This article is for informational purposes only and should not be considered financial advice. Investors should conduct their own research and consult with financial professionals before making investment decisions. Financial projections referenced are subject to market conditions and various risk factors. Past performance does not guarantee future results.