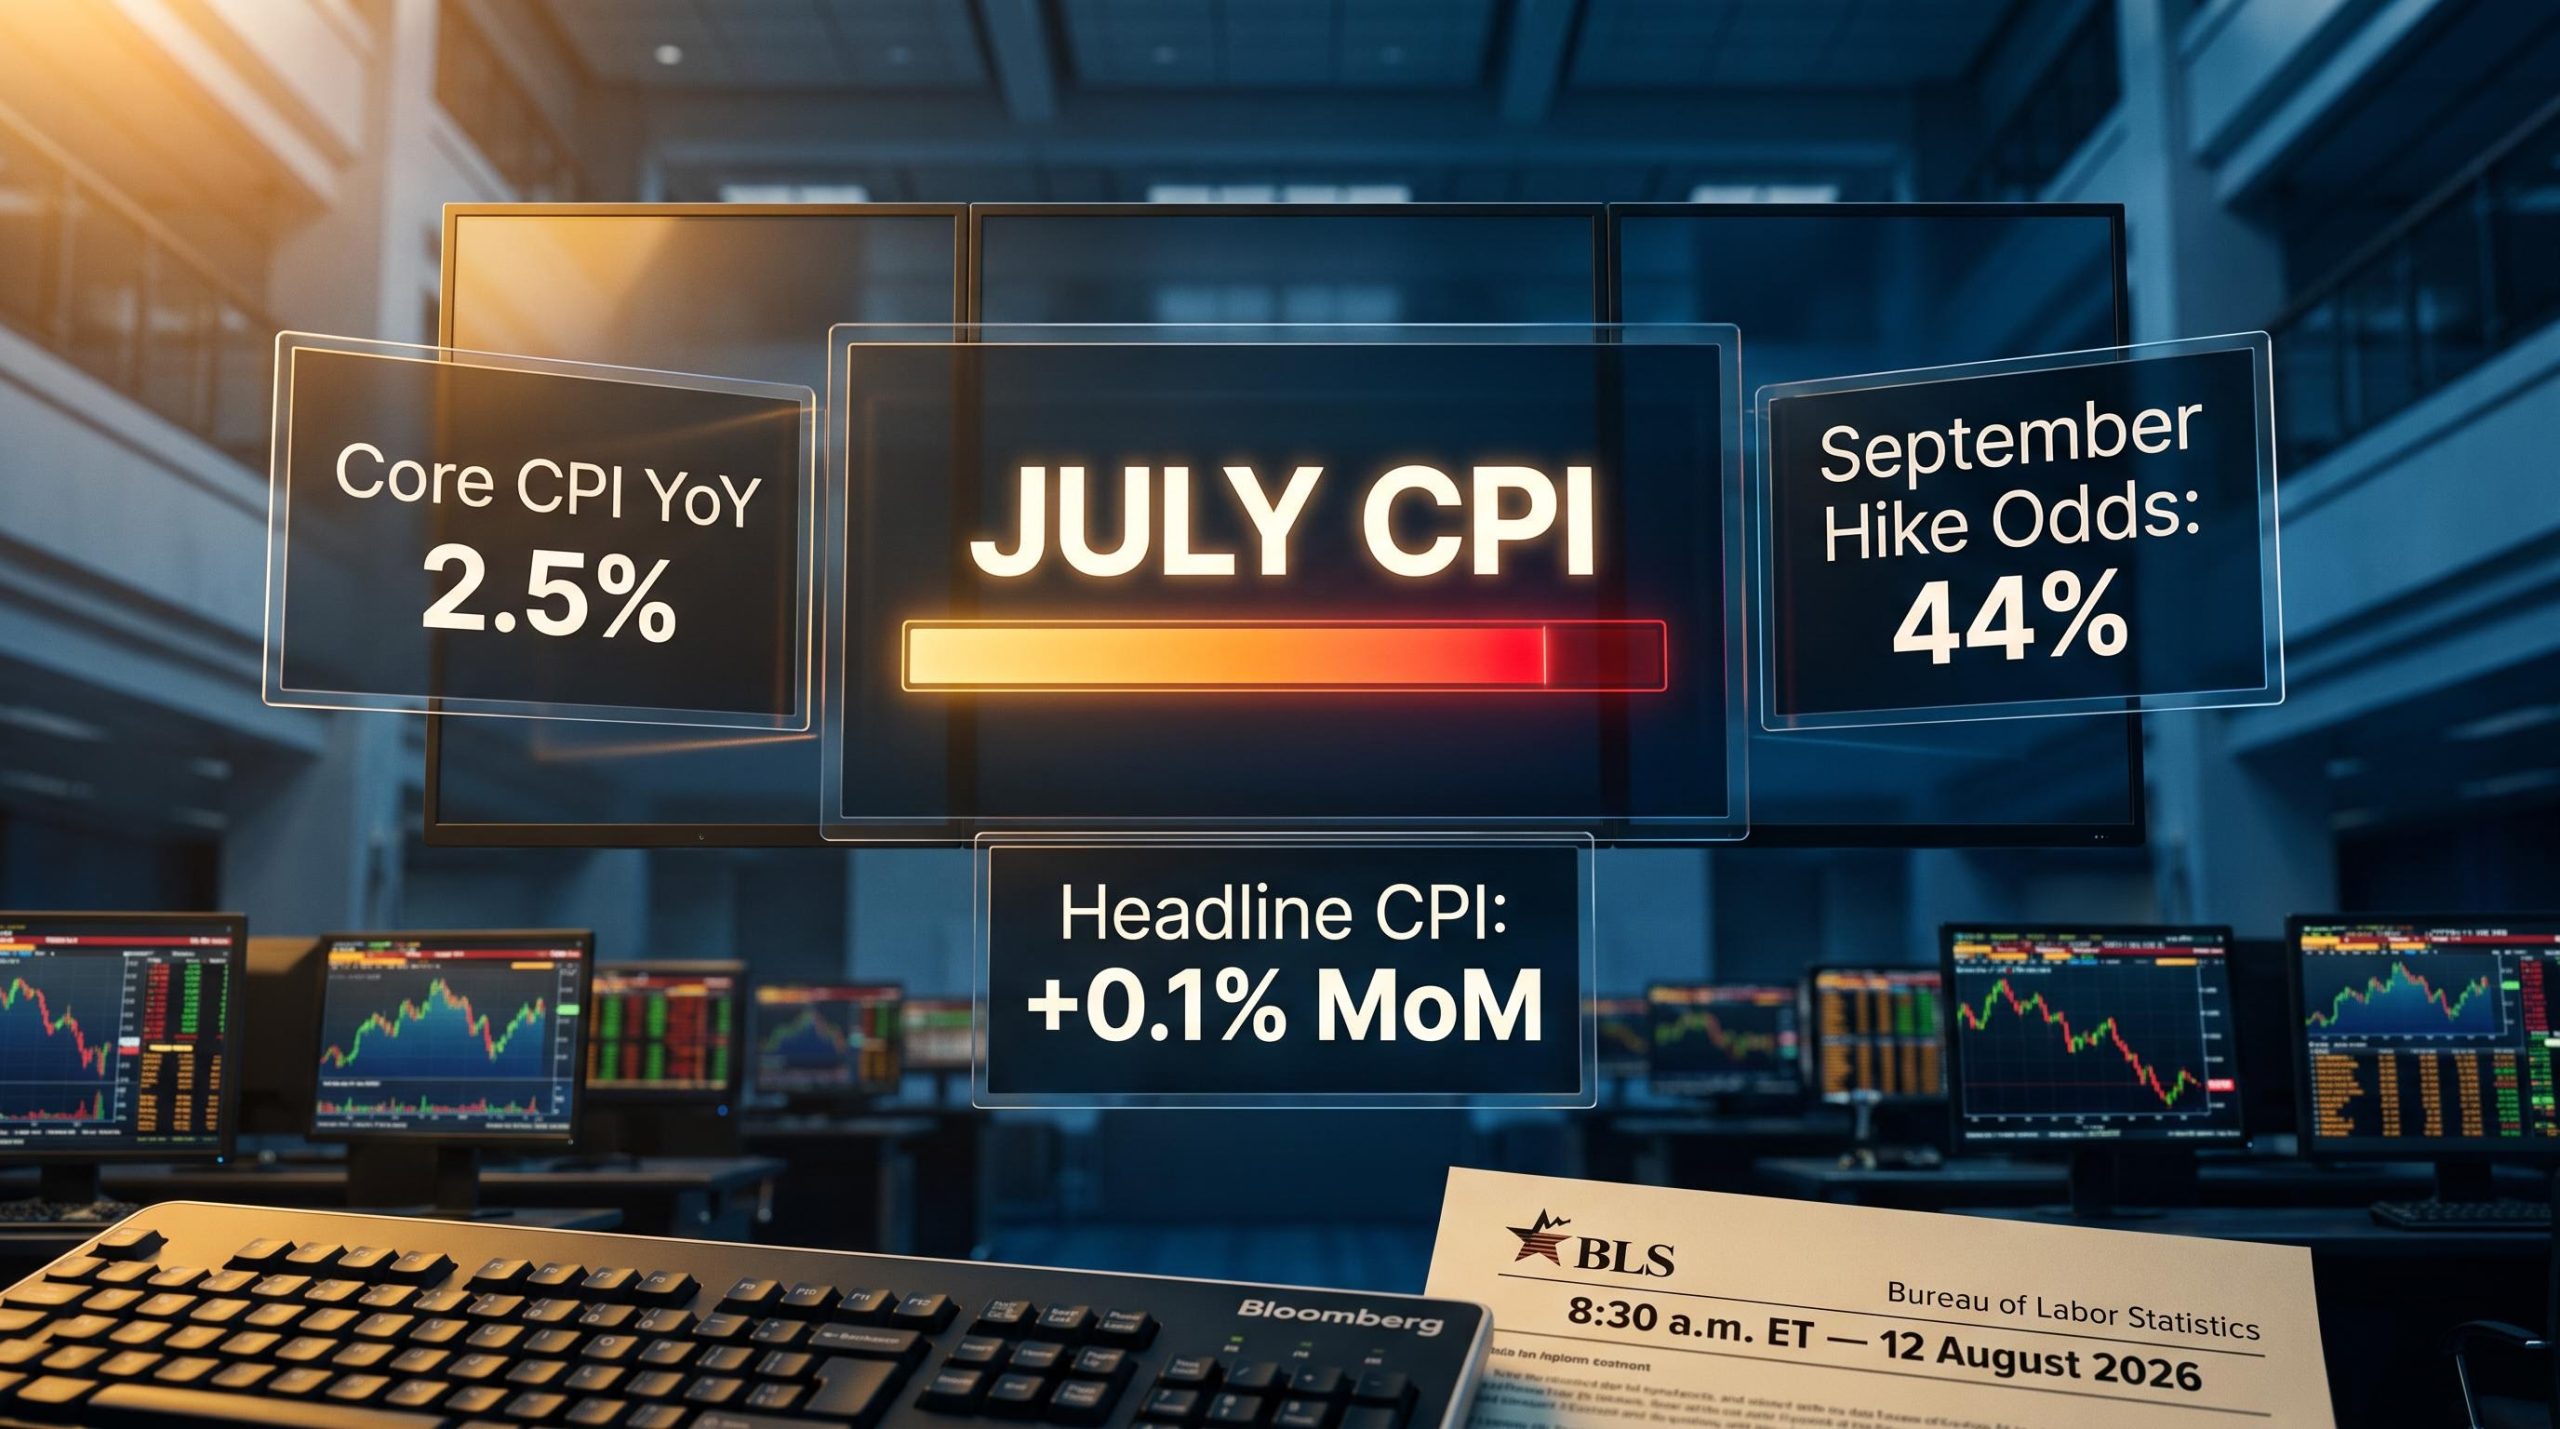
The probability of a September rate hike sits at roughly 44%, and one data release on Wednesday morning will move it decisively in one direction or the other. That is not speculation. It is the arithmetic of a finely balanced Federal Reserve and a market that cannot make up its mind.
The July Consumer Price Index (CPI) report lands at a specific inflection point in the Fed’s inflation fight. June delivered the first clearly soft core reading after a sequence of hotter prints. July will determine whether that was a genuine trend break or a statistical fluke. Neither the Fed nor markets can afford to treat this print as routine.
Here is what the numbers need to show, what each outcome means for Fed policy, and how the dollar, gold, and equities are positioned to react the moment the data drops.
What the forecasts show ahead of Wednesday’s release
The Bureau of Labor Statistics (BLS) will publish the July CPI report on Wednesday, 12 August 2026 at 8:30 a.m. ET. Consensus expectations point to a modest monthly rebound in prices after June’s outright decline, but the annual trend continues to cool.
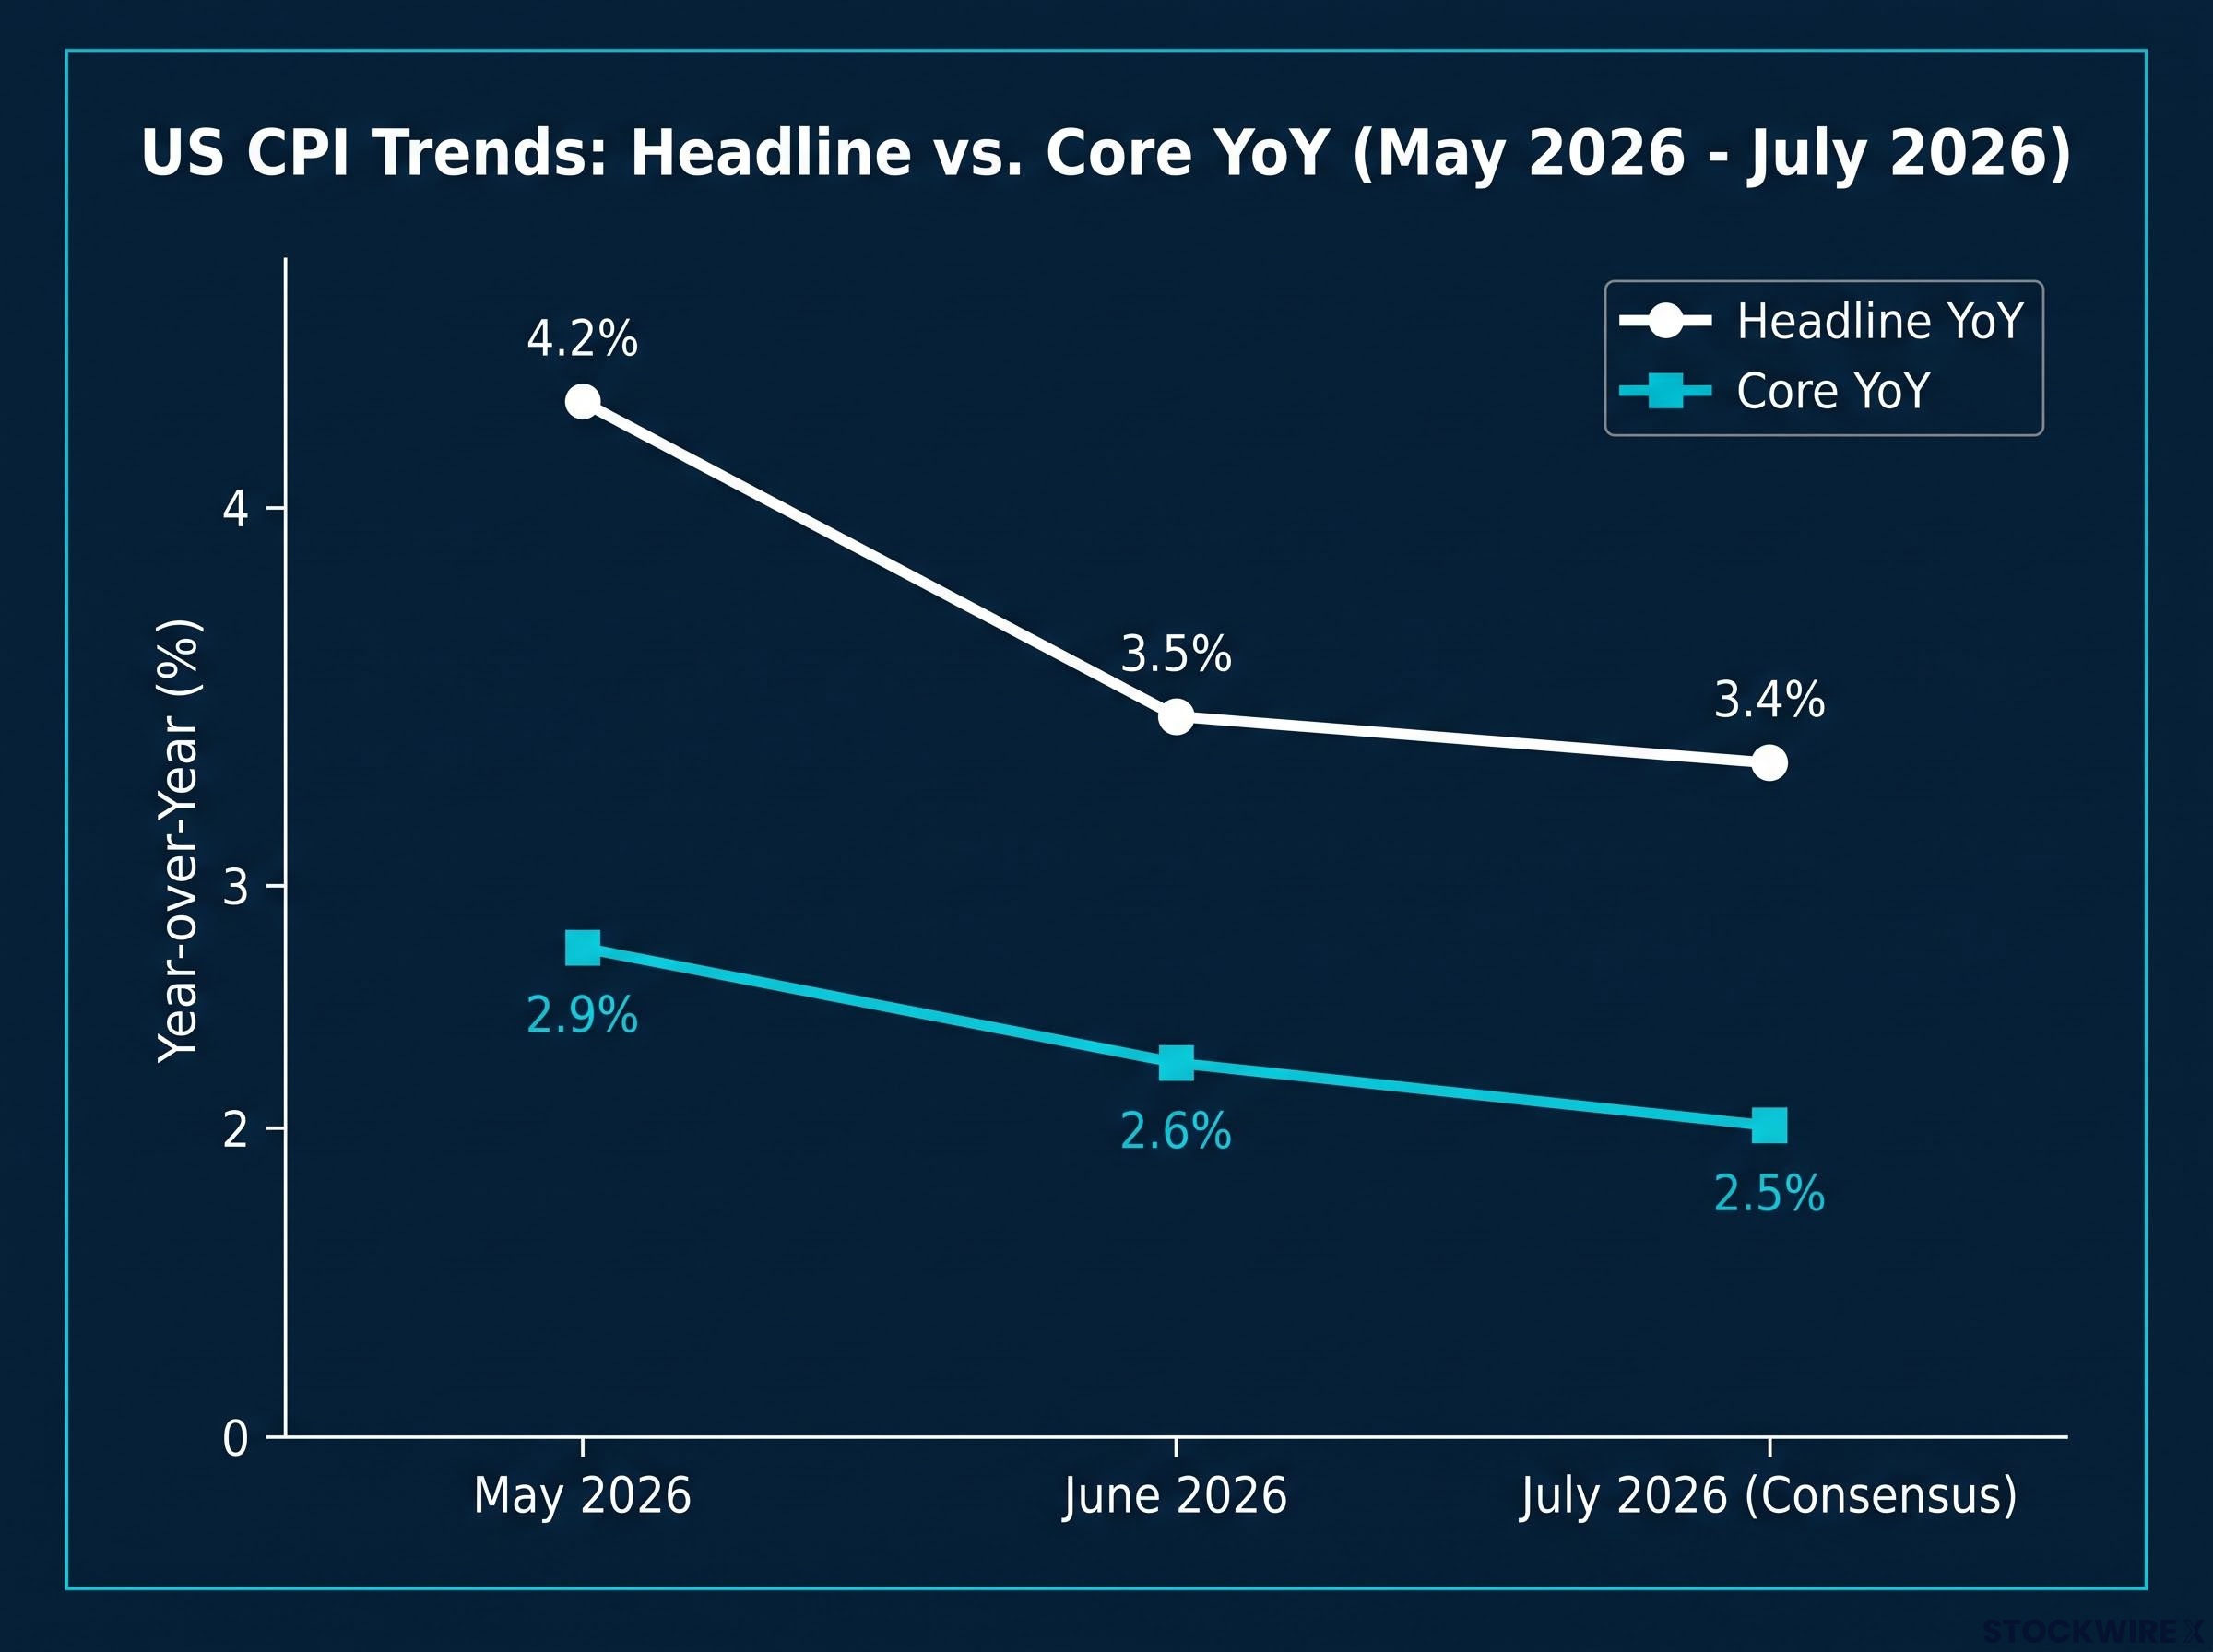
| Metric | May 2026 (Actual) | June 2026 (Actual) | July 2026 (Consensus) |
|---|---|---|---|
| Headline CPI (MoM) | +0.5% | -0.4% | +0.1% |
| Headline CPI (YoY) | 4.2% | 3.5% | 3.4% |
| Core CPI (MoM) | — | Flat (0.0%) | +0.2% |
| Core CPI (YoY) | 2.9% | 2.6% | 2.5% |
The direction of travel matters more than the headline figure alone. Annual core CPI, which strips out volatile food and energy prices, is forecast to fall from 2.6% to 2.5%. That tenth of a percentage point carries outsized significance.
A 2.5% annual core reading would match the lowest such figure recorded since March 2021.
If the consensus is right, the Fed’s preferred measure of underlying price pressure will have reached a level not seen in more than five years. That is not a routine data update. It is a potential milestone in the tightening cycle.
When big ASX news breaks, our subscribers know first
Why June’s inflation surprise made this week so pivotal
June’s CPI report changed the conversation. After months of hotter-than-expected readings, the data broke sharply in the other direction:
The June core CPI print was the single largest downside miss relative to consensus in over a year, with the 0.0% monthly reading pulling the annual rate from 2.9% to 2.6% in one step and materially shifting the trajectory of rate expectations heading into the second half of 2026.
- Headline CPI fell 0.4% month-over-month, compared with a 0.5% rise in May
- Annual headline inflation dropped to 3.5%, down from 4.2%
- Core CPI came in flat on the month, with the annual rate easing to 2.6% from 2.9%
Analysts described the report as “benign,” and it was the first clearly soft core reading after a run of hotter prints. Markets responded immediately. Market-implied odds of additional rate hikes dropped to approximately 40%, and Treasury yields fell.
One soft print, however, is not enough for the Fed. The central bank has repeatedly stressed that it requires a sequence of confirming data before declaring the tightening cycle over. June shifted the starting question from “is inflation cooling?” to “is the cooling real and durable?” That is a materially different question with a higher evidentiary bar, which is exactly why July’s number carries more weight than June’s did. Wednesday is not just another monthly data release. It is the confirmation hearing.
How the Federal Reserve and markets are reading the data
The September Federal Open Market Committee (FOMC) meeting, the committee that sets US interest rates, is genuinely uncertain. That uncertainty is itself the mechanism making Wednesday’s print so consequential.
The current rate-path uncertainty traces directly to the most recent policy decision: the 9-3 FOMC vote on 29 July 2026 sent the 30-year Treasury yield to its highest level since 2007 and left swap markets pricing roughly 60% odds of a September hike, a starting point that Wednesday’s CPI print will either validate or erode.
Here is how the odds have shifted:
- Before the most recent FOMC meeting: a September rate hike was fully priced in
- Early July: futures markets showed 60-65% odds for a September hike
- Current pricing: approximately 44% probability, with markets embedding around 15 basis points for September and 33 basis points for December
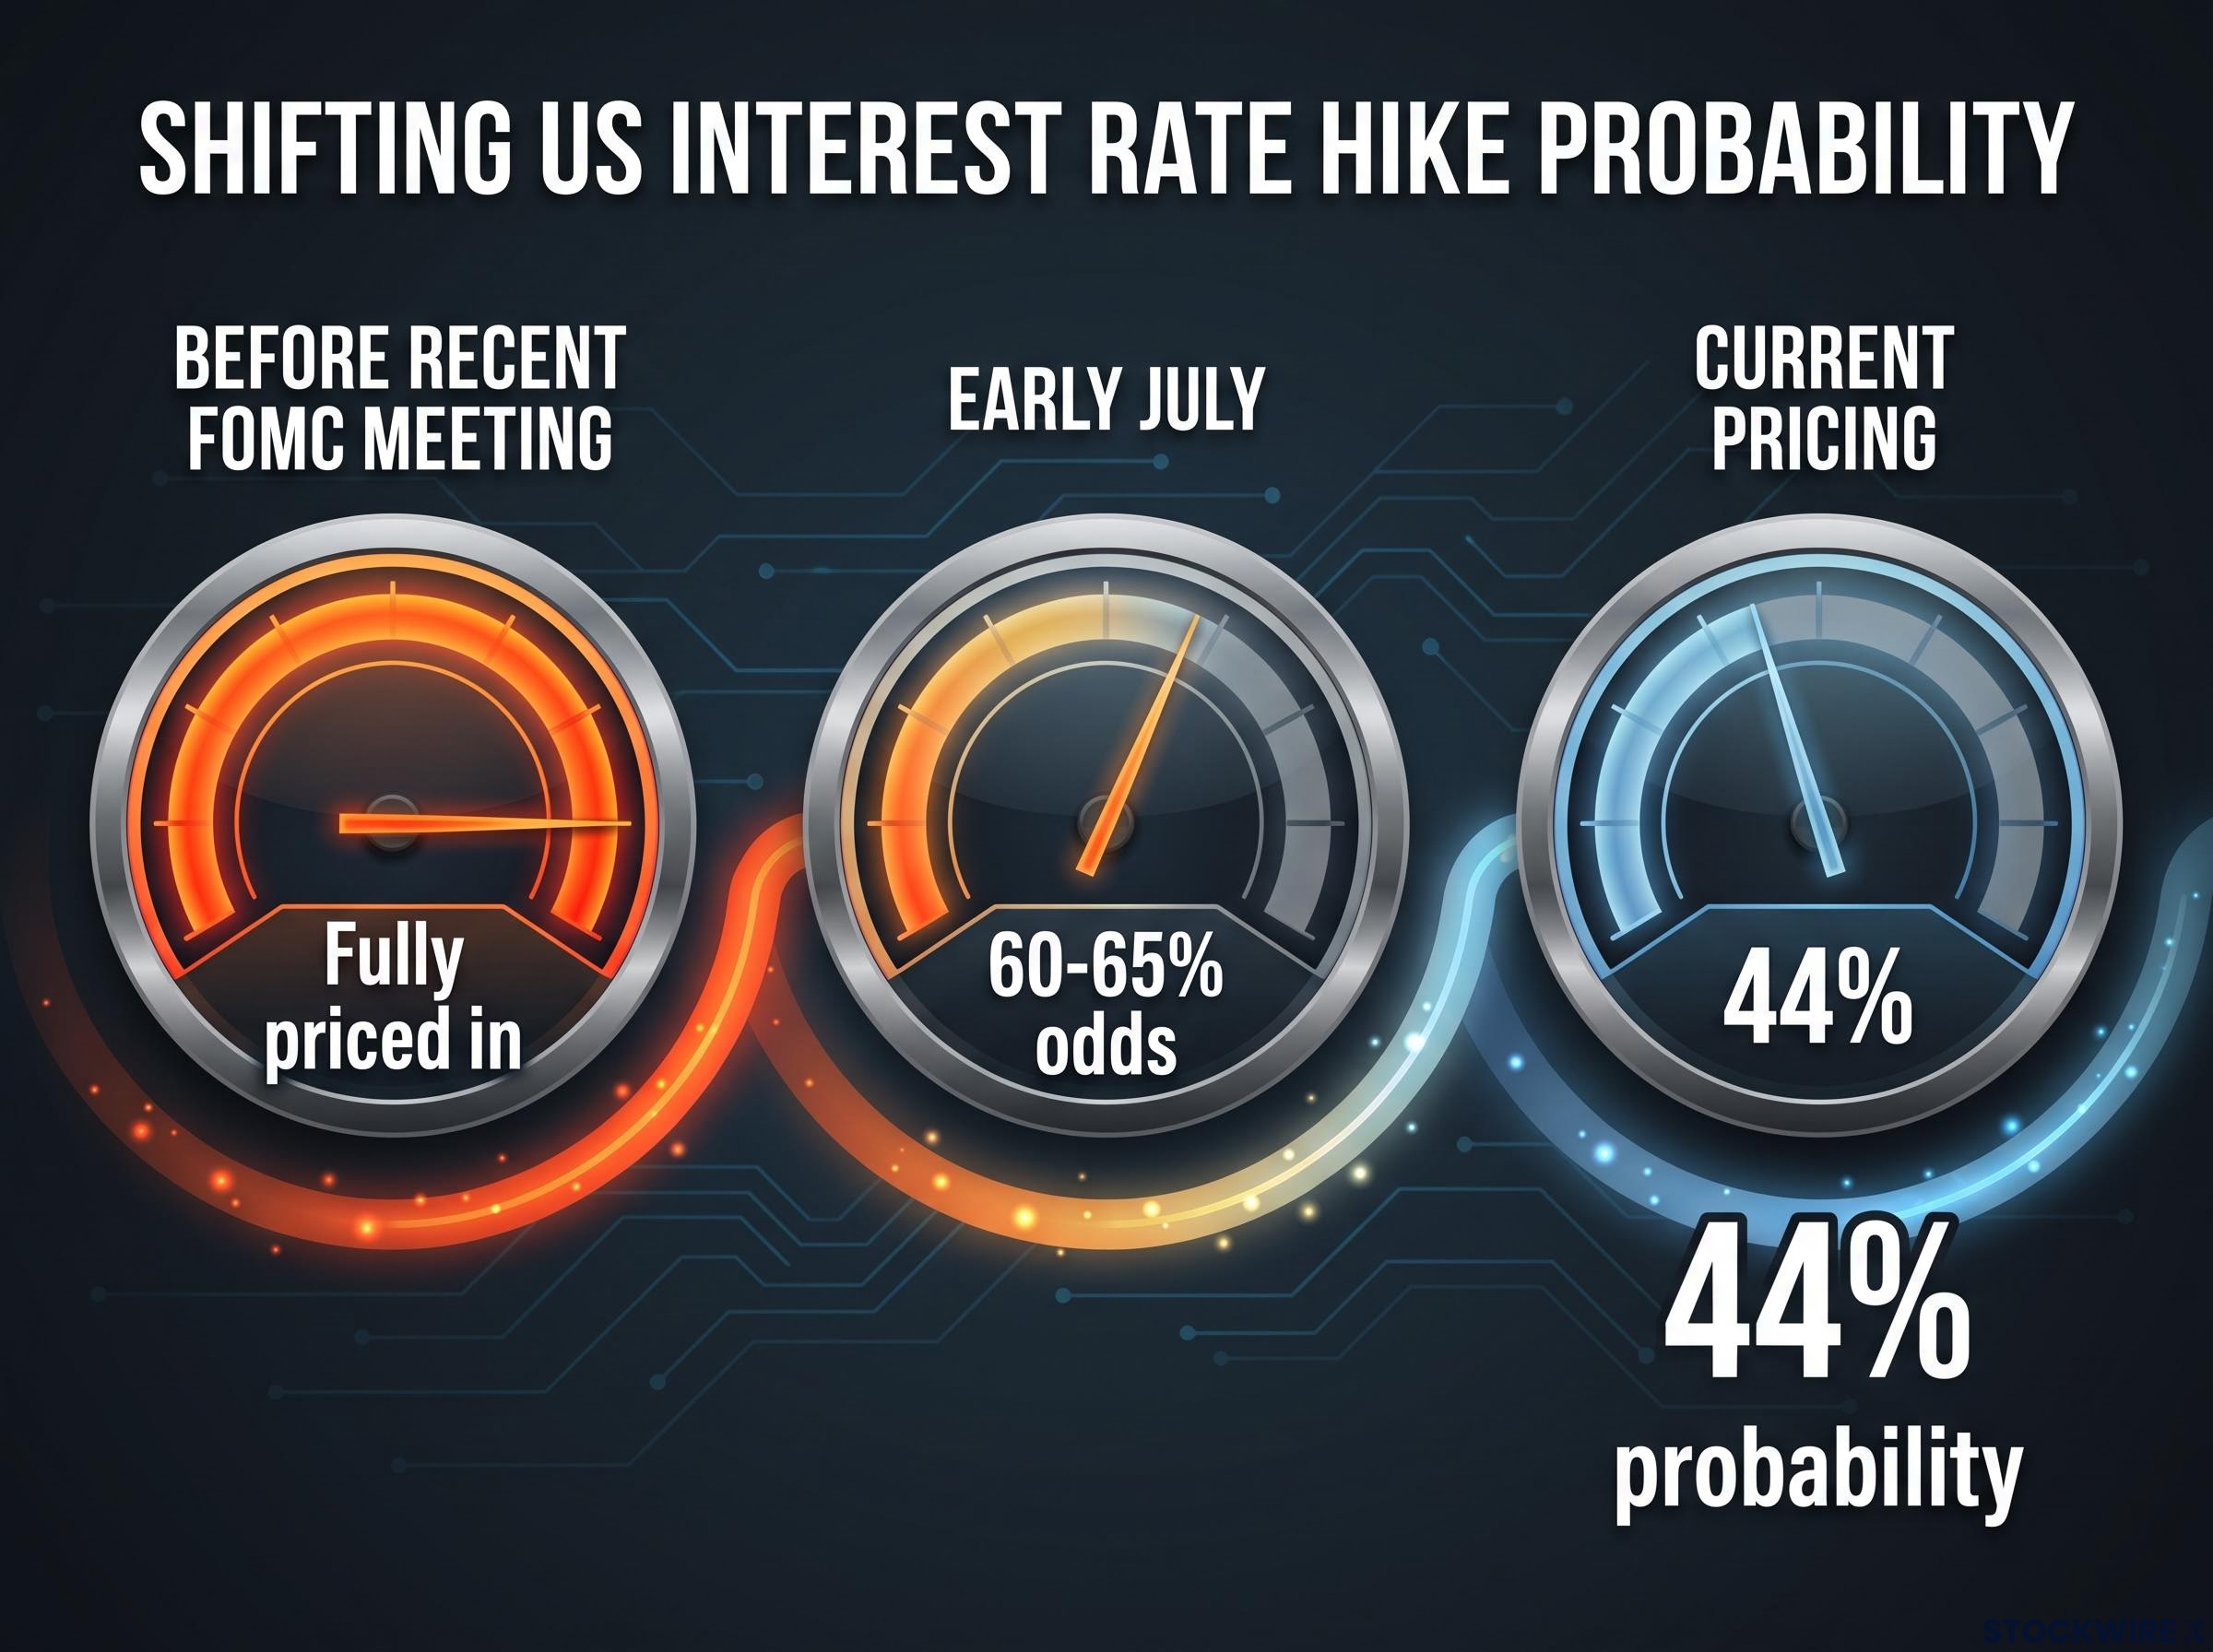
The gap between 44% and 50% is narrow enough that a single data print can swing the market’s modal expectation from “no hike” to “hike,” or the reverse. That is precisely why the stakes on Wednesday morning are unusually high.
Fed Chair Kevin Warsh’s communication style has compounded the sensitivity. The relative lack of clarity in his forward guidance has left markets with wider latitude to draw their own conclusions from incoming data, a dynamic that tends to produce sharper price moves when significant releases land. Multiple Fed officials have recently leaned hawkish even as the data has softened, leaving rate expectations in a genuine tug-of-war between the numbers and the rhetoric.
Some forecasters now place the base case at the Fed holding rates through year-end, but they frame it as roughly a 60/40 split, hardly a settled question.
The three scenarios that will drive market reaction
Wednesday’s outcome is not binary. Three structurally distinct scenarios carry different consequences for Fed policy and market positioning.
| Scenario | Core CPI (YoY) | September hike odds | Primary market implication |
|---|---|---|---|
| A: Soft | 2.5% or lower | Likely well below 40% | Focus shifts to potential 2027 cuts rather than further 2026 hikes |
| B: In-line | Approximately 2.6% | Stays in 40-60% range | Subsequent NFP and PCE data become decisive |
| C: Hot | 2.7% or higher | Likely moves back above 50% | Hawkish desk calls for at least one more 2026 hike |
Scenario A is the consensus base case. If it lands, the disinflation narrative that began with June’s surprise would gain a second data point, and the conversation would shift from “will they hike again?” to “when do they start cutting?” Scenario B gives the Fed neither comfort nor a warning, leaving subsequent releases to settle the question. Scenario C is the one that changes the mood. A hot core print would undo much of the dovish repricing triggered by June and validate the hawkish faction that has been warning about sticky underlying price pressures.
If you hold rate-sensitive assets, the distinction between these three outcomes is not academic. Each one maps to a different set of portfolio implications that you can prepare for before the number drops.
What this means for the dollar, gold, and equities
The cross-asset reactions to Wednesday’s data are not independent of each other. They are all expressions of the same underlying shift in real yield expectations, the return investors earn after accounting for inflation. Understanding that single mechanism puts you in a stronger position to interpret any asset’s move rather than treating each market’s reaction as a separate event.
The yield curve steepening that followed the July 29 FOMC meeting reflects a specific credibility concern: investors are pricing a higher long-run inflation risk premium under Warsh even as short-term rate expectations remain fluid, a split that complicates the dollar and bond market reactions the Wednesday print will trigger.
US dollar:
- A soft print would push Treasury yields lower and weigh on the dollar, particularly against currencies whose central banks remain relatively hawkish
- A hot print would support the dollar as pricing for higher US real yields rises
- Should dollar weakness emerge, the 200-day simple moving average at 99.18 represents the first meaningful technical floor for price to test on the downside
Gold:
- Gold tends to move inversely with real yields. A soft CPI reinforcing the disinflation trend would likely add further momentum to gold’s rally, building on the gains and the upside technical breakout that characterised last week’s trading
- A hot print would create a headwind via higher expected real rates and a stronger dollar
Equities:
- A disinflationary print would strengthen the narrative that the Fed is near or at the end of its tightening cycle, positive for valuations in rate-sensitive sectors such as technology, utilities, and real estate
- A hot print would pressure growth stocks and long-duration assets as markets price a higher terminal rate and a longer period of restrictive policy
June’s CPI provided a live preview of this dynamic. Softer data immediately cut hike odds, pushed yields lower, and supported equities, even as commentary emphasised the Fed was unlikely to cut rates soon.
What Wednesday changes, and what still lies ahead
Even a perfect soft print on Wednesday does not close the debate. The Fed’s data-dependency framework means one report narrows the range of outcomes without eliminating uncertainty. Here is what still stands between now and the September decision:
- July CPI: Wednesday, 12 August
- Jackson Hole symposium: end of August 2026
- Additional non-farm payrolls (NFP) data due before the September meeting
- Additional CPI data due before the September meeting
- September FOMC meeting: mid-September
A sequence of soft core prints, June plus July and beyond, would be required to shift markets decisively toward discussing 2027 rate cuts. A reversal, with core re-accelerating, would validate the hawkish faction and keep “at least one more hike” firmly on the table for late 2026.
Jackson Hole is particularly significant. It is where the Fed can signal whether it intends to treat the incoming data as a trend or as insufficient evidence, regardless of what the numbers show. Knowing what Wednesday can and cannot settle is itself useful information for positioning.
Bank of America strategist Michael Hartnett has flagged the Jackson Hole inflection point as a date to reduce exposure ahead of, naming 28 August as the moment when the Fed’s credibility narrative and the inflation data sequence converge into a single high-stakes policy signal for the rest of 2026.
This article is for informational purposes only and should not be considered financial advice. Investors should conduct their own research and consult with financial professionals before making investment decisions. Past performance does not guarantee future results. Financial projections are subject to market conditions and various risk factors.
—