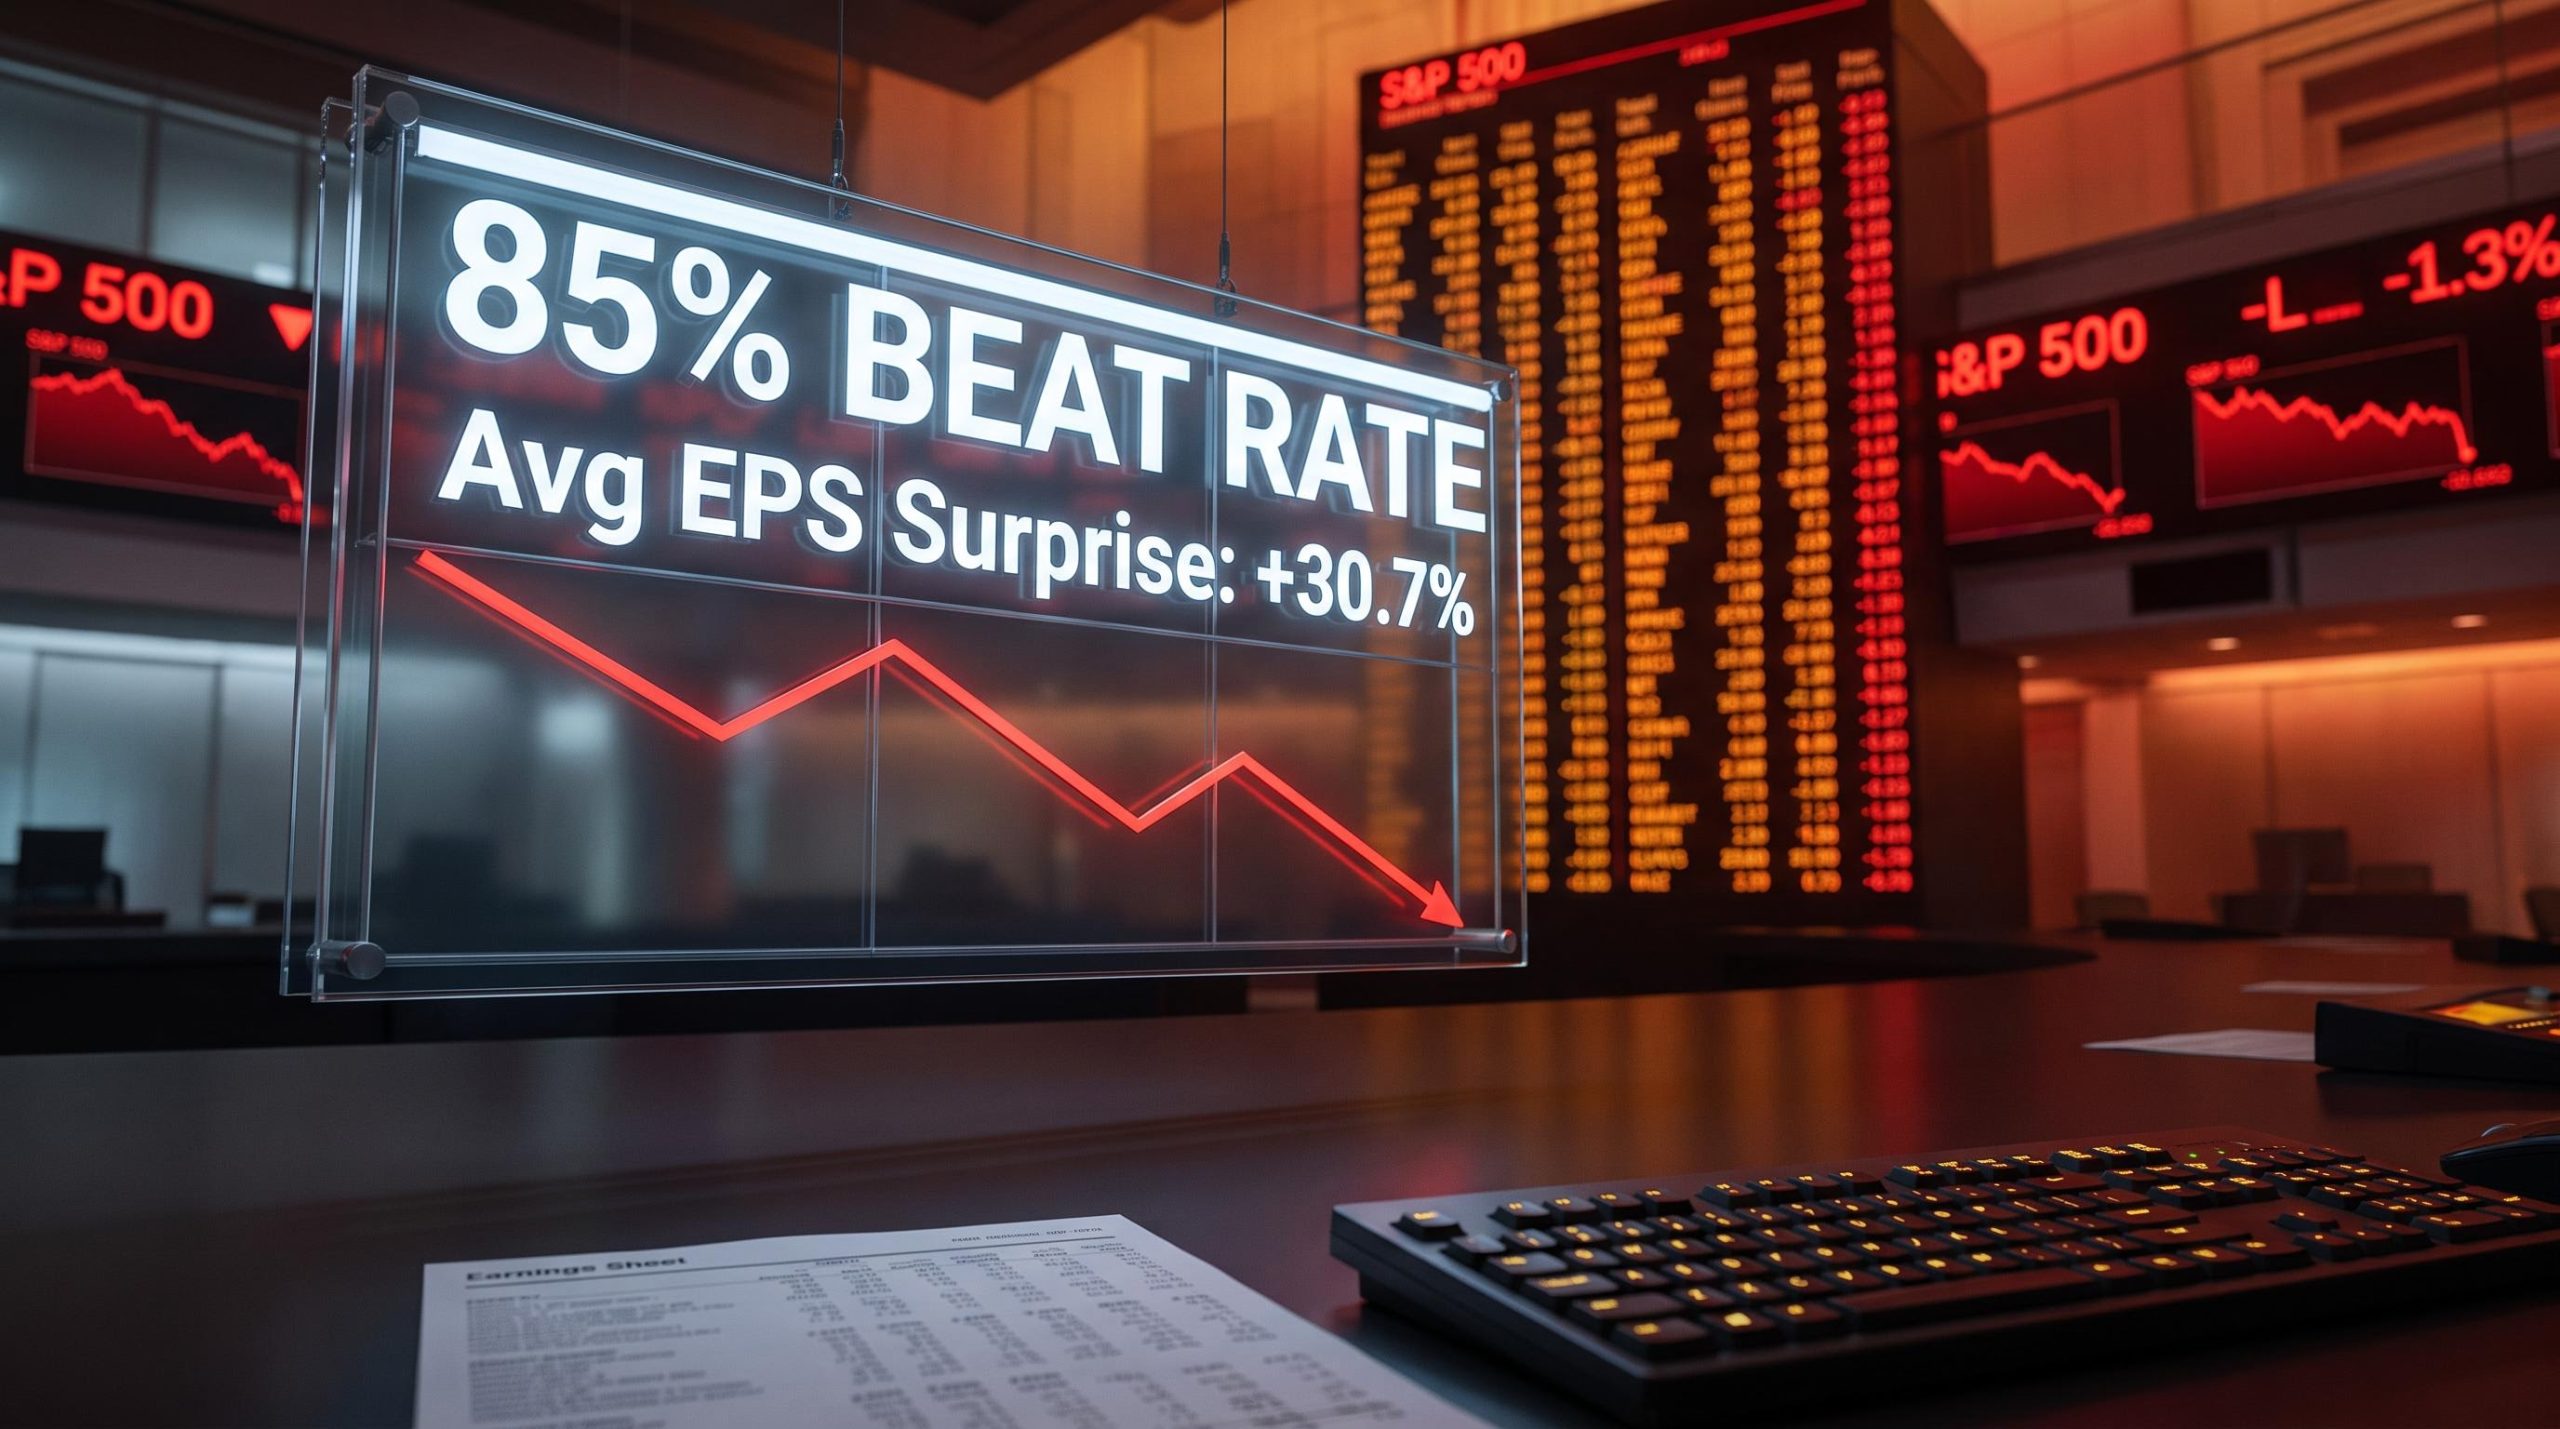
The S&P 500 just posted its strongest quarter of earnings growth since the post-pandemic boom. 85% of companies beat estimates. The average earnings surprise came in at 30.7%, roughly six times the historical norm. By every conventional measure, this should be a quarter that lifts stocks.
It is not. With the Q2 2026 reporting period winding down, the numbers are not the problem. The problem is what the market is choosing to do with them. Stocks are falling on beats and misses alike, and the two forces behind that reaction, overstretched positioning and a deepening skepticism around artificial intelligence capital expenditure, are reshaping how price responds to fundamentals in real time.
Here is what this piece gives you: a framework for assessing whether the muted price reaction signals a temporary positioning unwind or a structural repricing of how the market values AI-era earnings, and what that distinction means for how you think about U.S. equity exposure through the rest of 2026.
Records on paper, red on the screen
The headline numbers do not leave much room for ambiguity. Blended S&P 500 earnings growth came in above 50% in Q2 2026, the strongest since the post-pandemic recovery, according to FactSet’s August 2026 update. According to Barclays analysts led by Venu Krishna, the season’s beat rate of 85% sits well above the long-run average of around 76%. Q2 revenue expansion is running at its highest pace since Q4 2021, per FactSet’s week of 16 August 2026 update.
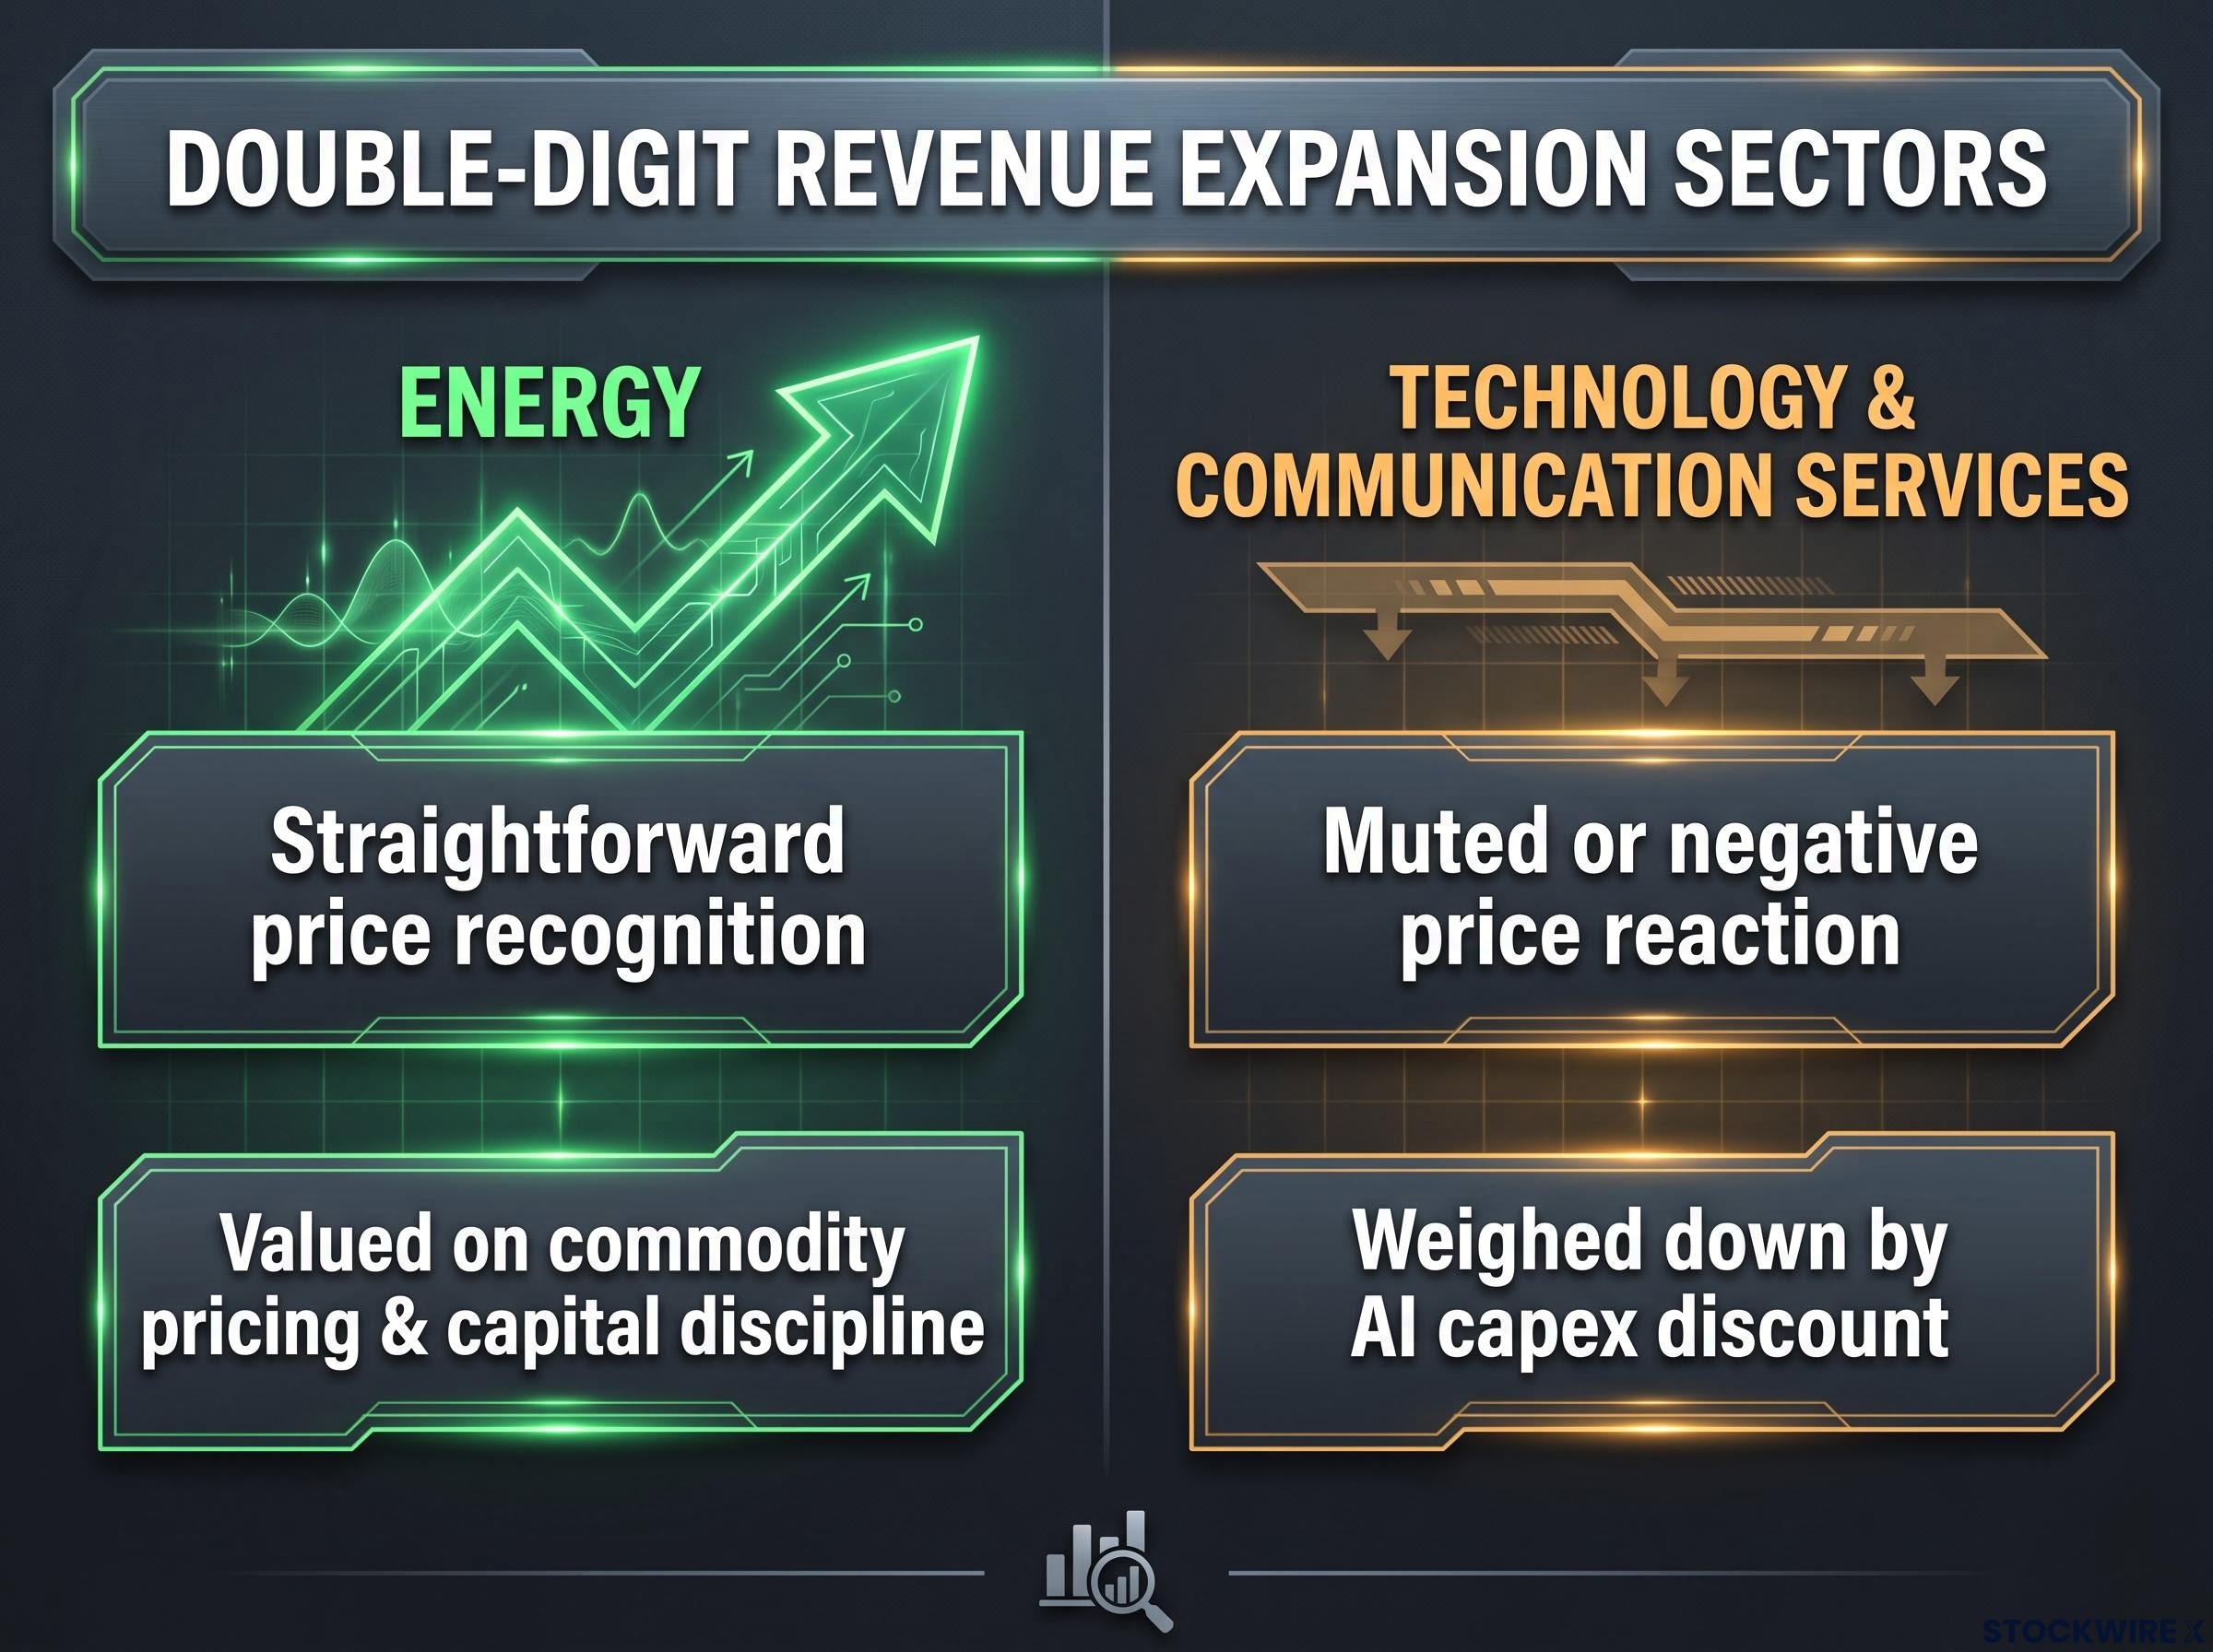
This was not a one-metric fluke. The energy, technology, and communication services sectors each recorded double-digit revenue growth in Q2, underpinning the breadth of the quarter’s outperformance.
Earnings growth broadening beyond the Magnificent Seven is one of the structural forces making Q2 2026 results genuinely unusual: the median Russell 3000 stock delivered 15% profit growth, and 76% of industry groups recorded positive upward revisions, meaning the quarter’s fundamental strength is real even if the market’s price response has been muted.
The scale of the surprise: The average EPS surprise magnitude reached 30.7% in Q2 2026, versus a historical norm of approximately 5-7%. That is roughly six times the long-run figure.
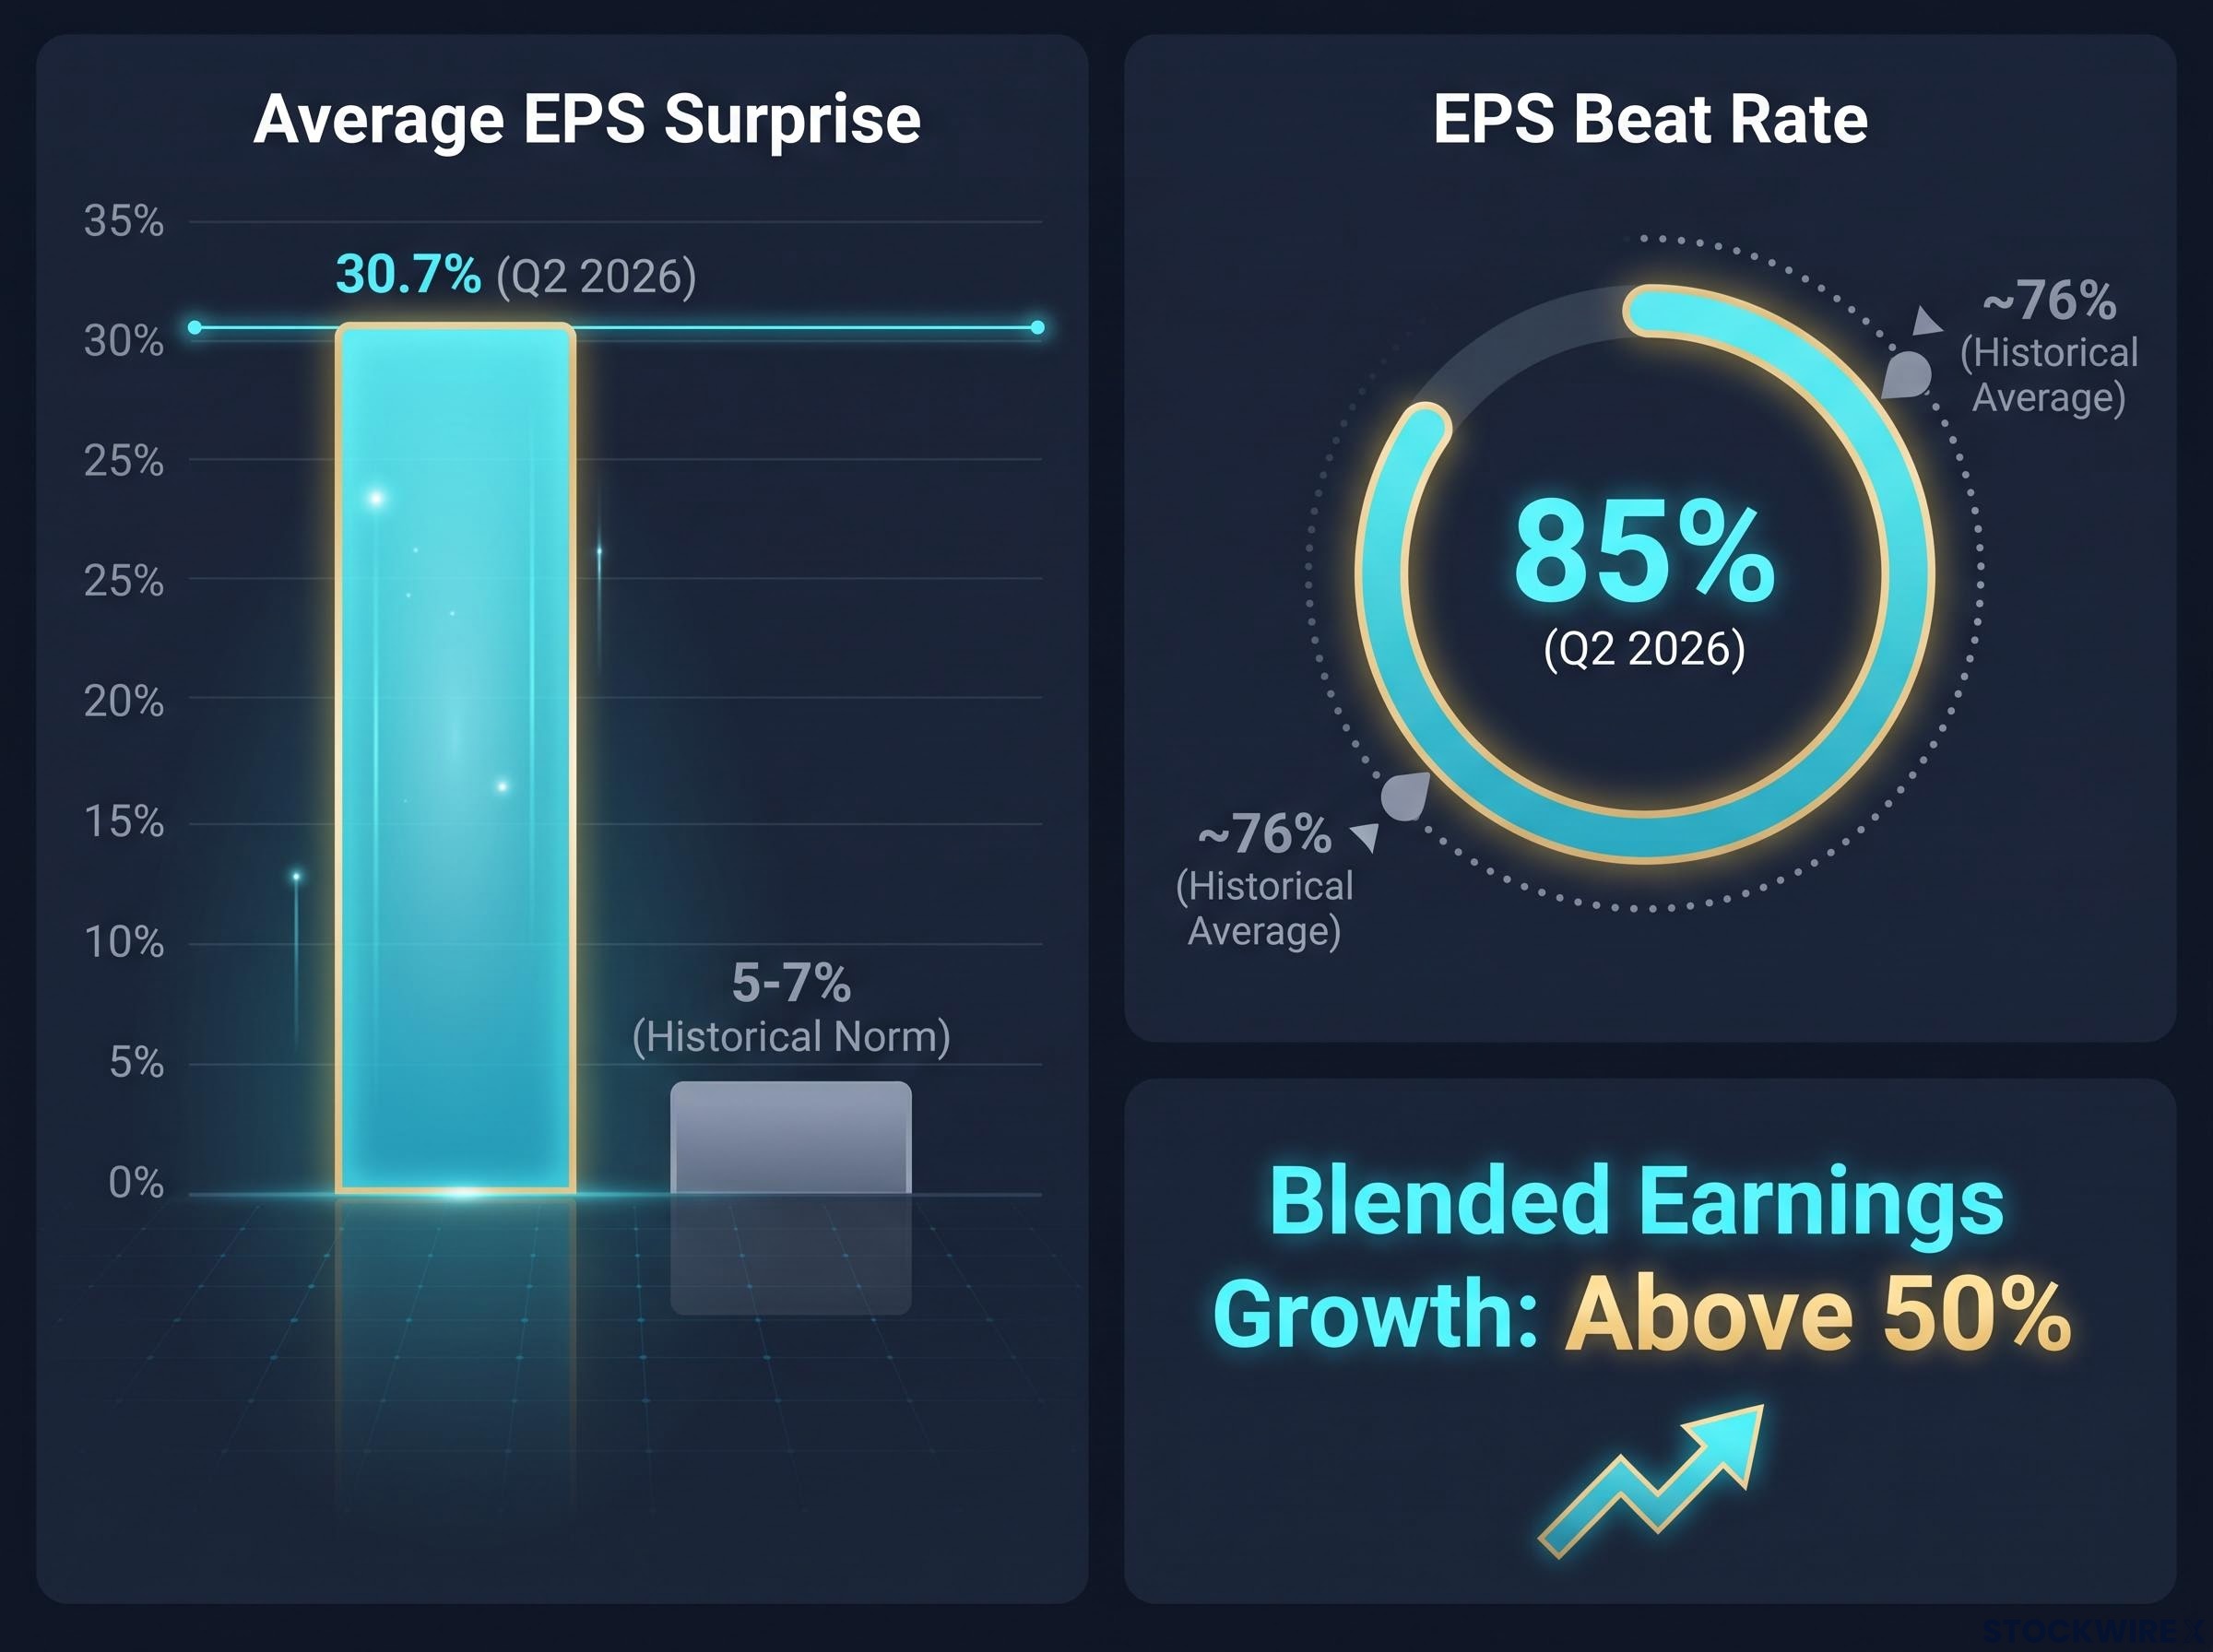
| Metric | Q2 2026 Figure | Historical Benchmark | Source |
|---|---|---|---|
| Blended S&P 500 earnings growth | Above 50% | Strongest since post-pandemic boom | FactSet, August 2026 |
| EPS beat rate | 85% | ~76% long-term average | Barclays (Venu Krishna) |
| Average EPS surprise magnitude | 30.7% | ~5-7% historical norm | Barclays (Venu Krishna) |
| Revenue expansion rate | Strongest since Q4 2021 | Q4 2021 | FactSet, week of 16 August 2026 |
| Top sectors by revenue expansion | Energy, tech, comms services | Each double-digit growth | FactSet |
Taken together, these metrics describe a quarter that should, by any conventional playbook, be driving stocks higher. That makes the market’s actual response the story worth understanding.
When big ASX news breaks, our subscribers know first
How the usual rules stopped working this season
The traditional pattern is straightforward: beat estimates, stock rallies; miss estimates, stock sells off. In Q2 2026, that pattern broke. Barclays analysis found that this season has been unusual in producing negative price reactions to both beats and misses. In prior quarters, the asymmetry ran in one direction: shortfalls were penalised harder than beats were rewarded. This quarter, even companies clearing the bar have faced selling pressure.
Post-earnings price moves respond to the gap between actual results and prior expectations, not to whether the numbers are good or bad in absolute terms, which is why the Q2 2026 beat rate of 85% has not produced the sustained rally the headline figure might imply.
The effective bar companies needed to clear was not just “beat estimates.” To avoid a sell-off, a company increasingly needed to:
- Beat EPS and revenue expectations
- Raise forward guidance
- Provide credible, near-term visibility on AI monetisation and free cash flow
Anything short of that combination produced a shrug or a sell-off. Clearing the bar often only prevented a decline; it rarely generated a sustained rally.
For you, this means the market has effectively changed the rules mid-season. Watching the old scoreboard, whether a company beat or missed, tells you less than understanding the new one.
What the options market was pricing in
Part of the breakdown sits in the options market. Barclays data revealed that the price swings the options market anticipated ahead of earnings results came in higher than the moves that actually materialised, with the gap most visible in the Utilities and Technology sectors. When those anticipated swings failed to materialise, implied volatility deflated. The resulting flow dynamic, where options dealers and institutional investors de-risk after the expected catalyst underwhelms, suppressed price reactions even on genuinely strong numbers.
What “record beats” actually mean when everyone already knows
The positioning story is mechanical, and that is what makes it useful. When a large share of institutional investors is already heavily long the expected winners before a print, there is no incremental demand pool to push prices higher when good numbers land.
Barclays analysts led by Venu Krishna pointed to crowded positioning and growing scrutiny of AI capital expenditure as the primary drivers behind the breakdown in the relationship between earnings results and share price reactions. The practical consequences play out in two specific ways:
- Gains harvested into strength: Investors who bought early take profits around the earnings print, turning reporting day into a liquidity event rather than a buying opportunity.
- Outsized selling on any disappointment: Any shortfall on guidance, margins, or headline numbers triggers disproportionate selling because there is no cushion of under-ownership to absorb the surprise.
Barclays analysts led by Venu Krishna framed the market’s predicament as one where fully committed positioning left no marginal buyer to absorb good news, with that dynamic made worse by intensifying doubts over whether AI capital spending will deliver returns on the expected timeline.
A stock falling after a strong earnings beat is not necessarily a verdict on the company’s fundamentals. It can be a mechanical consequence of the market’s own positioning, which is a different kind of risk to manage, and one that does not show up in any earnings release.
Why the AI spending boom is now a liability as much as a tailwind
The market has moved from a “trust the AI story” stance to a “show me the returns” stance, and that shift sits at the centre of why technology and communication services names posted strong Q2 numbers and still drew muted or negative price reactions.
The mechanics are visible in the cash flow statements. High, front-loaded AI capital expenditure is depressing free cash flow now, while the monetisation case remains a future-tense story. Strong AI-driven revenue growth does not automatically earn a premium valuation when:
Goldman Sachs data on AI capex vs monetisation shows hyperscaler capital expenditure absorbing 93-94% of operating cash flow in 2026, up from 33-40% just three years earlier, which is the structural backdrop that makes management commentary on return timelines so consequential in current earnings calls.
- Margins are under pressure from heavy capex spending
- Incremental guidance is cautious on profitability or utilisation rates
- Management commentary emphasises spending and capacity more than realised monetisation
The downside scenario: If AI and data-centre capex slows relative to expectations, Barclays estimates the S&P 500 could face a mid-single-digit EPS headwind and a 10-13% valuation de-rate, with AI beneficiaries seeing even larger multiple compression.
The market’s specific concern is not that AI spending is happening. It is that power constraints, efficiency gains, or weaker demand could reduce the compute need and shrink the payoff path before the spending cycle delivers the returns it was priced for.
For you, the practical implication is that technology and communication services stocks beating estimates are not necessarily buys right now. The market is pricing the risk that the AI build-out is over-earning in narrative and under-earning in cash flow, and that repricing is not yet complete.
The sectors leading the quarter and the bifurcated price story
Three sectors drove Q2 2026’s earnings strength, each with double-digit revenue expansion per FactSet:
- Energy: Strong commodity-driven revenue growth
- Technology: AI and cloud-powered earnings expansion
- Communication services: Digital advertising and platform revenue acceleration
The contribution to the quarter’s headline numbers was broadly shared. The market’s willingness to reward that contribution was not.
Where the market is and is not giving credit
Energy, which does not carry the AI capex skepticism overhang, received more straightforward price recognition for its results. The fundamental story there, commodity pricing and capital discipline, is a simpler equation the market is comfortable valuing.
Technology and communication services, by contrast, faced the AI capex discount. Per Barclays analysis, these were the sectors where the price-reaction disconnect was most pronounced. The market is applying two different valuation lenses to Q2 results depending on AI exposure, not simply rewarding or punishing sector performance uniformly.
For you, sector membership matters more than headline beat rates right now. A 90% beat rate in a sector under an AI capex cloud carries less price-reaction value than a 75% beat rate in a sector the market is not currently repricing for capex risk.
What resolves the standoff, and what to watch from here
Historically, periods where fundamentals are strong and prices are weak resolve via one of two paths:
- A catch-up rally when positioning normalises and investors regain confidence in earnings durability. This is the path where the current disconnect looks temporary and the fundamental strength re-asserts itself.
- A deeper reset if AI capex skepticism broadens into wider concerns about overall profitability and returns on invested capital. This is the path where the market decides the spending cycle has overshot realistic demand.
The differentiator for the remainder of 2026 is not whether companies can grow revenue. That question is answered. The differentiator is whether they can demonstrate that today’s extraordinary AI spending is translating, on a credible and visible timeline, into tangible earnings and free cash flow.
The signals to watch when the next major tech or AI-exposed company reports:
- Management commentary on monetisation timelines, not just capacity build-out
- Free cash flow trajectory guidance, not just revenue growth
- Evidence that capex is translating into realised revenue rather than future-period promises
The question is no longer “did they beat?” It is “did they close the monetisation credibility gap?”
This article is for informational purposes only and should not be considered financial advice. Investors should conduct their own research and consult with financial professionals before making investment decisions. Forward-looking statements, including scenario analysis from Barclays, are speculative and subject to change based on market developments and company performance.
Strong numbers, a skeptical market, and an unresolved question about AI returns
Crowded positioning and AI capex skepticism are not separate phenomena operating independently. Each amplifies the other: when the market is fully committed to the AI theme at the same time that confidence in the return timeline for AI spending is fading, even strong earnings prints become occasions to reduce exposure rather than add to it.
The fundamental case is not in question. An 85% beat rate and a 30.7% EPS surprise magnitude describe a quarter of genuine corporate strength by any historical measure. U.S. companies earned more than the market expected, by a wider margin than usual, across more sectors than usual.
What the market is repricing is not the ability of these companies to grow. It is the terms of the bet: at what cost, on what timeline, and with what confidence in the return on today’s extraordinary spending. That is not a rejection of the underlying business performance. It is a renegotiation of what investors are willing to pay for a story that has not yet closed the gap between capital deployed and cash returned.
That distinction, between fundamental quality and valuation narrative risk, is the one that matters most for how you hold or evaluate positions through the rest of 2026.
For investors wanting to understand how crowded AI sentiment translates into a structural return headwind, our full explainer on the AI expectations gap applies the Howard Marks and Damodaran framework to current positioning data and identifies where consensus overpricing is most concentrated.
—