AI Stocks Split in Two as CoreWeave Falls 14% and Meta Surges 9%
4 hrs ago

The three-month moving average of US unemployment sits at a Sahm Rule reading of 0.10 in May 2026, down from 0.30 in January. That single number tells you more about where the economy actually is right now than most of the recession commentary circulating in financial media.
Heading into the second half of 2026, the macro evidence is not clean. Recession probability estimates from major forecasters cluster in the 30-35% range, high enough to demand attention but not high enough to justify defensive liquidation. The yield curve is positive but compressing. The Conference Board’s Leading Economic Index (LEI), a composite of forward-looking economic signals, is showing a slight uptick while still carrying negative six-month growth rates. Credit spreads are contained.
This is an amber-light environment, and amber lights are harder to navigate than red ones. Here is the framework for reading the actual signal from the noise: what the recession indicators are genuinely saying, what portfolio positioning fits this specific environment, and which three catalysts in early H2 2026 will most directly shape whether the amber light holds or turns red.
Start with the yield curve, the spread between the 10-year and 2-year Treasury yields. It spent the better part of two years inverted before moving back into positive territory in late 2024. As of mid-2026, it remains positive but has been compressing again. That configuration sits somewhere between “all-clear” and “recession imminent.” US corporate credit spreads, the premium that bond investors require above government yields to compensate for holding corporate debt, have stayed at relatively modest levels, indicating that markets have not moved to price in meaningful financial stress.
The LEI adds a layer. It rose 0.1% in May 2026 after a 0.2% gain in April, but it is still down 0.3% over the past six months, and both its six- and twelve-month growth rates remain negative.
The Conference Board’s own characterisation: the data “suggest[s] slower economic expansion ahead.”
Then there is the most precise gauge. The Sahm Rule measures whether the three-month moving average of unemployment has risen by at least 0.50 percentage points above its prior 12-month low. At 0.10, the current reading is not close to triggering. It has actually improved from 0.30 at the start of the year.
| Indicator | Current Reading | Recession Threshold/Signal | Status |
|---|---|---|---|
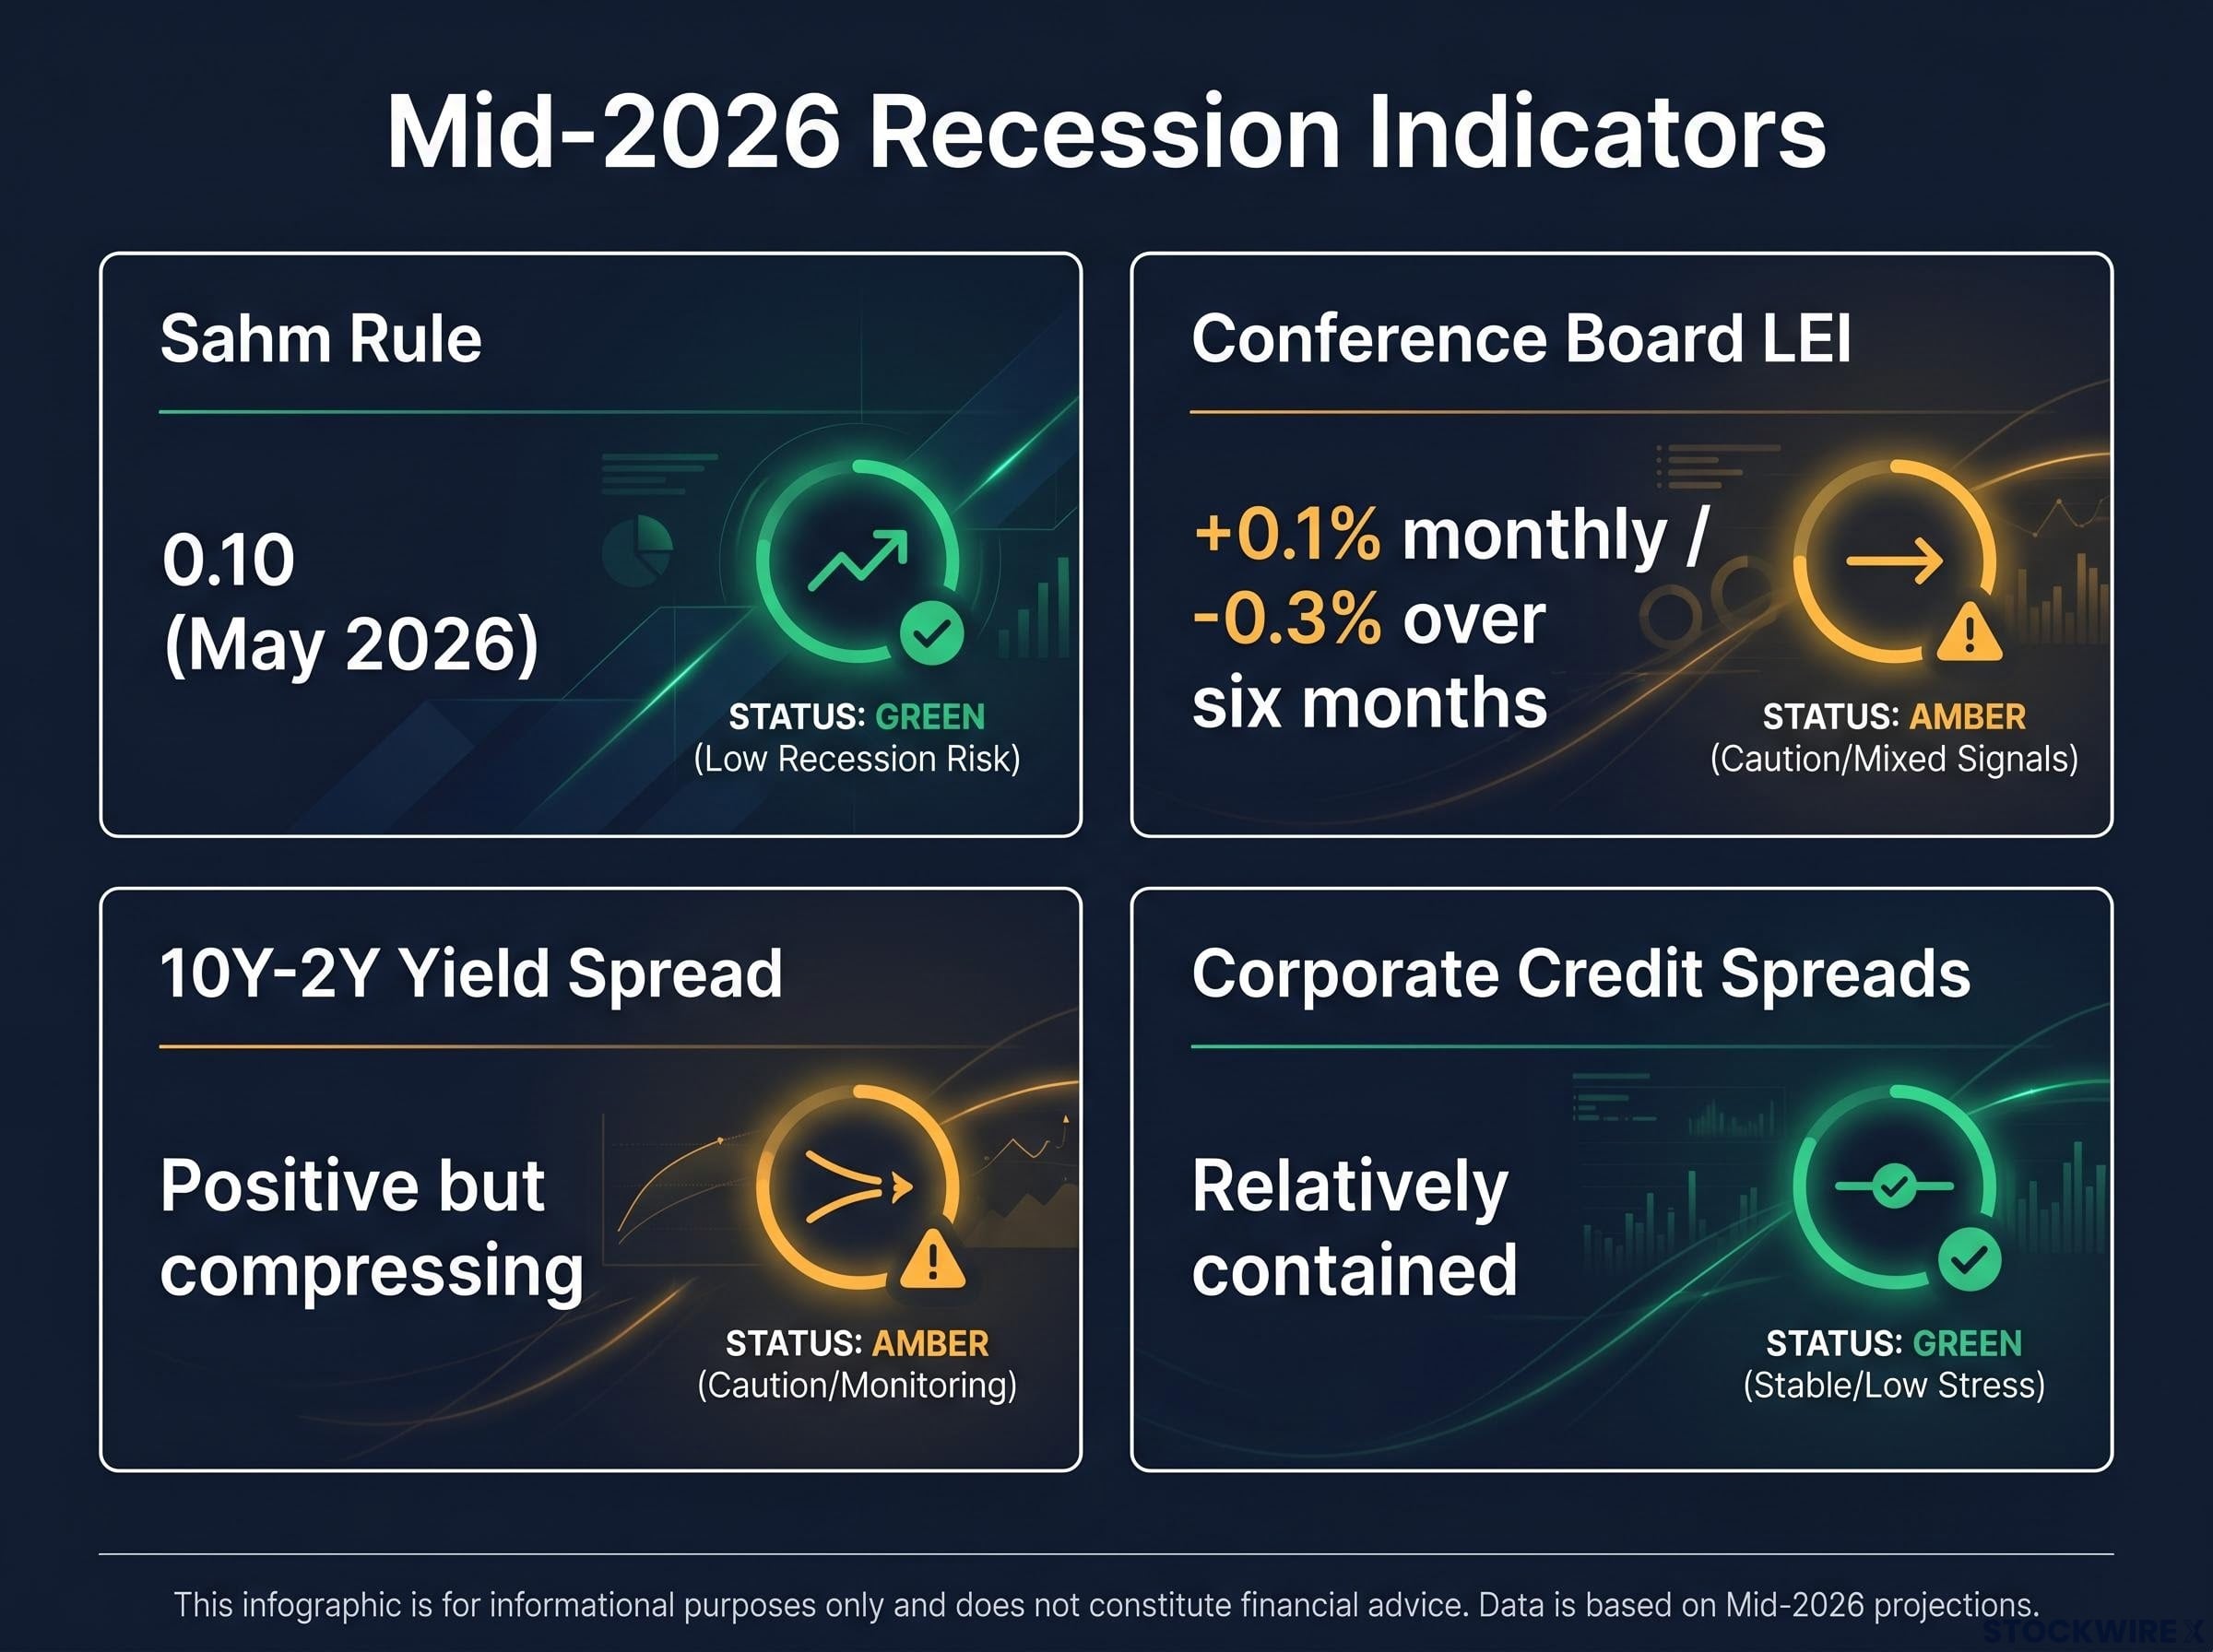
| Sahm Rule | 0.10 (May 2026) | 0.50 or above | Green |
| Conference Board LEI | +0.1% monthly; -0.3% over six months | Sustained negative six-month growth | Amber |
| 10Y-2Y Yield Spread | Positive but compressing | Inversion (negative spread) | Amber |
| Corporate Credit Spreads | Relatively contained | Significant widening | Green |
The cumulative read: the indicator stack does not give you permission to stop paying attention. It also does not give you permission to exit equities. Amber is a specific strategic position with its own portfolio logic, not a vague in-between.
Three major forecasters have converged on a narrow band:
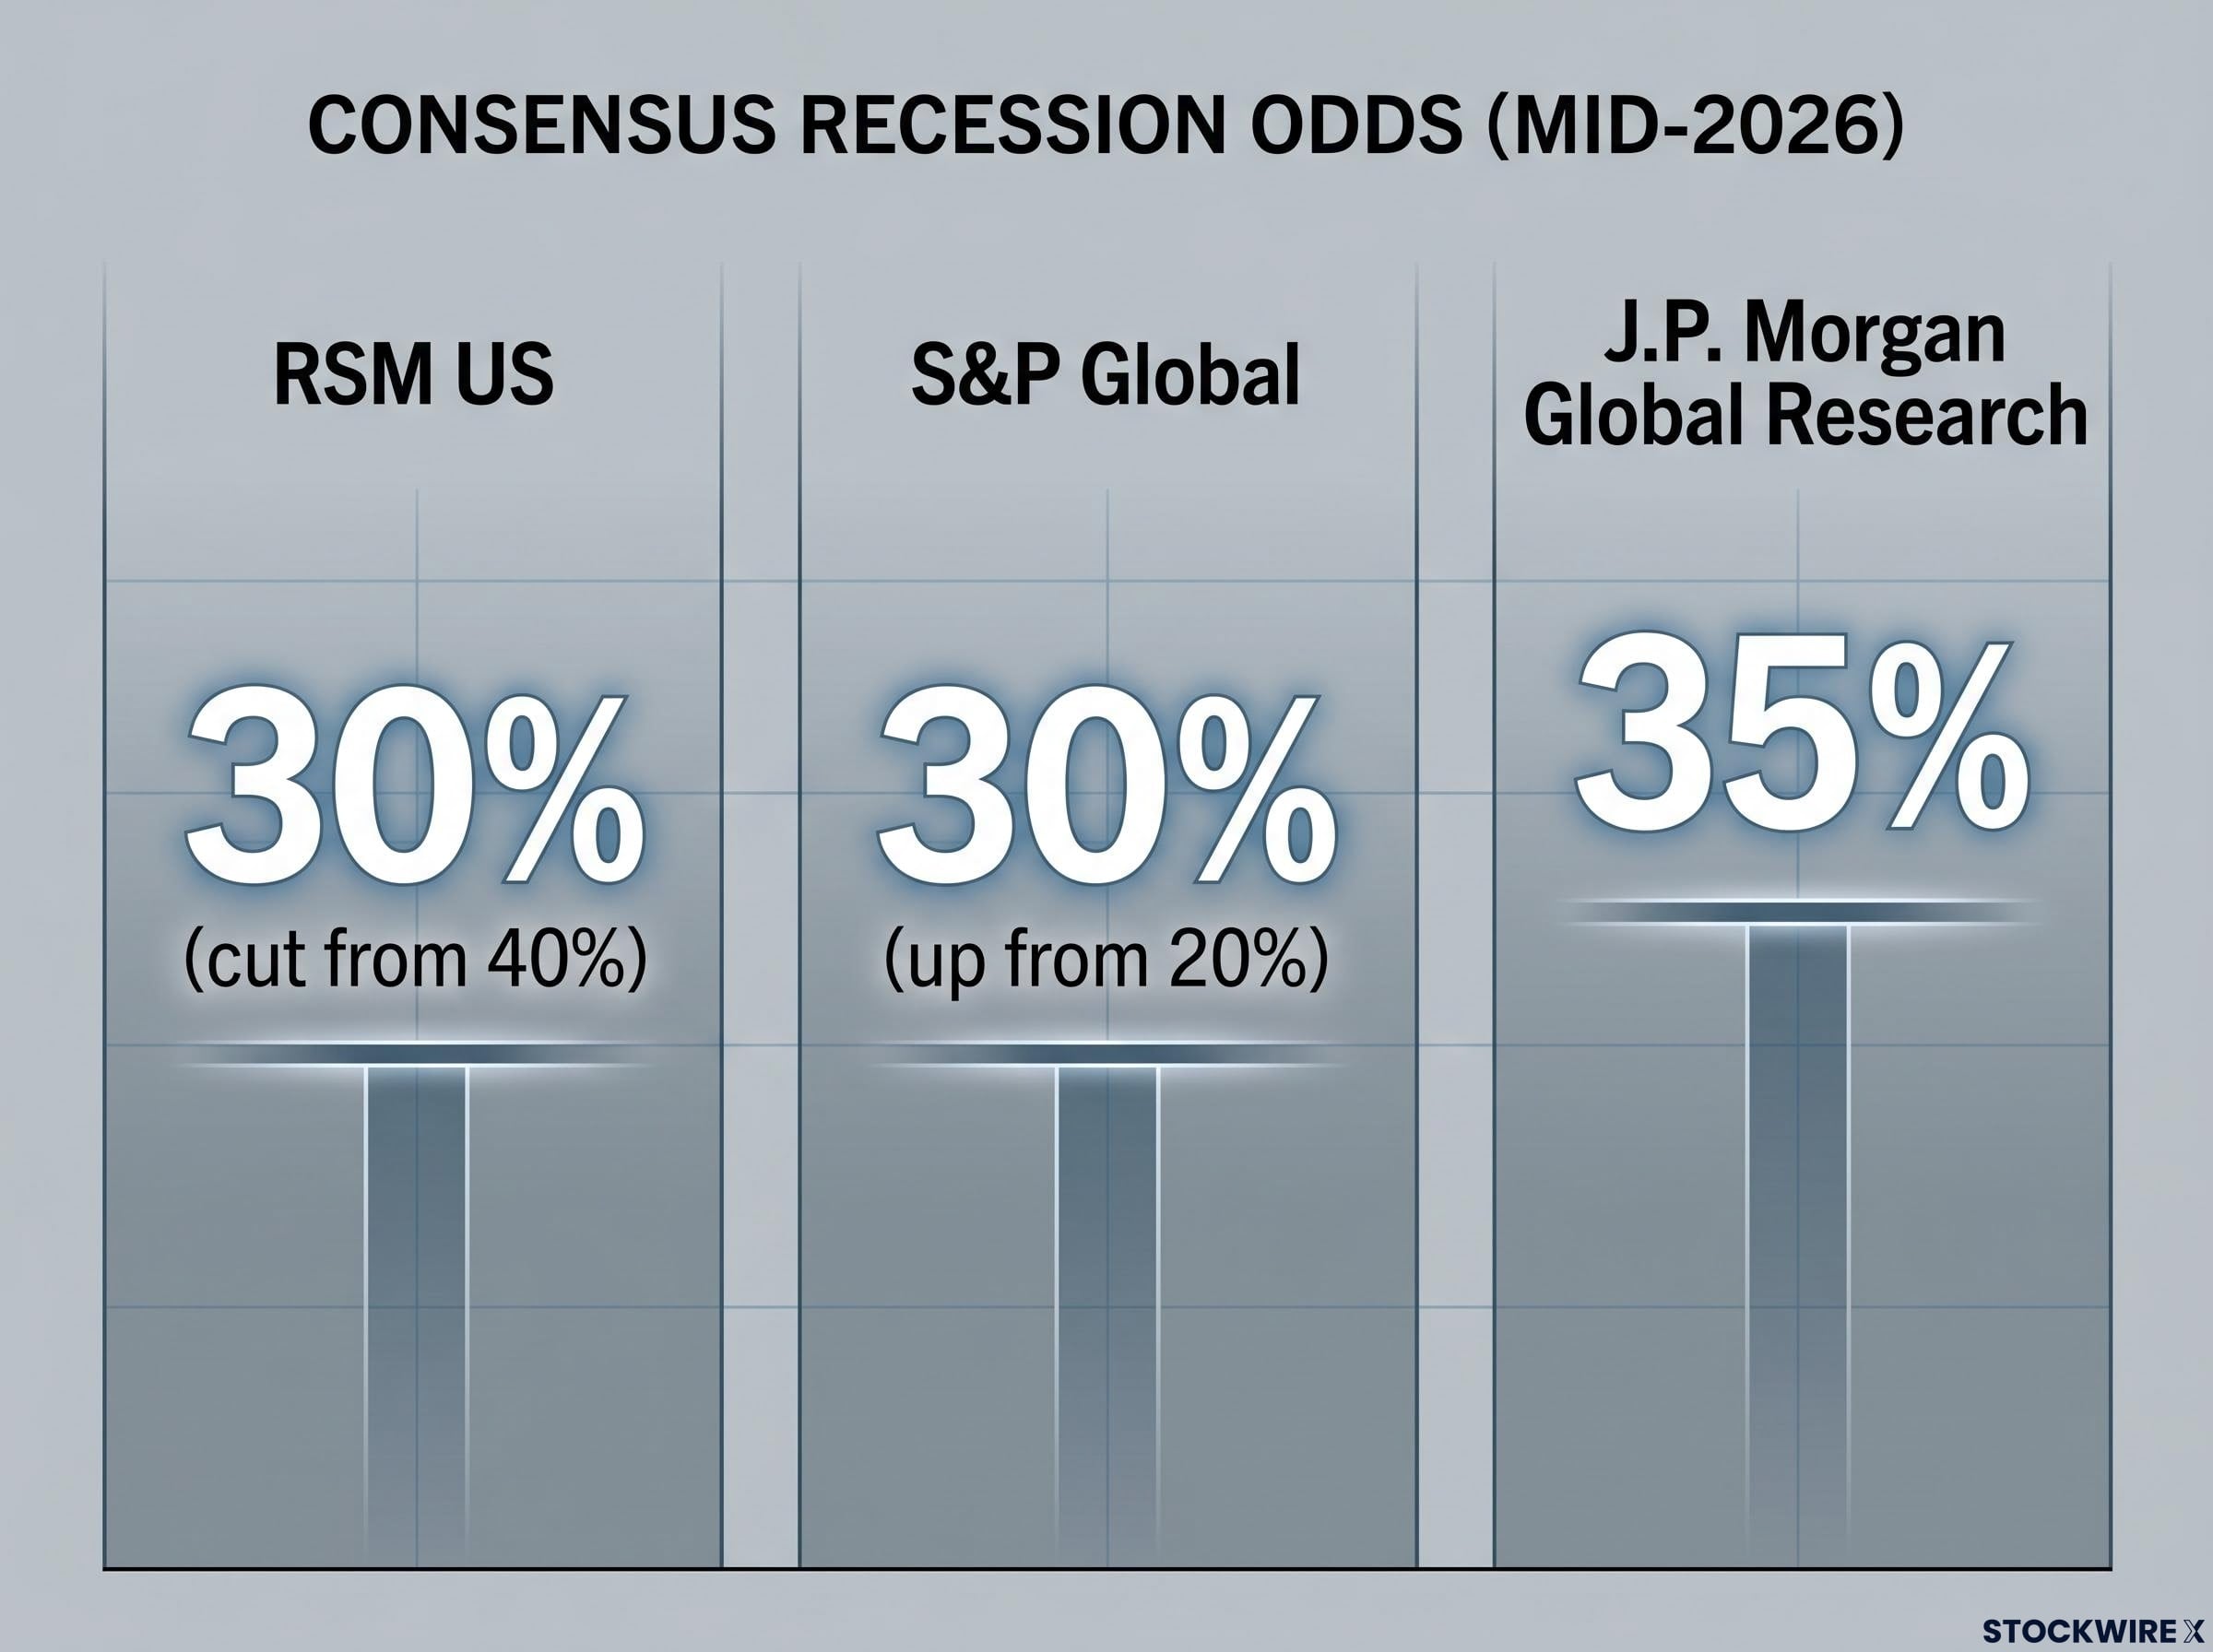
The directional improvement in RSM’s estimate is worth noting. Cutting from 40% to 30% signals the firm sees the trajectory improving, not worsening.
But here is what makes 30-35% operationally harder than a reading of 60% or higher. At 60-70%, the portfolio maths is clear: reduce cyclical exposure, extend duration, raise cash. The decision framework simplifies because the probability overwhelms the cost of acting too early. At 30-35%, you must hold genuine uncertainty in two directions simultaneously. Acting too defensively in a scenario that resolves constructively costs you real returns. Acting too complacently in one that deteriorates costs you more.
Some market commentators point to more aggressive warning signs, including certain market-based indicators breaking below long-term moving averages and the energy shock transmission risk flowing from the Middle East conflict that erupted in early 2026. These are not the consensus view, but they represent genuine tail risk that a 30-35% probability range does not fully capture in day-to-day portfolio thinking. The gap between the most bearish and most constructive forecasters is not analytical sloppiness. It is epistemic uncertainty. Positioning for this range means defining your triggers in advance rather than waiting for consensus to resolve.
For most of the 2010s, interest rates near zero meant equities were the only meaningful source of return. If you wanted yield, you had to take equity risk to get it. That structural pressure pushed capital into growth stocks, venture-stage names, and high-multiple sectors because there was nowhere else to earn a competitive return.
That world no longer exists. RSM forecasts the Fed funds rate falling toward 3%, with the 10-year Treasury yield hovering at or just above 4%. US Personal Consumption Expenditures (PCE) inflation, the Fed’s preferred inflation measure, is forecast at approximately 2.7% for 2026, above target but not destabilising.
At a 4% 10-year yield, investment-grade bonds and dividend-paying equities can deliver competitive total returns without requiring the market to re-rate higher. You are no longer forced into equities just to obtain yield.
This is not a temporary tactical call. It is a structural change in how balanced portfolios are constructed. A balanced allocation can now achieve reasonable return targets with materially less growth and volatility exposure than was required in the prior decade.
Equities remain investable, but the upside profile has shifted. In a slow-growth, moderate-inflation regime with a 2.2% GDP forecast, earnings can grow, but cyclicals tied to discretionary demand are more vulnerable. Elevated rates cap multiple expansion, which means the broad market is unlikely to re-rate sharply higher.
Defensive sectors (healthcare, consumer staples, quality utilities) and cash-rich technology and industrial names with demonstrated free cash flow are better positioned than rate-sensitive or highly speculative names. H1 2026 showed wide gaps between sector winners and losers, and that high dispersion is expected to continue. Selection matters more than direction in this environment.
Three catalysts in early H2 2026 map directly to different parts of a typical US investor’s portfolio.
| Catalyst | Key Metric(s) | Bull Reading | Bear Reading | Portfolio Impact |
|---|---|---|---|---|
| June US Employment Report (early July) | Nonfarm payrolls, unemployment rate, average hourly earnings | Stable hiring, contained wage growth supports soft landing | Rising unemployment and softer wages signal labour market deterioration | Fed rate path; rate-sensitive holdings |
| Early July PMI Surveys | Services PMI (above/below 50); manufacturing PMI | Stable or improving readings confirm gradual slowdown, not contraction | Services PMI below 50 corroborates LEI weakness, pushes recession odds higher | Cyclical equity weightings; growth expectations |
| Iran Ceasefire / Strait of Hormuz | Ceasefire compliance, Hormuz shipping volumes, crude oil price | Risk premia fade; energy inflation eases | Disruption spikes crude, re-ignites inflation, raises recession probability | Energy exposure; inflation assumptions |
The June jobs report is the highest-priority catalyst. Stronger data delays rate-cut expectations and supports domestic-demand cyclicals but pressures duration-sensitive holdings. Weaker data increases conviction the Fed is near the end of its cycle and supports Treasuries and high-grade credit.
The Purchasing Managers’ Index (PMI) surveys, which measure business activity levels with readings above 50 signalling expansion and below 50 signalling contraction, offer the first forward-looking read on H2 growth momentum. Given the economy’s services-dominant composition, the services PMI carries more weight than manufacturing.
The Iran ceasefire is asymmetric: its continuation is constructive but not a catalyst in itself. Its failure would be a significant negative shock. The conflict’s outbreak in early 2026 already demonstrated how quickly geopolitical disruption translates into fuel prices and broader inflation, pushing Germany’s Harmonised Index of Consumer Prices (HICP) inflation to 2.9%.
The near-term catalysts above are data points feeding into three larger questions. Their answers will define the full-year outcome.
If AI-linked earnings and productivity gains materialise on the timelines baked into consensus, a substantial portion of the equity complex can perform even in slow growth. If they disappoint, index-level repricing is the mechanism. The distinction between broad “AI exposure” as a theme and quality-screened positions based on balance sheet strength, free cash flow, and realistic adoption timelines matters more in H2 2026 than in prior years when multiple expansion could carry most names in the category.
These three conditions are not independent. An energy shock directly undermines inflation moderation and raises discount rates for growth stocks. You are watching an interconnected system, not three separate stories.
The amber-light characterisation is the operating premise. Not a liquidation signal. Not a stay-the-course signal. A deliberate-review signal that requires knowing exactly what you own and why.
Four checks to run through your holdings now:
Then define your triggers in advance:
The investor who can answer “what would change my positioning and at what level” is in a materially different position than the one waiting to see what happens.
This article is for informational purposes only and should not be considered financial advice. Investors should conduct their own research and consult with financial professionals before making investment decisions. Past performance does not guarantee future results. Financial projections are subject to market conditions and various risk factors.
Two things are structurally durable regardless of the next data print. The income asset opportunity at 4% yields has changed the portfolio construction equation for the foreseeable future. The diversification imperative under high dispersion is not a temporary call; it is the rational response to an environment where sector-level outcomes are diverging sharply.
What remains genuinely contingent: energy exposure hinges on ceasefire durability, AI and semiconductor weighting hinges on earnings evidence arriving on schedule, and cyclical allocation hinges on whether the amber signals in the LEI and PMIs stabilise or deteriorate.
The framework in this piece is designed to update as each catalyst lands. When the June jobs report arrives, when the PMIs print, when the next Hormuz shipping data surfaces, the indicator table above tells you exactly what to compare against. Use it as a living reference, not a one-time read.
These forward-looking statements are speculative and subject to change based on market developments and company performance.
—
The Sahm Rule triggers a recession signal when the three-month moving average of unemployment rises 0.50 percentage points above its prior 12-month low. At a reading of 0.10 in May 2026, down from 0.30 in January, it is well below the trigger threshold and is actually improving, not deteriorating.
RSM US, S&P Global, and J.P. Morgan Global Research have all converged on a 30-35% probability range for a US recession over the next 12 months, with RSM notably cutting its estimate from 40% to 30% alongside a 2.2% GDP growth forecast for 2026.
The amber-light environment favours defensive sectors such as healthcare, consumer staples, and quality utilities alongside cash-rich technology and industrial names with demonstrated free cash flow, while rate-sensitive and highly speculative positions carry more risk given elevated rates and wide sector dispersion.
At a 4% 10-year yield, investment-grade bonds and dividend-paying equities can now deliver competitive total returns without requiring equity risk, ending the near-zero rate era in which investors were structurally forced into growth stocks just to obtain any meaningful yield.
The June US employment report, early July PMI surveys (particularly the services PMI relative to the 50 expansion threshold), and the durability of the Iran ceasefire and Strait of Hormuz stability are the three catalysts most directly linked to recession probability, Fed rate policy, and inflation trajectory heading into H2 2026.