Two consecutive softer-than-expected inflation prints should not be read as the Fed’s inflation problem resolving itself. They should be read as a window.
June CPI (released 14 July) and June PPI (released 15 July) both came in below consensus, and traders responded exactly as expected: CME FedWatch showed scaled-back bets on a near-term rate hike, equities exhaled, and the mood shifted toward relief. But these numbers describe an economy that existed before Brent rebounded toward $85 a barrel, before the U.S. and Iran exchanged strikes on 15 July, and before AI-driven cost pressures had any chance to surface cleanly in aggregate price data. The relief is real. The all-clear is not.
What follows here is a map of the two specific forces most likely to reignite inflation pressure in the second half of 2026, the mechanism by which each would force the Fed’s hand, and a practical framework for deciding which signals to watch rather than which headlines to trust.
Two soft prints, and what they actually tell you
The June readings were not noise. CPI came in below expectations on 14 July; PPI undershot consensus the following day. Both prints pointed to cooling price pressures across goods and services categories, and the market response was immediate. CME FedWatch data showed traders marking down rate hike probability for the months following July 2026. That is a legitimate signal.
The June CPI report delivered a 0.0% month-over-month core reading, the largest downside miss relative to consensus in over a year, pulling the annual core rate from 2.9% to 2.6% and providing the immediate foundation for the market relief that followed.
- Brent Oil Futures: $84.81/barrel (as of 15-16 July 2026)
- WTI Crude Futures: $79.71/barrel
- U.S. 10-Year Treasury yield: 4.565%
- U.S. 30-Year Treasury yield: 5.10%
During his two-day Congressional testimony ahead of these releases, Fed Chair Kevin Warsh expressed a firm commitment to returning inflation to the 2% target, yet gave no indication of the specific policy steps the central bank plans to take to get there.
Warsh’s framing matters: committing to the destination while refusing to commit to the path is not evasion. It is the Fed telling you it does not yet know which direction the next move will be, and that itself is a signal of how uncertain the inflation picture remains.
Here is where the optimism contracts. Both prints are backward-looking. They capture an economy that pre-dates the oil price rebound tied to renewed U.S.-Iran hostilities and the 15 July exchange of strikes. They do not capture AI-related cost dynamics filtering through services pricing. What the reader should take from this: the market relief is provisional. It describes where inflation was, not where it is heading.
When big ASX news breaks, our subscribers know first
Why oil prices near the Strait of Hormuz are the Fed’s first problem
The Strait of Hormuz normally handles approximately 20-21 million barrels per day of crude and condensate. That is roughly one-fifth of global oil supply moving through a corridor narrow enough that a single geopolitical miscalculation can reprice energy markets within hours.
Brent peaked above $120 per barrel during the initial disruption phase in spring 2026, retreated sharply on truce efforts, then rebounded to approximately $84.81 by mid-July as the U.S. and Iran exchanged strikes and held conflicting positions on Hormuz navigation rights. The EIA’s Short-Term Energy Outlook (July 2026) projects Brent averaging approximately $82 per barrel for the full year under current conditions.
That projection assumes current conditions hold. The gap between the EIA’s $82 baseline and a sustained escalation scenario tells you how much additional inflationary pressure is sitting in the tail risk; even a partial move toward that tail narrows the Fed’s room to stay on pause.
The Hormuz risk premium embedded in current Brent pricing reflects more than the mid-July strike exchange; commercial war-risk insurance withdrawal and a two-year supply chain recovery timeline modelled by the IEA mean the premium is expected to decompress slowly rather than snap back to pre-crisis levels.
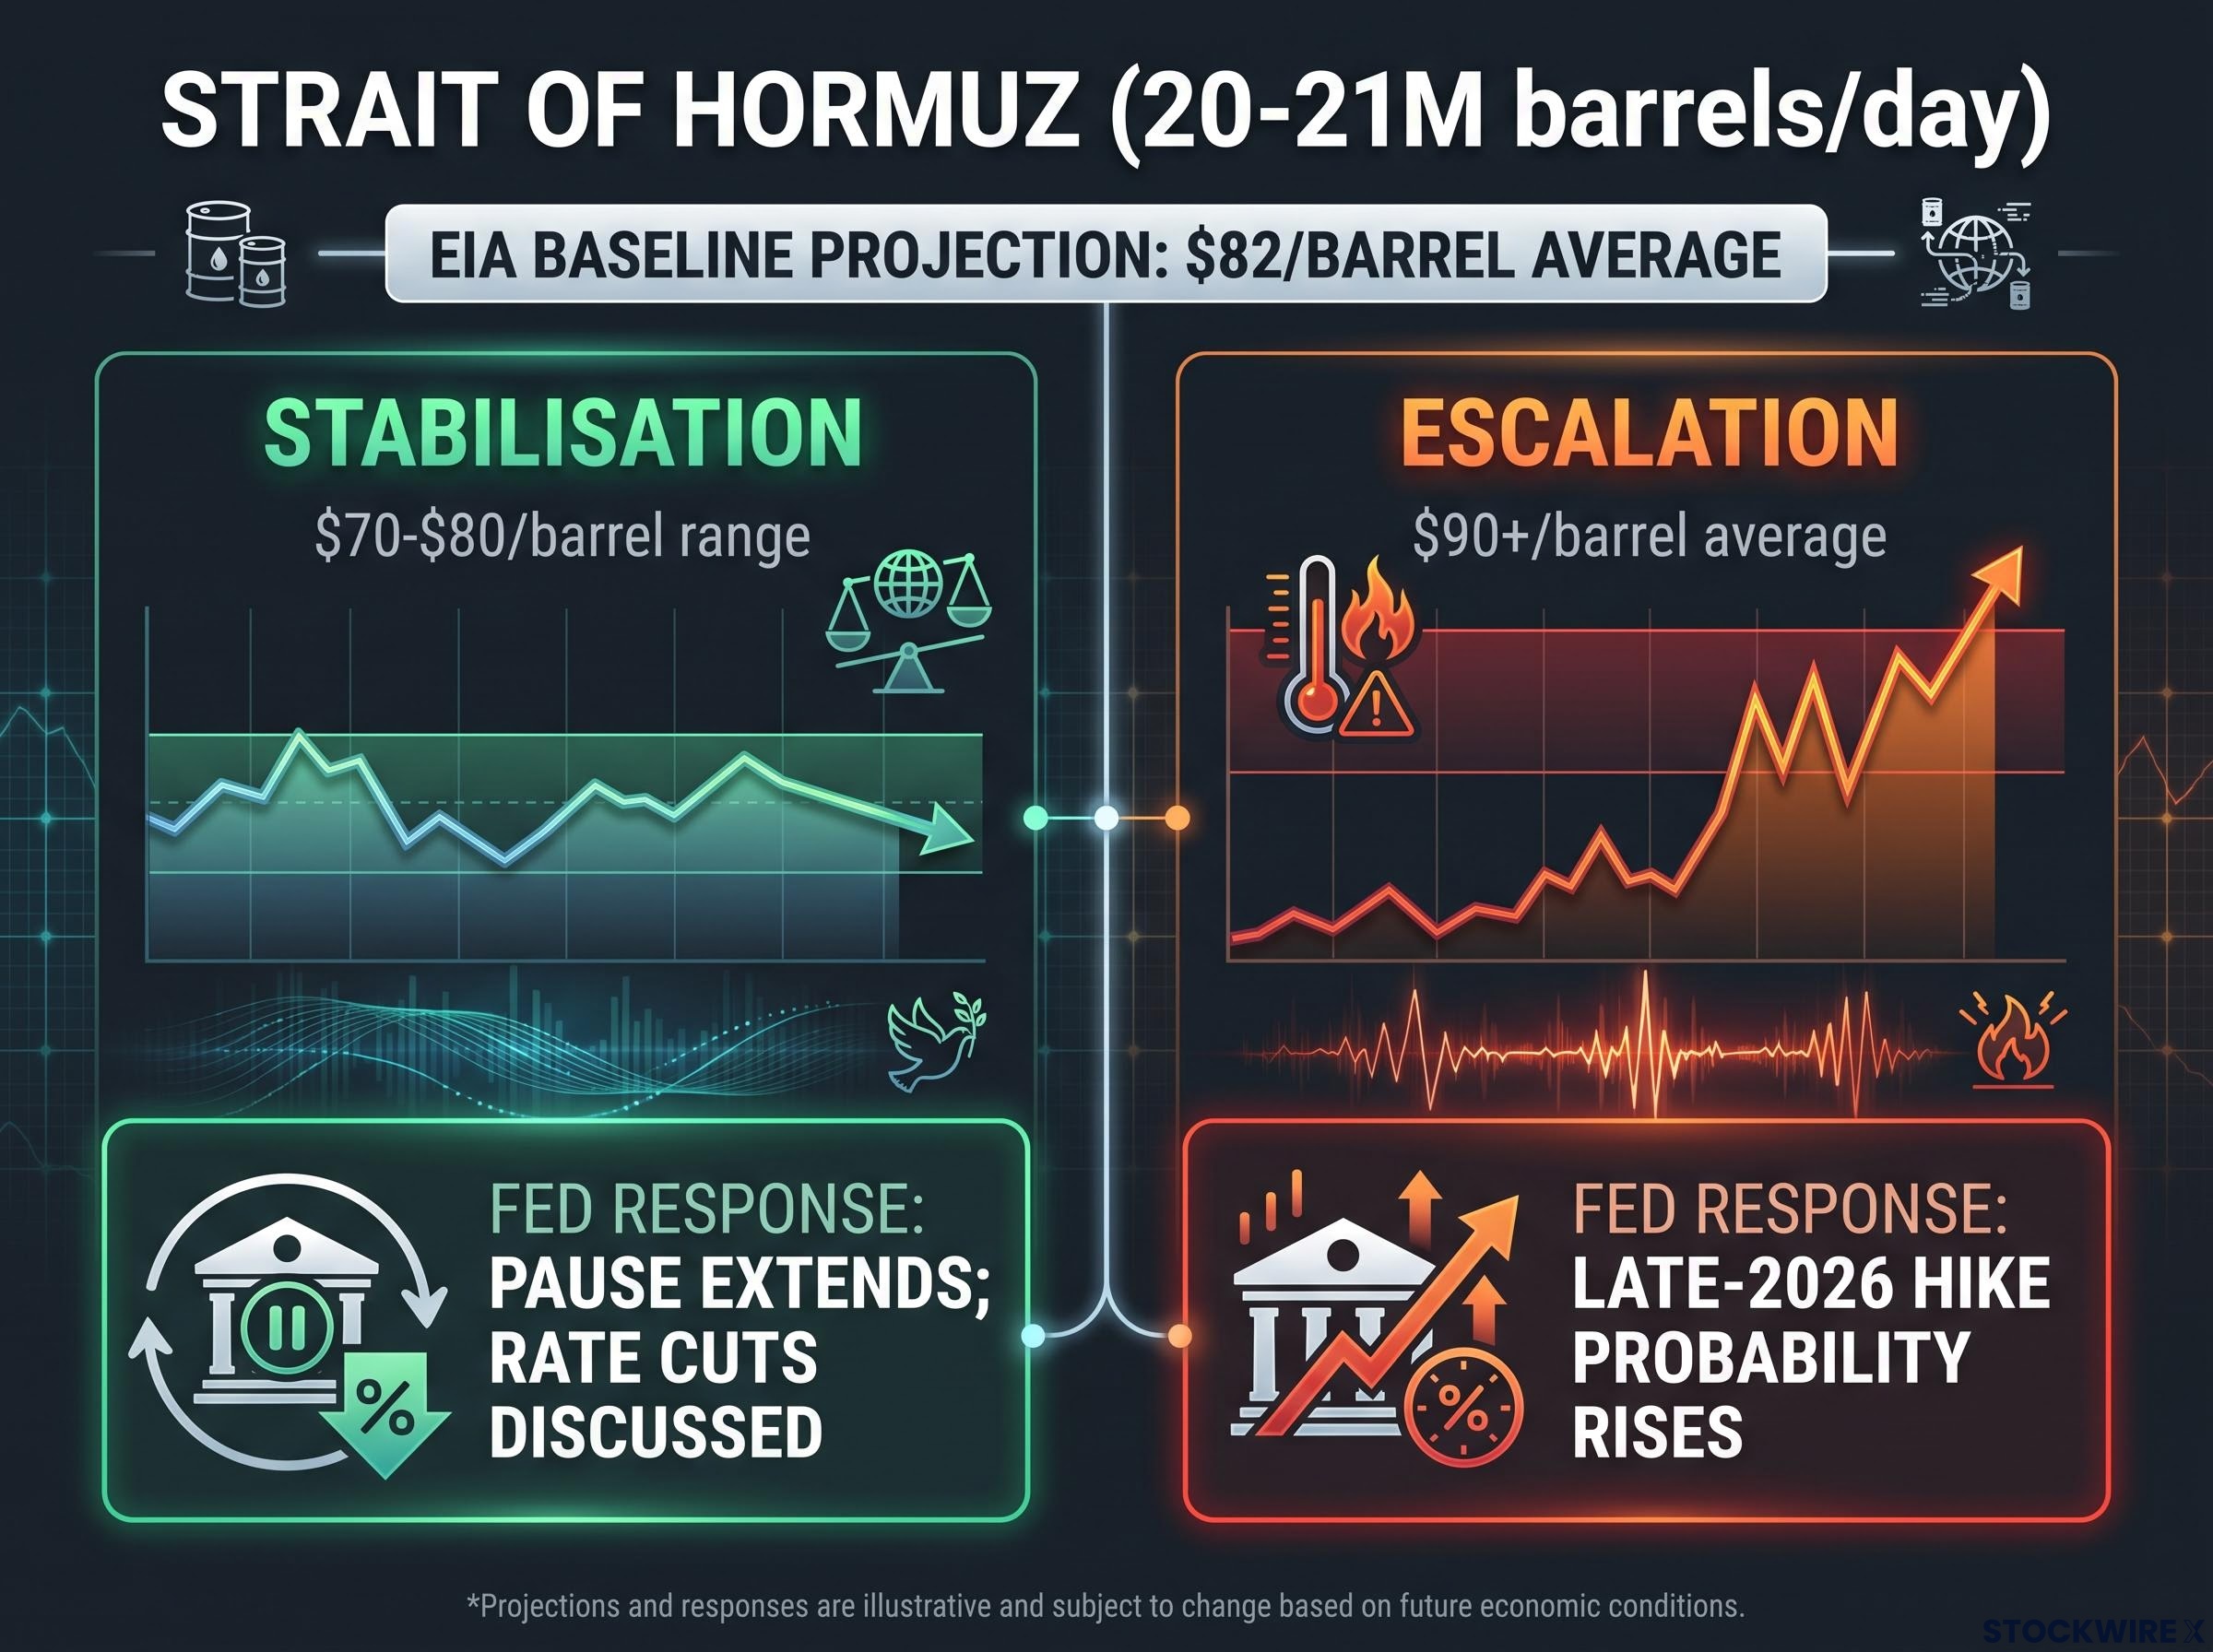
| Scenario | Estimated Brent range | Likely Fed response |
|---|---|---|
| Stabilisation (Hormuz de-escalates) | $70-$80/barrel | Pause extends; rate cuts enter discussion |
| Escalation (Hormuz constrained) | $90+/barrel average | Late-2026 hike probability rises materially |
The channel from crude to core inflation
The transmission works in stages. Sustained high crude raises transportation and freight costs first. Those costs bleed into manufacturing input prices. Over subsequent weeks and months, goods and services prices reflect the pass-through.
This lag is the critical detail. It means July and Q3 CPI prints may begin reflecting the current oil rebound even if Brent stabilises at today’s level. A supply shock the Fed can look through is short-lived and self-correcting. One that persists long enough to appear in core measures, which strip out volatile food and energy to capture underlying price trends, forces a response. The question is whether the Hormuz situation resolves before that transmission completes.
Fed research on oil price pass-through to core inflation documents the sequential mechanism by which crude price movements transmit into services and goods pricing, confirming that the lag between a supply shock and its appearance in core measures typically spans one to several months.
What AI is adding to the inflation picture that standard models miss
Start with the most tangible channel: electricity. Training and running large AI models is extraordinarily power-intensive, and the rapid build-out of data centres is pushing electricity demand higher in capacity-constrained regional grids. When generation cannot keep pace with demand, wholesale power prices rise, and those costs eventually feed through to utility bills and industrial inputs.
The three AI inflation channels operating simultaneously:
- Energy demand: Data centre build-out raising wholesale electricity costs in constrained grids
- Service repricing: Firms using AI to segment customers and micro-target pricing, generating selective price increases even when average costs fall
- Product differentiation: AI-enhanced versions of existing services (analytics platforms, productivity suites, professional tools) launching at higher price points, particularly in finance and software
The core tension for policymakers: AI may be disinflationary at scale, as productivity gains reduce unit labour costs and automation lowers service delivery expenses. But the transition period generates localised pockets of upward price pressure that do not show up cleanly in any single index component, and that ambiguity is what makes the Fed’s job harder.
Because these effects are diffuse and sector-specific rather than concentrated in a headline number, the Fed itself cannot cleanly model or isolate them. That uncertainty systematically biases the central bank toward caution when other pressures, like energy, are simultaneously elevated. For investors, AI inflation risk is not a number to track; it is a structural reason the Fed will be slower to declare victory on inflation, even when the headline data looks benign.
How the Fed reads a world where two unpredictable forces are moving at once
Warsh’s Congressional testimony framed the Fed’s posture precisely: committed to the 2% target, uncommitted to a specific path, flexibility preserved. That is not hedging. It is a rational response to two genuinely uncertain, simultaneous pressures.
The compounding problem is specific. The Fed has historical frameworks for oil shocks: if the disruption is transient, look through it; if it persists and transmits to core, respond. But there is no equivalent established framework for AI-related inflation channels. The two forces are harder to read in combination than either would be in isolation, because AI’s diffuse price effects make it more difficult to determine whether a given uptick in services inflation is energy pass-through, AI-related noise, or genuine underlying pressure.
Two paths from here, each conditional on observable signals:
- Stabilisation: Hormuz shipping normalises, Brent drifts toward the $70-80 range, core inflation continues cooling. The pause extends, and the Fed begins discussing eventual normalisation more confidently. CME FedWatch hike probability continues to decline.
- Escalation: Oil stays elevated or rises further, core measures in Q3 fail to show decisive progress toward 2%. A late-2026 hike, likely in the autumn meeting window, becomes a live policy option. CME FedWatch reprices accordingly.
The Fed’s deliberate ambiguity about the rate path means market pricing can shift quickly on relatively modest new information. Rate hike risk has not been priced out of the second half of 2026; it has been deferred contingently.
Warsh’s explicit rejection of Fed forward guidance at his June press conference means the conditional ambiguity visible in his Congressional testimony is not a temporary communication style but a deliberate institutional shift, and every data release now carries greater market-moving weight than it did under the prior regime.
Understanding why energy shocks and monetary policy interact the way they do
The Fed’s standard response to a pure supply shock is to look through it rather than hike. The logic is straightforward: raising interest rates cannot produce more oil. Tightening in response to a supply-driven price spike risks slowing the economy without resolving the underlying cause of higher prices.
Central to the Fed’s assessment is the difference between headline and core inflation measures. Headline captures food and energy alongside everything else; core excludes those volatile categories to reveal the underlying trend. Because core is less distorted by commodity swings, it is the measure the Fed watches most closely. A supply shock contained within headline, never spreading to core, is one policymakers can wait out. One that lingers long enough to raise freight costs, squeeze manufacturing inputs, and eventually lift services prices demands a more active response.
The lag between the oil market and your CPI reading
Price pressure from an oil shock does not arrive all at once. It moves through the economy in sequence:
- First: Spot crude prices surge (the spring 2026 disruption carried Brent above $120)
- Second: Freight and manufacturing input costs climb in the weeks that follow
- Third: Consumer-facing prices for goods and services adjust, a process that typically takes one to several months to complete
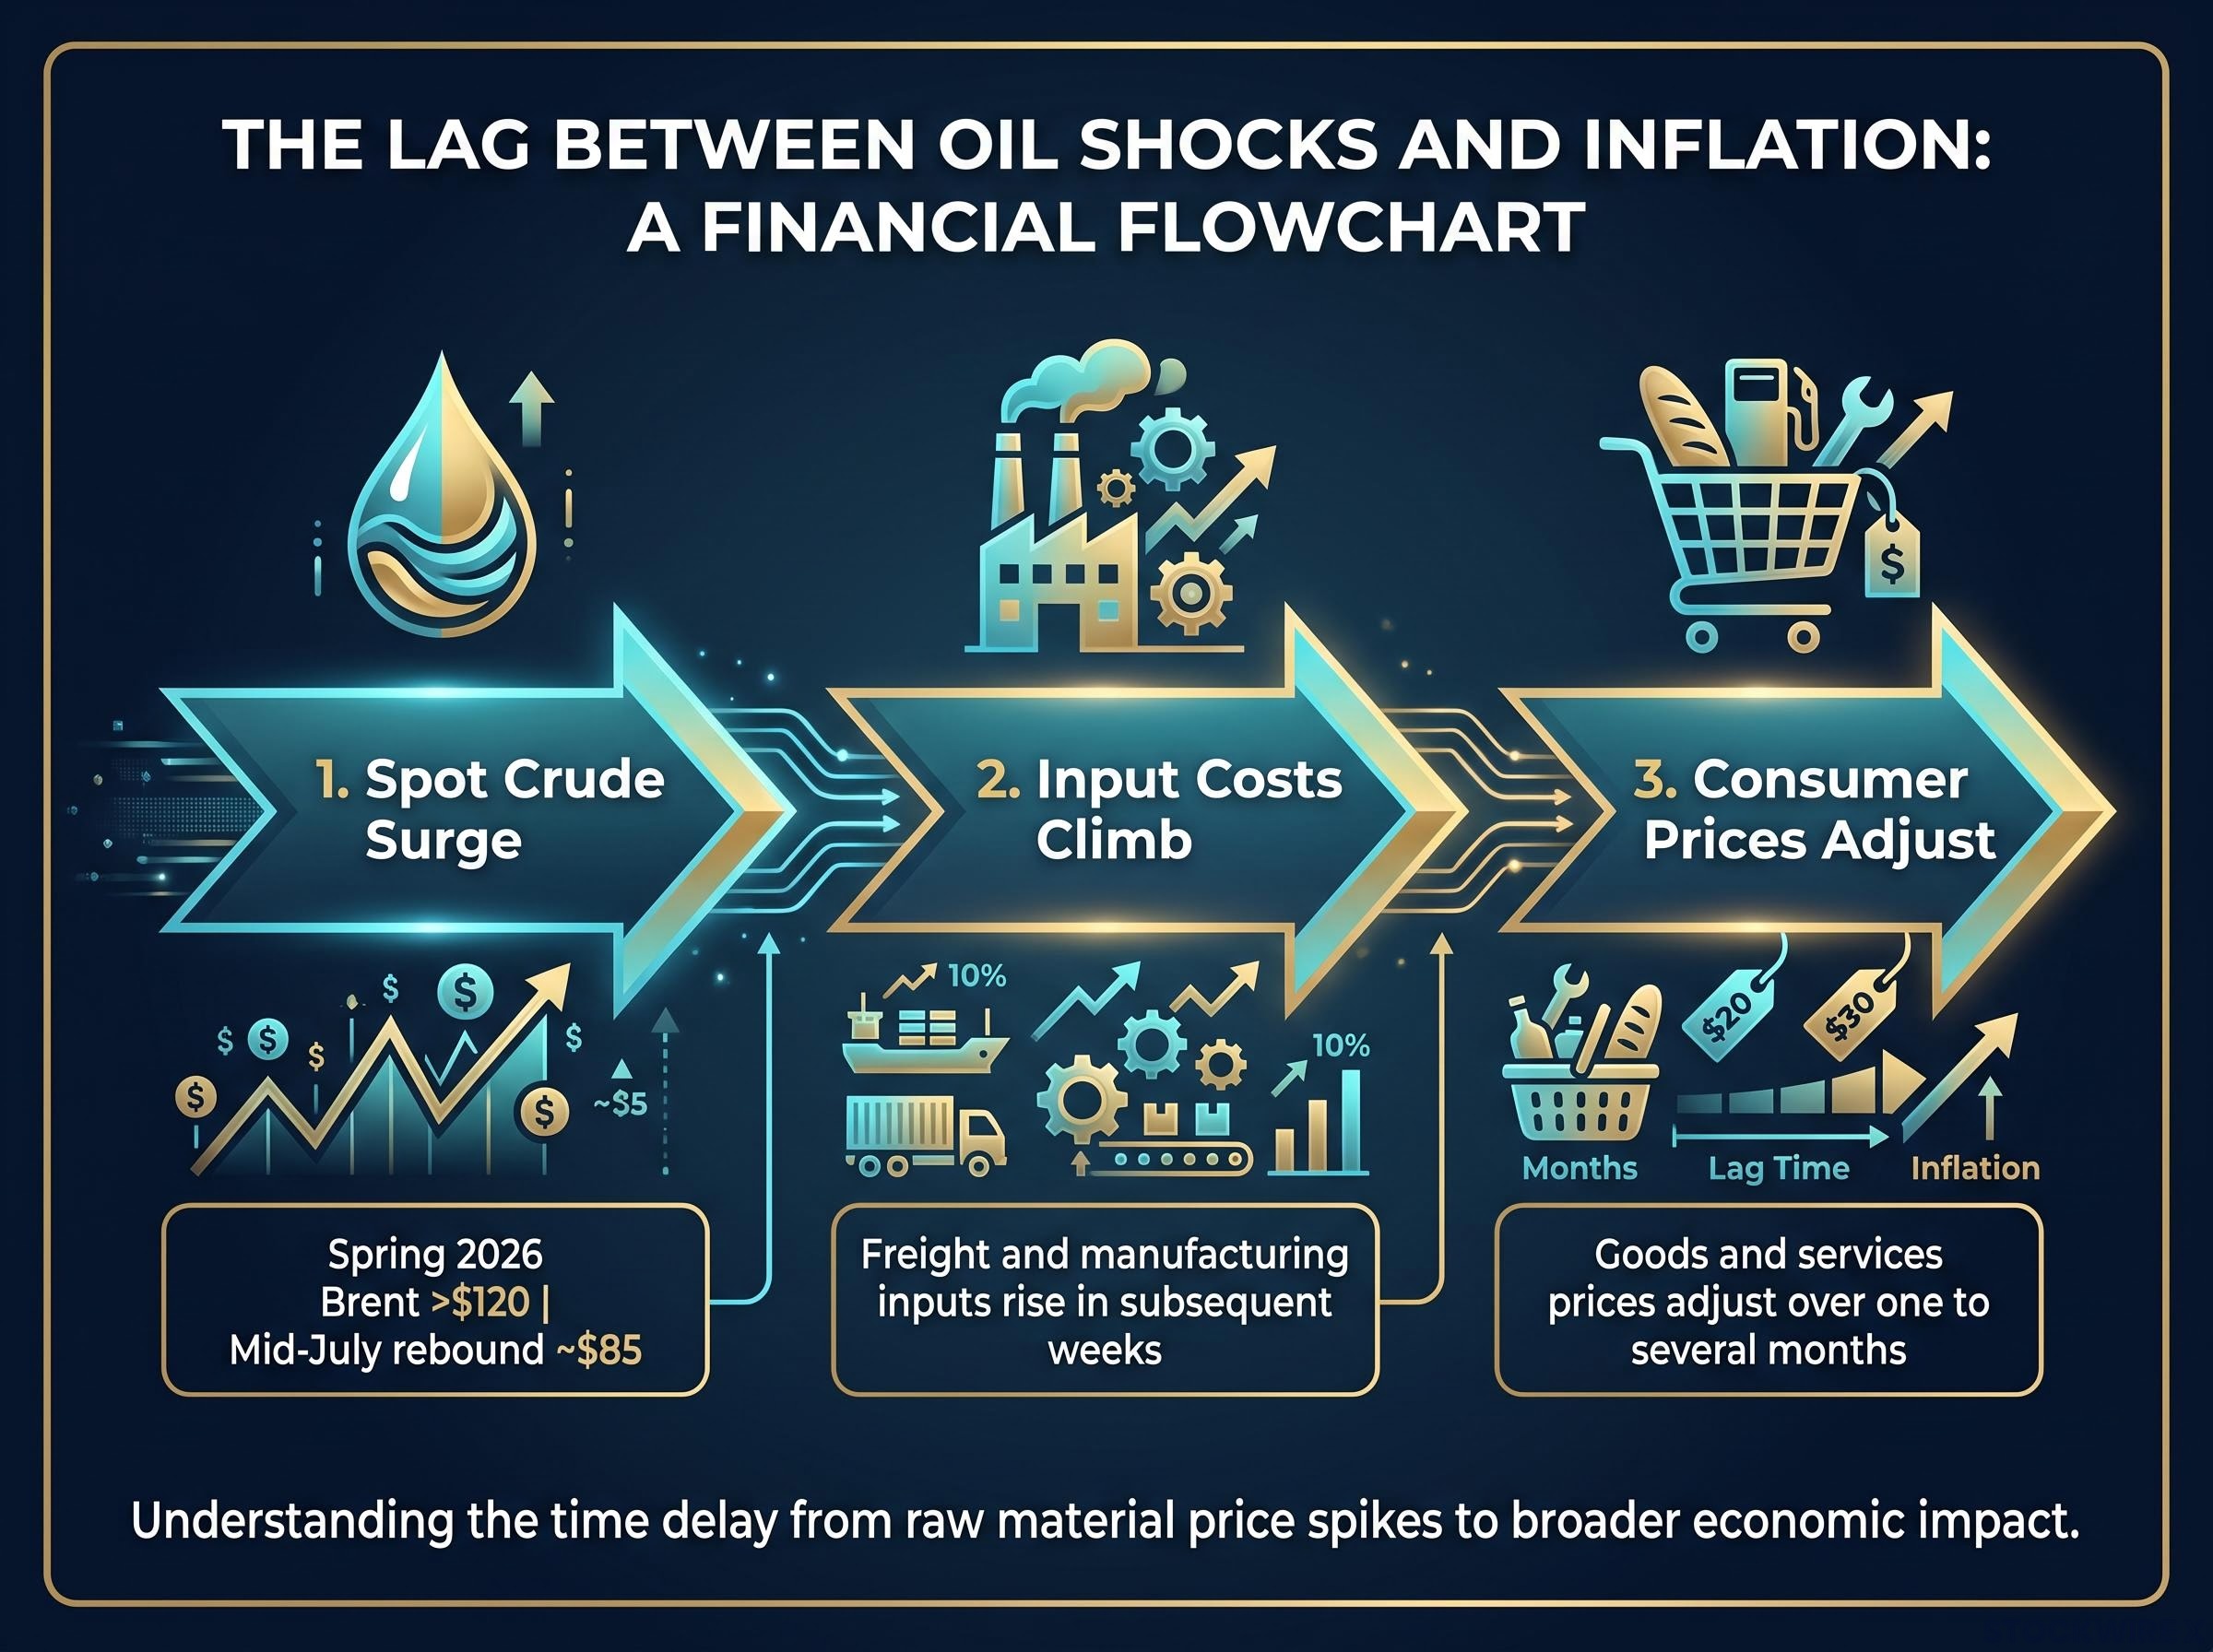
Anchor this to the current timeline. The spring 2026 oil spike and the mid-July rebound to approximately $85 mean that Q3 CPI prints may begin reflecting energy pass-through even if Brent does not climb further from current levels. June’s benign prints describe conditions that pre-date the current Hormuz stress. The lag is the structural reason why the present calm in rate hike fears may not persist through Q3.
The next major ASX story will hit our subscribers first
What to watch between now and the Fed’s autumn decisions
The next 60-90 days of data and geopolitical developments will determine whether the current pause holds or whether autumn delivers a resumption of tightening. Here is the surveillance framework.
| Signal to watch | Current reading (mid-July 2026) | Why it matters for Fed policy |
|---|---|---|
| Brent crude price | $84.81/barrel | Above EIA’s $82 annual average projection; directional movement is the leading indicator for energy pass-through |
| U.S.-Iran Hormuz status | Conflicting positions after 15 July strikes | Any material shift (escalation or genuine de-escalation) moves energy markets faster than scheduled data releases |
| Core CPI trajectory | June print below expectations | July and August readings will show whether oil rebound is transmitting to core measures the Fed targets directly |
| CME FedWatch rate hike probability | Near-term hike bets scaled back, not zeroed | Real-time instrument tracking how new data shifts the market’s policy expectations |
- Services inflation sub-components deserve particular attention for AI-related price effects; these will not show up in headline numbers but could influence the Fed’s confidence in its inflation read
- The Fed’s autumn meeting window is the decision point that current data and geopolitical developments are building toward
Investors who track these signals in combination have a materially better framework for anticipating policy shifts than those waiting for the Fed to signal its intentions explicitly.
Breathing room is not an all-clear
June’s cooler inflation data is genuine and material for near-term rate hike odds. But the two forces most likely to reverse it are both present in the current environment, and neither has resolved. Brent at approximately $85 already sits above the EIA’s $82 full-year average projection, which means the energy environment the Fed faces for the rest of 2026 is already more inflationary than the baseline. The question is not whether that matters, but how much further it needs to move to force action.
The distinction between a Fed pause that reflects confidence inflation is under control and a Fed pause that reflects insufficient data to justify another move is everything. The current posture is the latter: conditional, reversible, and sensitive to incoming data. A late-2026 hike remains a non-trivial probability if oil stays elevated and core fails to make decisive progress toward 2%.
For investors wanting to stress-test whether today’s oil-driven price pressure risks becoming structural, our full explainer on money supply and inflation examines why M4 growth at approximately 5.9% in 2026 is the key variable separating a transitory commodity spike from a 2022-style sustained inflation episode.
The analytical verdict: Fed rate hike fears have receded, not resolved. June bought time. The Hormuz situation and AI-driven cost pressures are the two forces that could take it back. Treat the second half of 2026 as a live conditional, and let Brent’s direction and incoming core data do the signalling rather than waiting for the Fed to commit explicitly.
This article is for informational purposes only and should not be considered financial advice. Investors should conduct their own research and consult with financial professionals before making investment decisions. Past performance does not guarantee future results. Financial projections are subject to market conditions and various risk factors.