
How to Pick ASX Shares: a 6-Step Checklist for Beginners
6 hrs ago

When oil prices spike and inflation headlines multiply, the number that actually determines whether the threat is real rarely appears on the front page. It is the growth rate of the broad money supply.
The May 2026 Consumer Price Index (CPI) release prompted fresh investor anxiety about a return to 2022-style inflation. Yet broad M4 money supply growth sits at approximately 5.9% year-over-year as of April 2026, according to the Center for Financial Stability. That figure is consistent with pre-pandemic historical norms and a world away from the 30%-plus peak of mid-2020. The structural backdrop that produced runaway inflation four years ago has not replicated itself.
By the end of this article, the distinction between commodity price spikes and structural inflation will be clear, alongside the indicators that actually matter and why current monetary conditions do not support a return to sustained, broad-based price increases, regardless of what energy prices do in the near term.
Petrol prices climb, grocery bills rise, and the instinct is immediate: inflation is back. The instinct is understandable. It is also, in most cases, technically wrong.
Inflation, in the economic sense, describes a persistent, general rise in the overall price level across an economy. A spike in one sector, whether energy, food, or shipping, is a relative price shock. The distinction matters because the two phenomena have different causes, different durations, and different implications for portfolios.
The distinction between a relative price shock and genuine broad-based inflation sits at the centre of what makes inflation and purchasing power such poorly understood concepts outside of economics; most headline responses conflate a sector-level supply disruption with the sustained, general rise in prices that actually erodes household wealth over time.
The mechanism that separates them is straightforward. When oil prices rise but the money supply does not also expand, households face a fixed pool of spending power. Higher fuel costs crowd out other expenditure. Consumers pay more at the pump and less at the restaurant. Prices shift between categories rather than rising across the board indefinitely.
This creates a logical tension worth pausing on. The argument that consumers are simultaneously financially exhausted and experiencing hot, sustained inflation is internally contradictory. Sustained inflation requires the financial capacity to keep paying higher prices across the entire economy. Without that capacity, price spikes fade.
A transitory price shock and structural inflation share surface symptoms but differ in almost every other respect:
Recognising which one is present protects against reactive portfolio decisions that the underlying data does not warrant.
The mechanism behind structural inflation is not mysterious. It follows from a relationship that economists have studied for over a century, and understanding it requires only four variables.
M × V = P × Y
Each component captures a different dimension of how money moves through an economy:
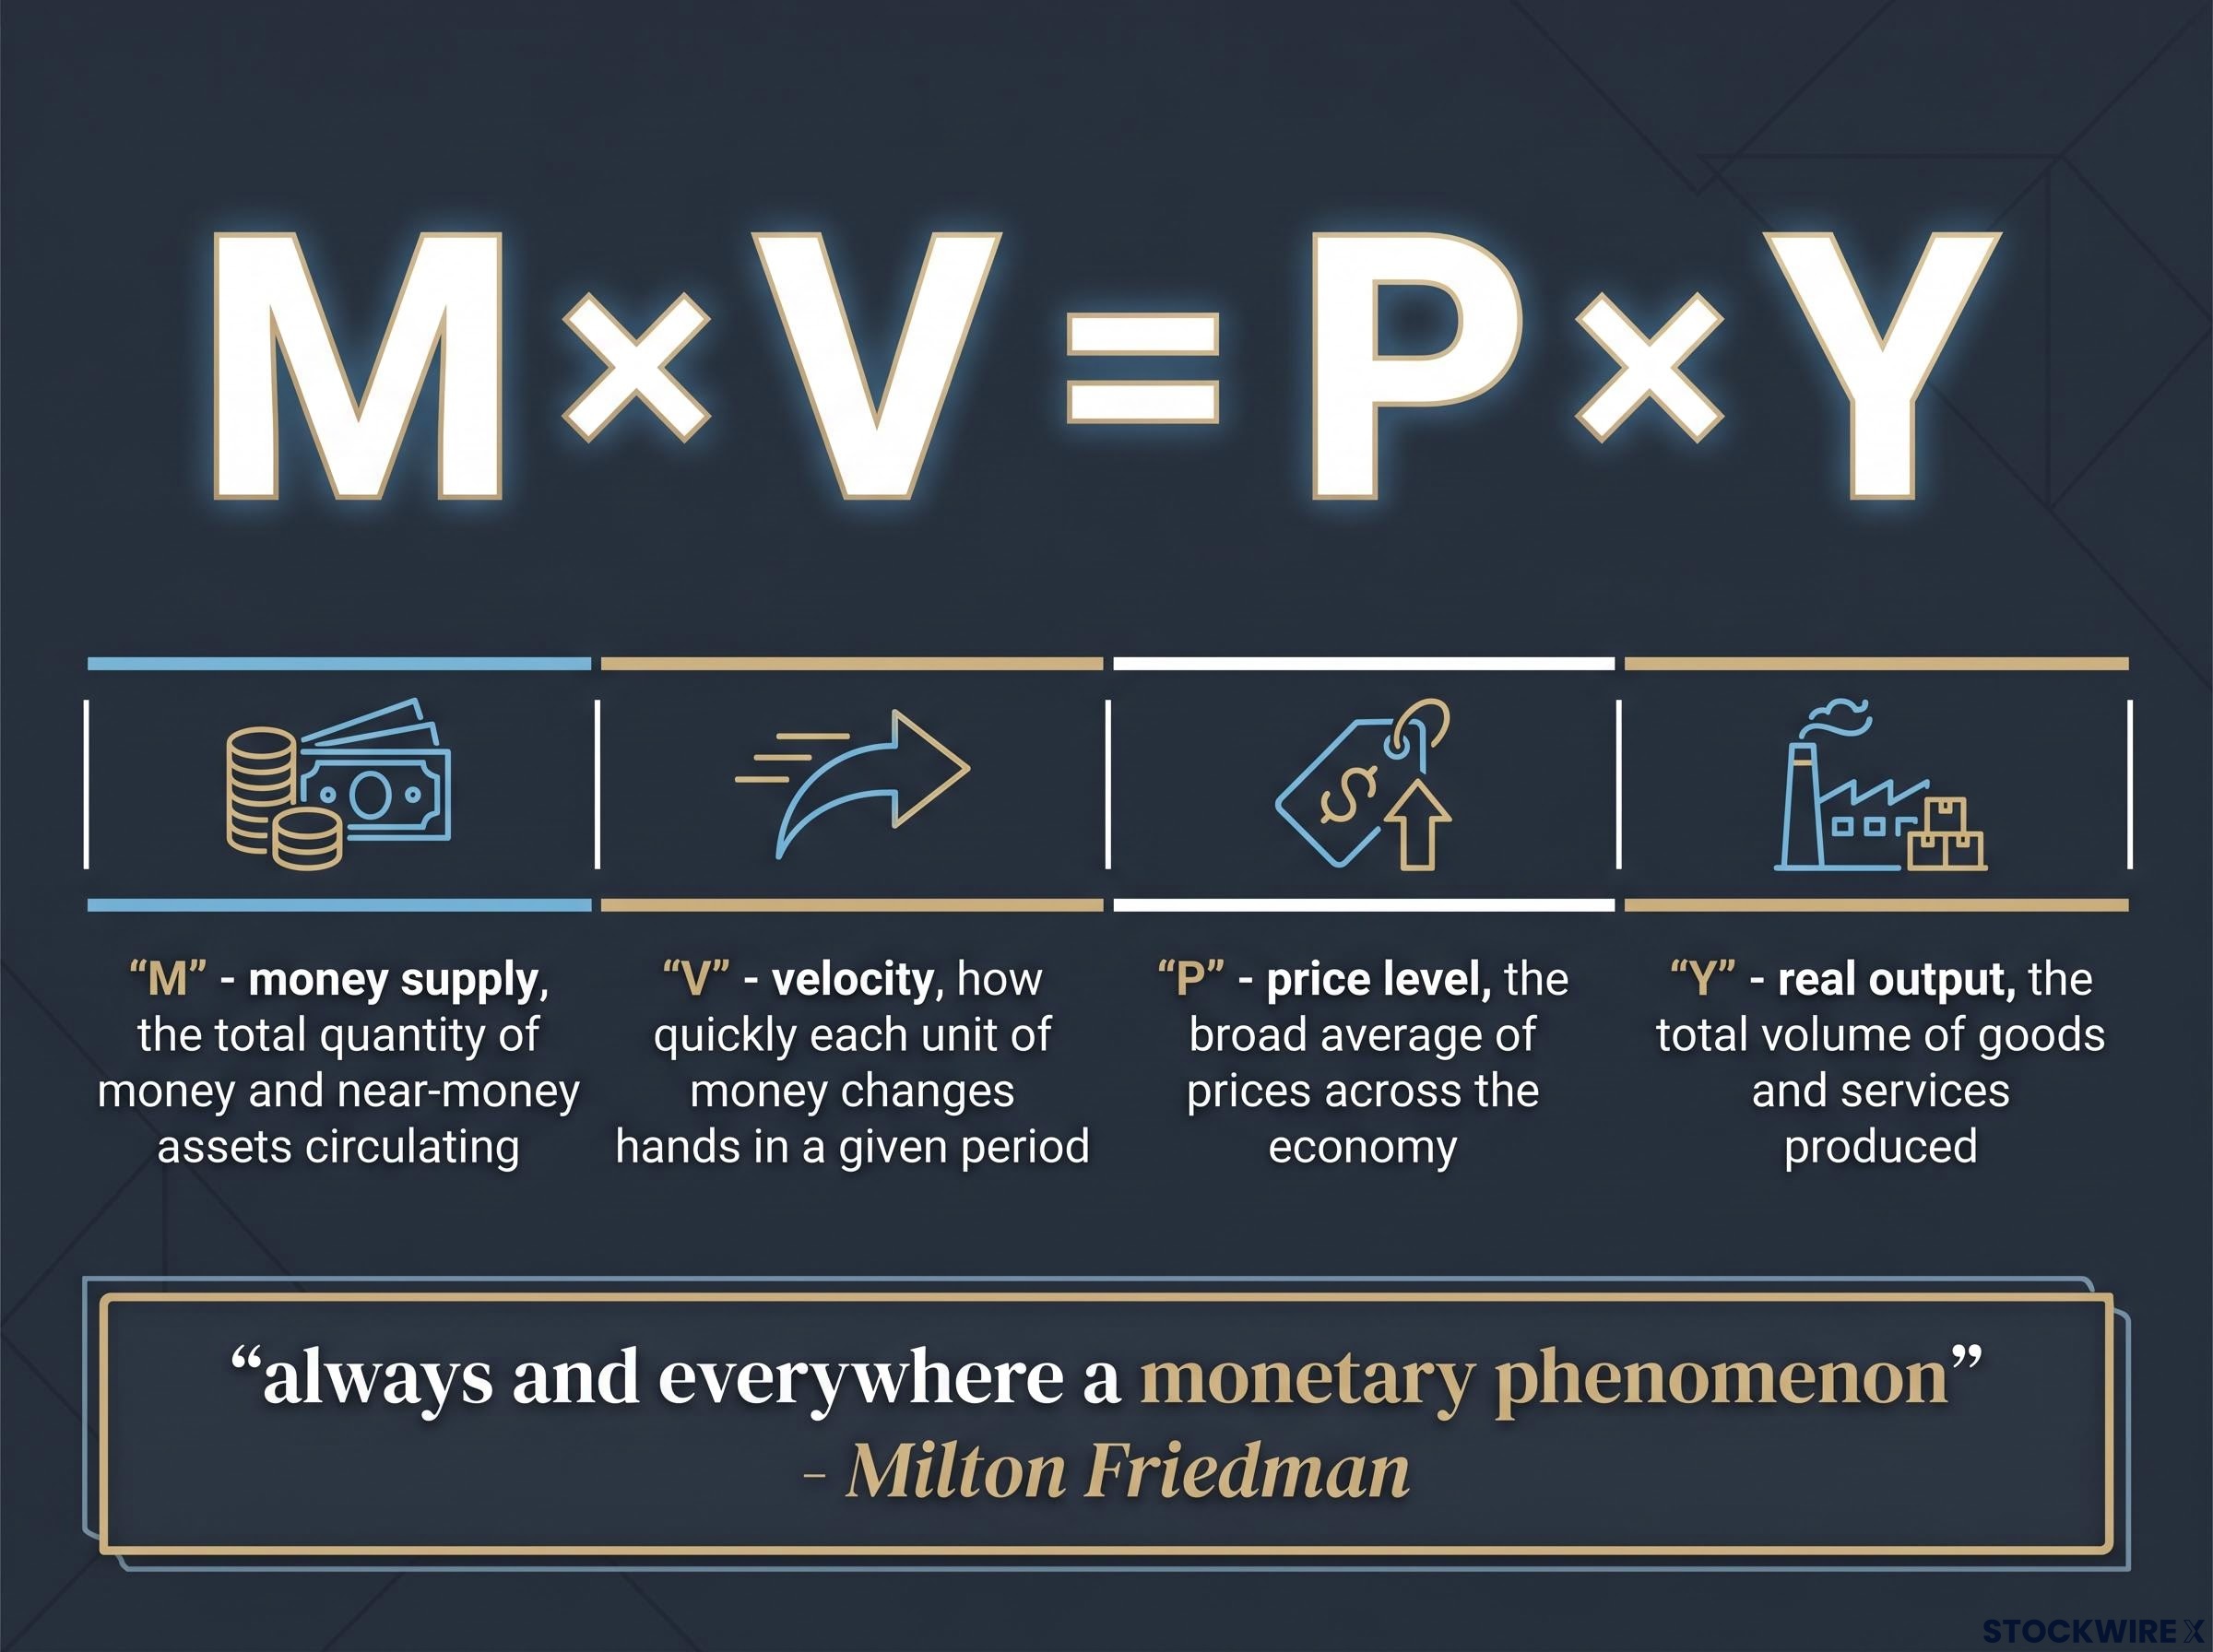
The equation is an identity; both sides must balance by definition. The implications flow from what happens when one variable moves. If M grows much faster than Y and V is not collapsing, the long-run pressure is upward on P. More money chasing a similar quantity of goods and services pushes prices higher.
Milton Friedman captured the monetarist position in a single phrase: inflation is “always and everywhere a monetary phenomenon.” The formulation remains one of the most cited in economics, and for good reason. It redirects attention from individual price movements to the underlying monetary conditions that determine whether those movements persist.
The M2 constraint on sustained price increases is central to the contrarian case: when broad money growth is subdued, firms facing higher input costs are more likely to compress margins than to pass costs fully through to consumers, because households lack the financial buffer to keep absorbing higher prices across the entire consumption basket.
The relationship is real, but it is not mechanical in the short run. Analysis of U.S. data across hundreds of monthly observations has found no stable linear relationship between 12-month M2 growth and 12-month CPI inflation over short horizons. Financial innovation and unstable velocity since the 1980s have complicated the simple correlation. The framework’s strength lies in its medium-term structural signal, not as a month-to-month forecasting tool.
The 2021 to 2022 inflation episode was not a routine commodity-driven price spike. Every structural condition aligned simultaneously, and reviewing exactly what happened reveals why the CPI outcome was not coincidental.
The Federal Reserve’s M2 measure grew more than 27% in the 12 months after February 2020, the fastest rate since the series began in 1959 and nearly four times its long-term average of approximately 7%.
Between March 2020 and the end of 2021, M2 increased by approximately $6.4 trillion. The Center for Financial Stability’s broader Divisia measure, M4, grew more than 30% year-over-year during June and July 2020. These were not incremental expansions. They were historically unprecedented.
The transmission mechanism was direct. Stimulus payments landed in household accounts while service-sector spending collapsed. Consumers accumulated unusually large cash buffers. When the economy reopened, those buffers gave households the financial capacity to absorb rapid price increases across goods, services, and housing simultaneously. The excess liquidity translated into roughly 2-3 years of elevated inflation, per available analysis.
Supply shocks (pandemic disruptions, reopening frictions, supply chain dislocations, and energy spikes) amplified an already inflationary monetary backdrop. They were accelerants, not the primary cause. Without the extraordinary monetary expansion beneath them, 8%-plus CPI readings in 2022 would not have materialised.
The BIS working paper on the 2021-2022 inflation episode examines the interaction between supply shocks and monetary conditions during that period, supporting the interpretation that extraordinary monetary expansion was the structural precondition that allowed supply disruptions to produce persistently elevated CPI outcomes rather than temporary price adjustments.
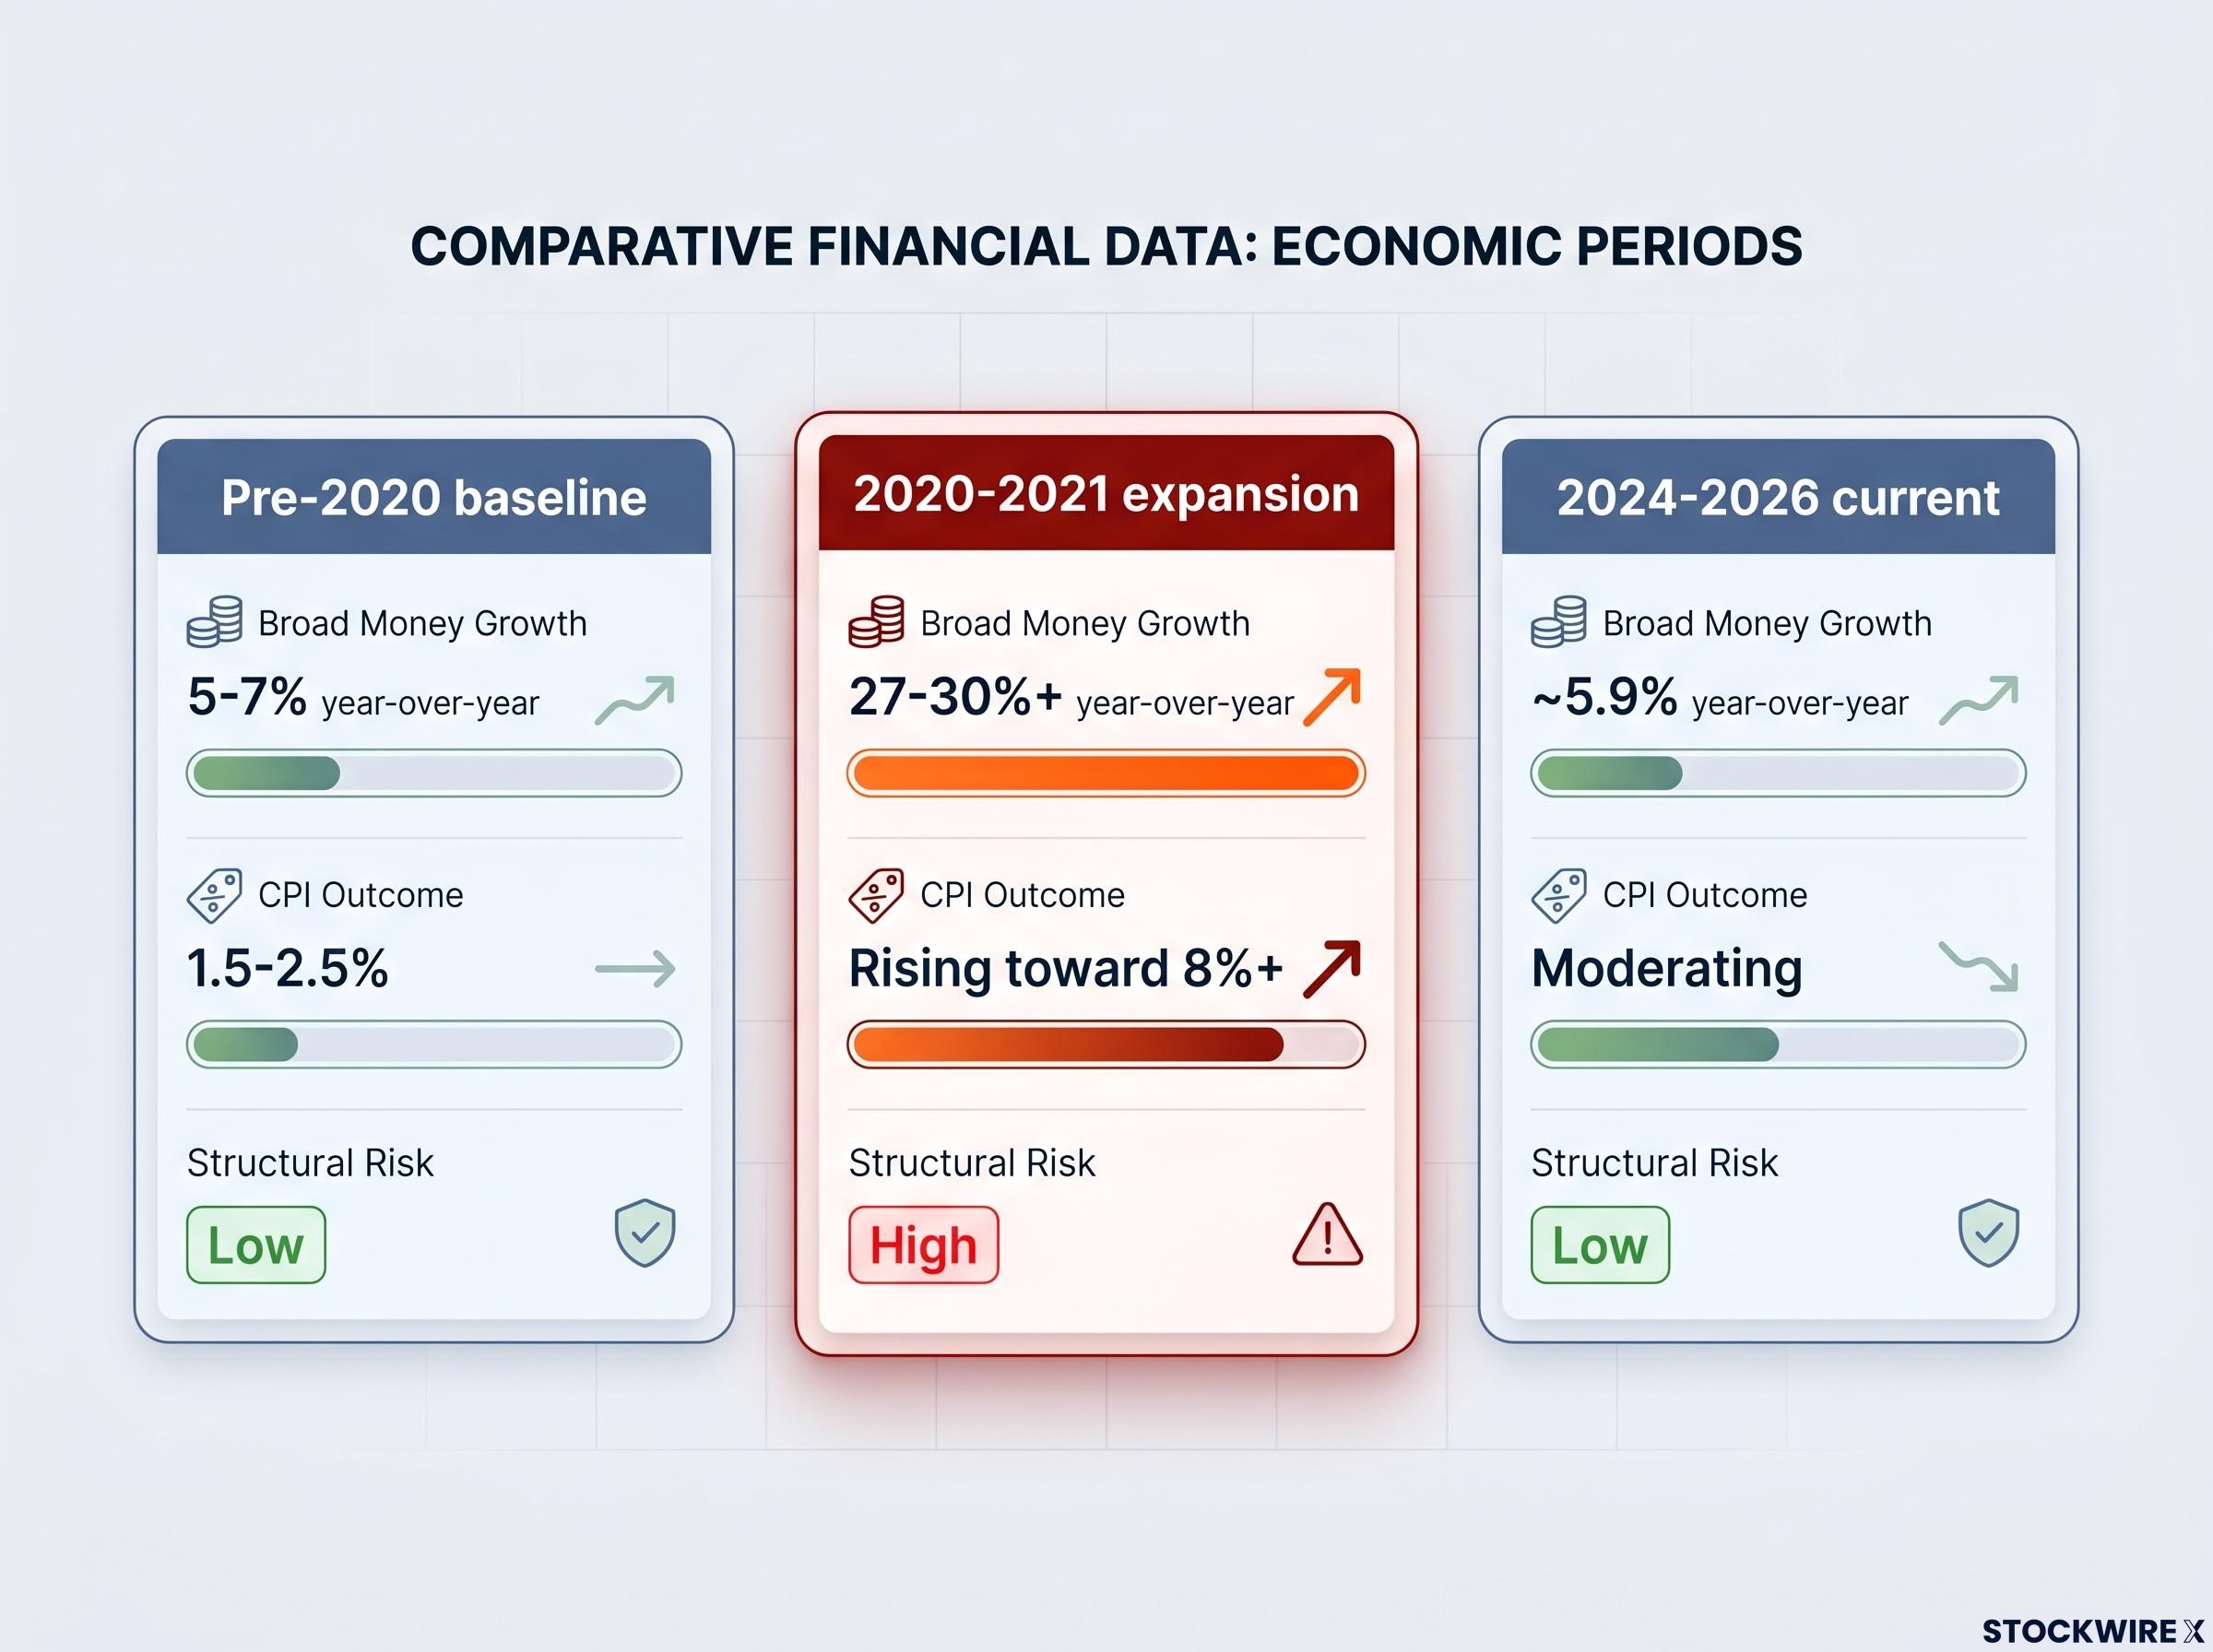
| Period | Broad Money Growth (approx.) | CPI Outcome | Consumer Behaviour | Structural Inflation Risk |
|---|---|---|---|---|
| Pre-2020 baseline | 5-7% year-over-year | 1.5-2.5% | Steady, trend-level spending | Low |
| 2020-2021 expansion | 27-30%+ year-over-year | Rising toward 8%+ | Large cash buffers, pent-up demand | High |
| 2024-2026 current | ~5.9% year-over-year | Moderating | Trading down, cautious spending | Low |
Understanding what the 2022 episode actually required prevents investors from treating every commodity-driven CPI bump as a rerun. Extraordinary monetary expansion combined with supply shocks is a specific and historically unusual configuration, not a default state.
The current monetary picture reads as a factual counterpoint to the 2020 to 2022 case study.
Broad M4 money supply growth stood at approximately 5.9% year-over-year as of April 2026, according to the Center for Financial Stability (data as of 10 June 2026). That figure sits comfortably within pre-pandemic historical norms. For context, the same measure exceeded 30% year-over-year at its mid-2020 peak. The gap between then and now is not marginal; it is a fivefold difference.
The Center for Financial Stability’s Divisia M4 methodology weights monetary assets by their liquidity services rather than treating all components equally, producing a broader and more economically meaningful measure of money than simple-sum aggregates like M2, which is why the Divisia series is the preferred benchmark for tracking structural monetary conditions in this analysis.
Consumer behaviour corroborates the monetary data. Spending patterns show a shift toward private-label goods and discount retailers. Discretionary purchases have slowed. Consumer spending growth has been described as modest and steady rather than strong, a stable backdrop rather than an overheating economy. Household balance sheets remain broadly healthy in aggregate, though real difficulty persists for low- and fixed-income individuals.
The structural conclusion follows from this combination. Normalised money growth paired with cautious consumer behaviour is fundamentally distinct from the conditions that produced 2022-style inflation. Any commodity-driven CPI reading occurring against this backdrop is more likely to be transitory noise than the beginning of a structural episode.
For investors looking to assess structural inflation risk independently, four signals deserve ongoing attention:
The next time a CPI headline crosses the screen, two questions can replace the anxiety.
First: is broad money growth far above its historical trend? If the answer is yes, and credit expansion and consumer spending are simultaneously surging, inflation risk is structural. It warrants attention in long-term asset allocation decisions. This was the configuration of 2020 to 2021, and the CPI consequences followed with a lag of roughly 12-18 months.
Second: has broad money growth normalised, and are consumers behaving cautiously? If so, commodity-driven CPI bumps are more likely to be noise. This is the configuration of mid-2026, with M4 at 5.9% and spending patterns reflecting restraint rather than excess.
The May 2026 inflation report has been assessed as containing no unanticipated information relative to existing market expectations. Financial markets are primarily moved by unexpected developments, and a CPI report that confirms existing trends is unlikely to drive meaningful or sustained disruption. Short-term volatility around inflation data releases is a routine feature, not a signal requiring portfolio changes.
The equity market implications of restrained monetary conditions extend beyond the inflation debate itself: the FOMC’s April 2026 statement isolated energy as a distinct inflation variable, signalling that rate decisions will weigh the durability of the supply shock rather than simply react to the headline print, a distinction that meaningfully changes the discount-rate outlook for growth-sensitive equities through the second half of 2026.
Bear markets typically begin gradually rather than through sudden sharp drops. Steep short-term declines are generally temporary. This pattern further supports the case for structural assessment over headline reaction.
Two publicly available data sources allow independent monitoring. The Federal Reserve publishes M2 data regularly. The Center for Financial Stability provides broader Divisia M4 measures. Both are freely accessible.
| Indicator | What It Measures | Structural Inflation Signal | Current Reading | Investor Action Implication |
|---|---|---|---|---|
| Broad money growth (M2/M4) | Excess purchasing power in the system | Yes, when far above historical norms | ~5.9% YoY (normalised) | No structural allocation change warranted |
| Oil/commodity prices | Relative price changes in energy or goods | Usually no by itself | Elevated but sector-specific | Monitor, but do not treat as structural signal |
| Consumer credit growth | Whether monetary conditions translate into demand | Yes, when surging alongside money growth | Modest | Confirms cautious consumer stance |
| Consumer behaviour | Spending patterns and discretionary demand | Confirms or contradicts monetary signal | Trading down, private-label shift | Supports transitory rather than structural reading |
If broad money growth is at trend and consumers are trading down, a CPI bump driven by a commodity spike is noise, not structure. If broad money growth is multiples above trend and credit is surging, the same CPI bump may be the beginning of something that lasts.
Oil prices and commodity spikes are inputs to a CPI calculation. They are not drivers of sustained inflation. The monetary backdrop, the rate at which money and credit are growing relative to real output, is the structural variable that determines whether a price shock becomes embedded in the economy or fades as spending adjusts.
The relationship between money supply and inflation is real but not mechanical in the short run. Investors who treat money supply growth as a medium-term structural indicator, rather than a month-to-month trading signal, position themselves to distinguish between temporary disruptions and genuine regime changes.
The current environment speaks clearly. M4 at approximately 5.9% year-over-year, cautious consumer behaviour, and no evidence of the credit-fuelled demand pressure that characterised 2020 to 2021: these conditions do not structurally support a replay of 2022. Investors who understand this distinction are better positioned to hold their course when commodity-driven headlines generate market noise.
For investors wanting to quantify exactly what historical data shows about equity performance at different inflation levels, our detailed coverage of the 4% CPI threshold and equity returns walks through Bank of America’s analysis of S&P 500 returns across CPI regimes, including the specific discount-rate mechanics that explain why equity multiples compress as inflation approaches and breaches that level.
Sustained inflation requires sustained excess money. Without it, price spikes are temporary adjustments, not the beginning of a new inflation regime.
This article is for informational purposes only and should not be considered financial advice. Investors should conduct their own research and consult with financial professionals before making investment decisions. Past performance does not guarantee future results. Financial projections are subject to market conditions and various risk factors.
The relationship between money supply and inflation follows the equation M x V = P x Y: when broad money grows much faster than real output and velocity is not collapsing, the result is upward pressure on the general price level. The relationship is a reliable medium-term structural signal, though it is not a precise month-to-month forecasting tool.
A transitory price shock is concentrated in one or two sectors, driven by a supply disruption, and fades as supply normalises or demand adjusts. Structural inflation is broad-based, sustained over multiple quarters, and requires excess money growth and strong credit expansion to remain self-reinforcing.
Investors should track broad money growth measures such as M2 and Divisia M4, consumer credit growth, velocity trends, and consumer behaviour signals like trading down or private-label adoption. Together these four indicators distinguish between temporary commodity-driven price spikes and genuine structural inflation episodes.
The 2021-2022 episode was driven by unprecedented M2 growth of over 27% in 12 months, which gave households the financial capacity to absorb rapid price increases across the entire economy simultaneously. In contrast, broad M4 money supply growth stood at approximately 5.9% year-over-year as of April 2026, consistent with pre-pandemic historical norms and not structurally supportive of a repeat.
If broad M4 money growth is near its historical trend of roughly 5-7% and consumers are spending cautiously, a CPI bump driven by commodity prices is more likely transitory noise than the start of a structural episode. The May 2026 CPI release occurred against a backdrop of 5.9% M4 growth, which does not provide the monetary fuel required for sustained, broad-based price increases.


