Meta Platforms shares have recovered roughly $210 per share since August, climbing from a low near $536 on 19 August 2026 back into the high-$700s within weeks.
That number is impressive on its own. It becomes more interesting the moment you notice where it has carried the stock: right up to a price band that has stopped every previous advance dead.
The rally is not a random surge of optimism. It is the market pricing a specific bet, namely that Meta’s planned $130-145 billion AI capital spend for 2026 will eventually generate returns large enough to justify the free cash flow it is already compressing. Whether that bet is correctly priced is the question in front of you.
What follows here is deliberately structured as evaluation criteria rather than a forecast. Four variables will determine whether Meta AI stock pushes through the $800 zone or gets rejected from it: technical resistance, capex risk, talent signals, and product strategy. Each is examined in turn so you can weigh them yourself.
How far META has run, and where the ceiling sits
The starting point is the bottom. Meta hit a 52-week low of $520.26 on 27 March 2026, then found a second trough near $536 on 19 August. From there the recovery was rapid and sustained, carrying shares into the high-$700s by late September.
By 24 September 2026, Financial Times markets data recorded a fresh intraday high of $779.82. A day earlier, on 23 September, the stock was quoted at approximately $744.92. The magnitude of the move from the August floor is substantial, somewhere between $210 and $244 per share depending on the exact entry and exit points measured.
Here are the levels that frame the current setup:
- 52-week low: $520.26 (27 March 2026)
- August 2026 low: approximately $536 (19 August)
- Recent quoted price: approximately $744.92 (23 September 2026)
- All-time closing high: $787.42 (12 August 2025)
- 52-week high: $796.25 (Macrotrends)
The stock is now within touching distance of ground it has not held before.
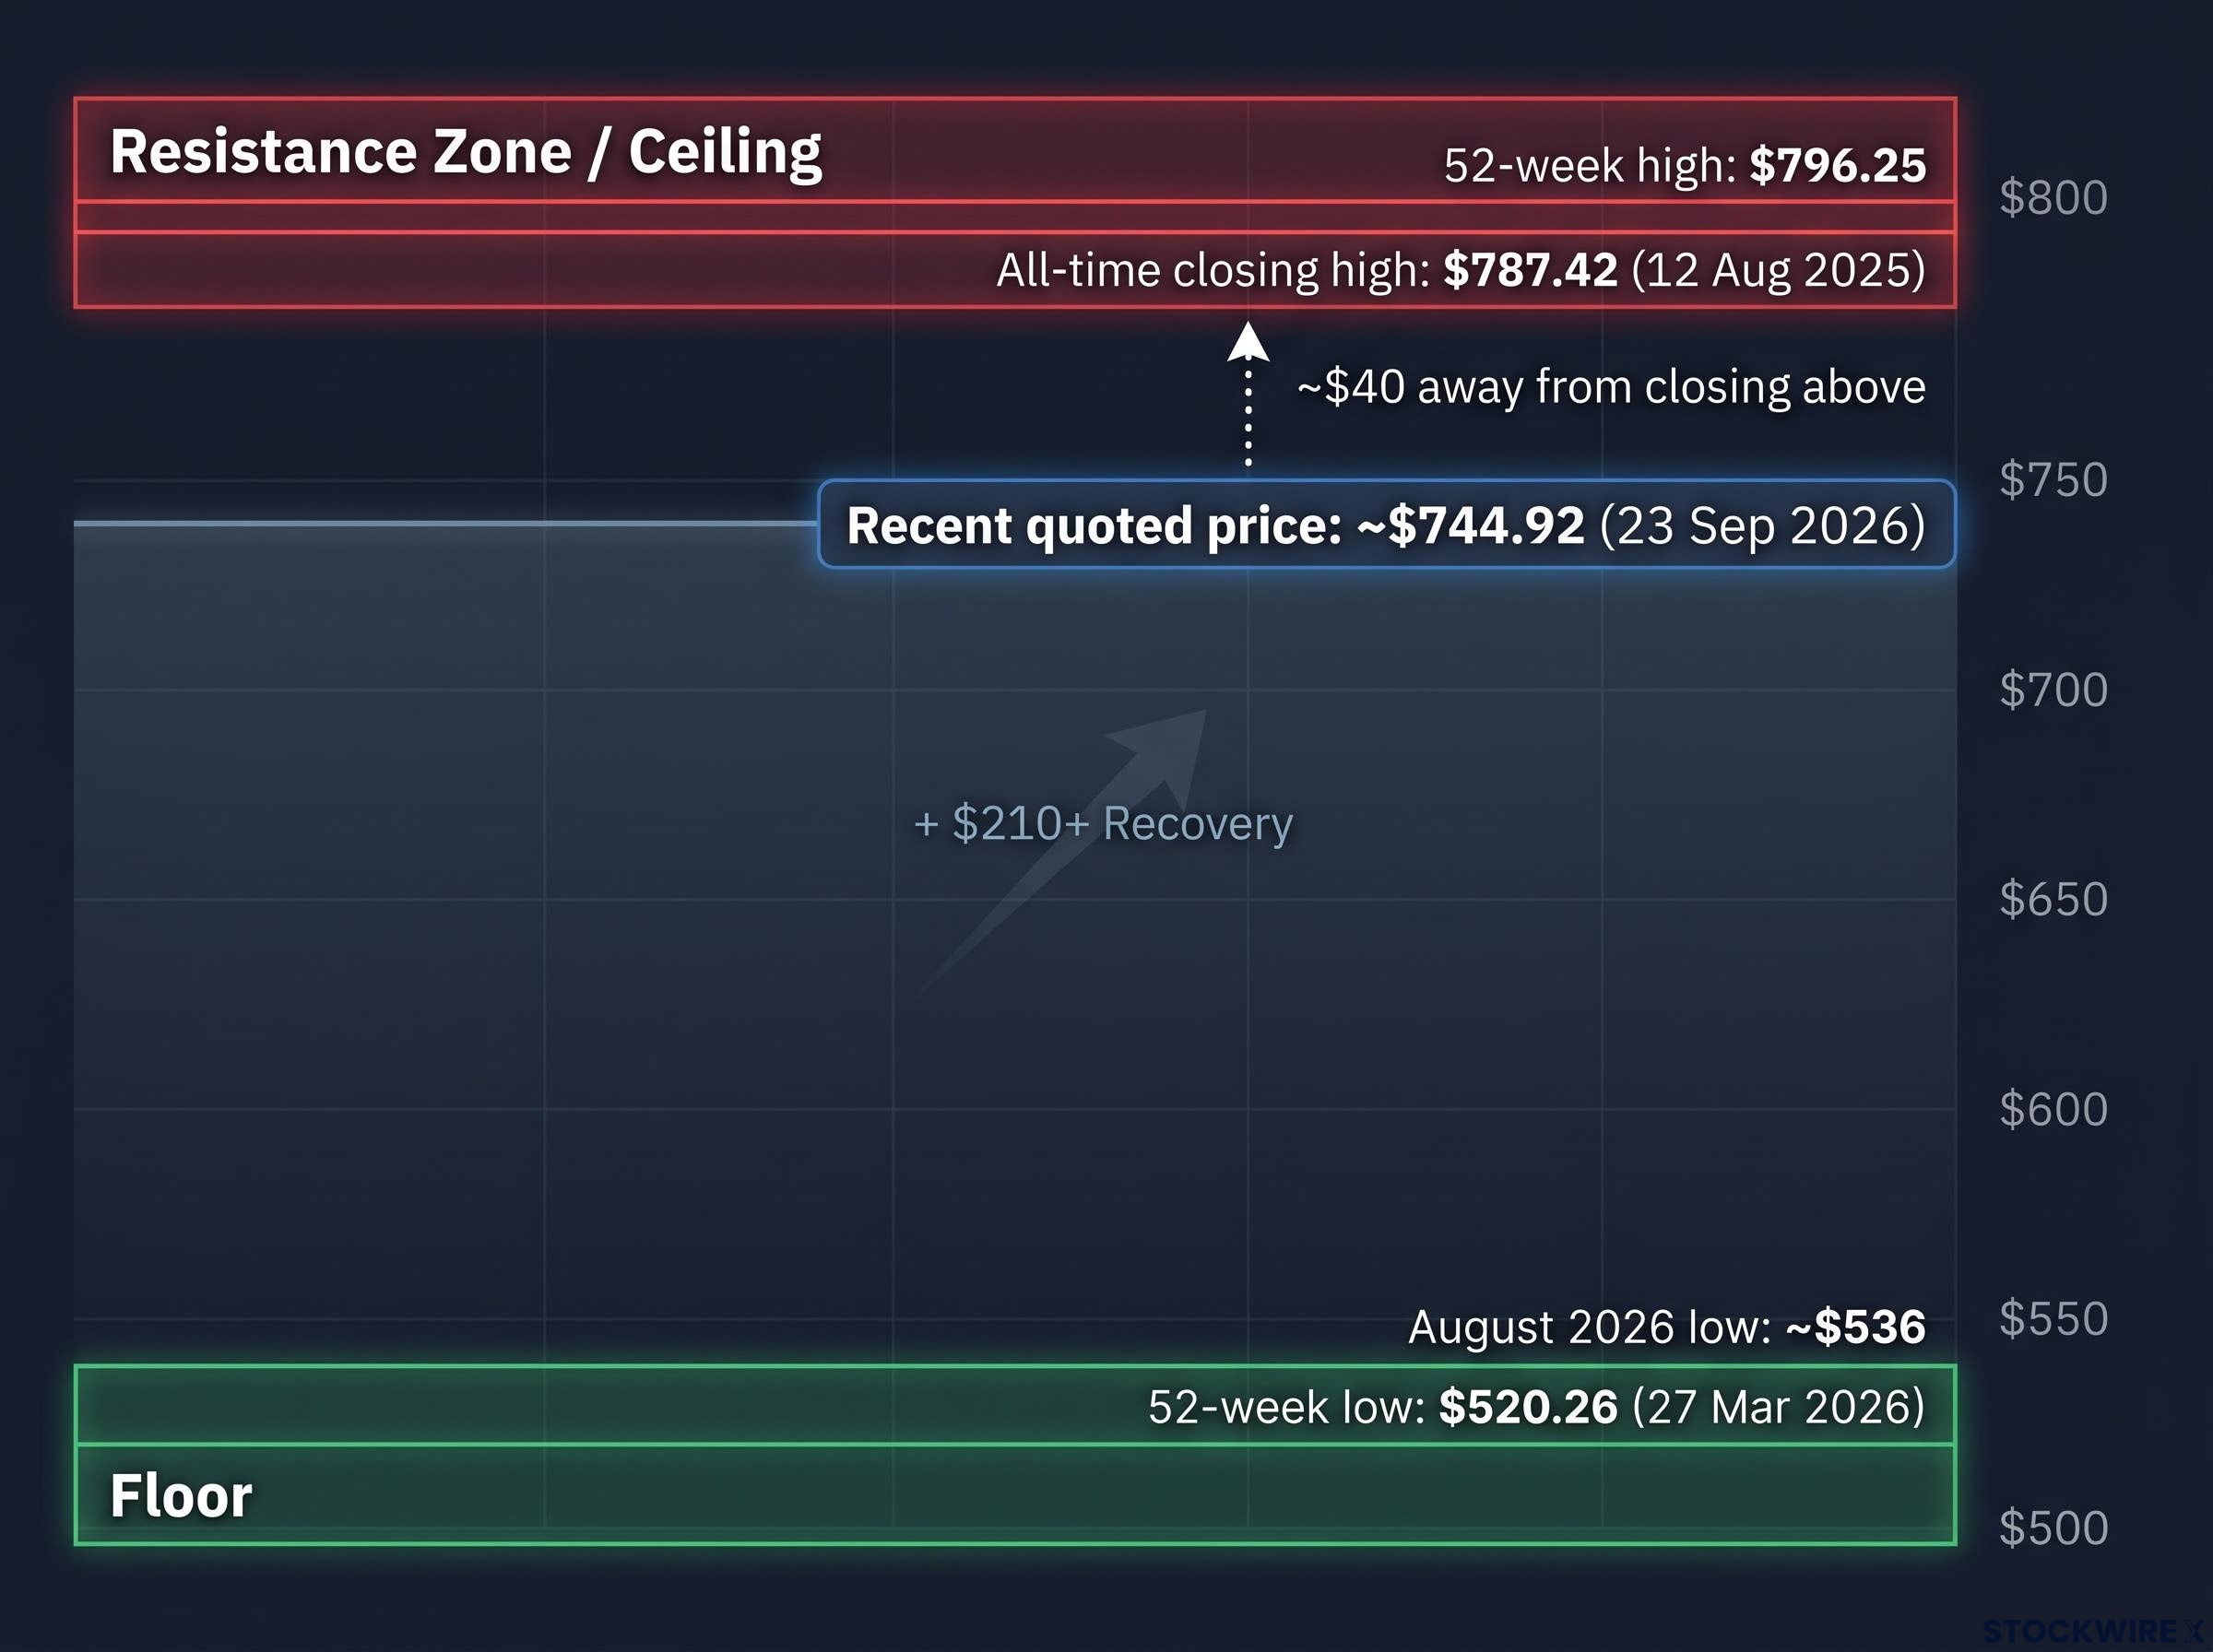
The central question Meta’s all-time closing high sits at $787.42. With shares recently near $744.92, the market is roughly $40 away from a level it has never closed above. That gap, not the round $800 figure, is where the real test lies.
What makes the $780-$796 zone a genuine ceiling rather than noise
Resistance is not an arbitrary line someone drew on a chart. In this case it is a confluence: two prior peaks landing in the same narrow band, the all-time closing high of $787.42 and the 52-week high of $796.25, sitting alongside a long-term trend line that extends across Meta’s entire public trading history.
That clustering matters because it concentrates sellers. Investors who bought near the previous top and watched shares fall into the $500s tend to wait at these levels to exit, while technical traders set stops and short positions around the same band.
Validated resistance zones carry more structural weight when multiple prior touches cluster in a narrow band rather than landing at scattered price points; a trend line that has accumulated six or more confirmed touches before a breakout attempt is statistically less likely to dissolve on the first serious challenge.
None of the sources reviewed record a sustained close above $800. That absence is the point. This is a tested resistance zone rather than a psychological number, which tells you the market has already voted twice that Meta is fully valued here. A third test deserves scrutiny, not an assumption that the stock simply carries through.
When big ASX news breaks, our subscribers know first
The AI spending commitment that is driving the rally, and the cash-flow risk it creates
The capex story builds in stages, and each one is larger than the last. Meta’s actual 2025 capital expenditure landed at $72.2 billion, according to Fortune (29 April 2026), already roughly $30 billion above the prior year.
Then came the 2026 guidance. At Q1 earnings, Meta raised its full-year outlook, and by 29 July 2026 Reuters reported the range at $130-145 billion, with management expecting to spend as much as $145 billion on AI infrastructure this year.
To put the scale in context, a Yahoo technology article (24 September 2026) noted that the upper figure represents a roughly 101% jump from 2025 spending, and exceeds the defence budgets of nearly every country except the United States, China, and Russia.
| Year | Capex Figure | vs. Prior Year | Source Date |
|---|---|---|---|
| 2024 | ~$42B (implied) | Baseline | Fortune, Apr 2026 |
| 2025 (actual) | $72.2B | ~$30B higher | Fortune, 29 Apr 2026 |
| 2026 (guidance low) | $130B | ~80% higher | Reuters, 29 Jul 2026 |
| 2026 (guidance high) | $145B | ~101% higher | Reuters, 29 Jul 2026 |
Now the pivot. Fortune noted that when Meta raised its 2026 guidance, “investors flinched,” a reaction that tells you the market is not uniformly comfortable with this trajectory. The 2026 figure exceeds what Meta spent across 2025 and 2024 combined.
The bear case in one headline Reuters, 29 July 2026: “Meta cash flow craters as Zuckerberg doubles down on AI.”
Here is the tension you are being asked to hold. The bear case is not that the infrastructure will fail to earn a return. It is that the monetisation timeline is uncertain while the spending is front-loaded and certain.
The free cash flow compression that followed Meta’s Q1 2026 guidance raise was severe enough that revised analyst estimates cut the 2026 FCF forecast from approximately $35 billion to $25 billion, a recalibration that already priced in a version of the pain investors are still debating today.
For you as a potential holder, that means near-term free cash flow is being deliberately sacrificed for a long-duration bet. The question is whether you have the conviction, and the time horizon, to ride through the gap before those returns arrive. Both the bull and bear case sit on the same set of numbers, which is exactly why the $800 test is not straightforward.
What Meta is paying for AI talent, and what those packages actually signal
The figures come first, because they are startling. Meta has reportedly paid individual AI researchers compensation packages in the range of $200 million to $400 million, and is said to have spent approximately $5 billion to acquire Alexander Wang’s stake in his company to bring him aboard.
A word of caution on sourcing before going further:
AI researcher equity compensation benchmarks published by Pave and NUA Group show median new-hire equity grants for AI research scientists exceeding $4 million, context that makes the hundreds-of-millions figures attributed to top-tier Meta hires structurally plausible even if the specific package totals remain unconfirmed in public filings.
- Individual compensation of $200M-$400M per hire: reported in original analyst commentary, not independently corroborated in filings
- Alexander Wang acquisition at approximately $5 billion: drawn from the same analyst commentary, treat as reported rather than confirmed
- These hires feed Meta’s Llama-based AI product line, referred to as “Muse” in that commentary
Set the shock of the headline numbers aside for a moment. The structural logic behind them is where the investment relevance sits.
The self-referential risk inside an equity-heavy compensation structure
Top-tier AI compensation at this level is increasingly dominated by long-dated equity rather than cash, which is what makes hundreds-of-millions figures plausible in the first place. That structure creates a loop worth understanding.
When talent is paid mostly in stock, retention becomes tied to the share price. A rising share price supports retention, retention supports AI product delivery, and product delivery supports the share price. The chain runs in a circle.
The risk is what happens if that circle breaks. A sustained pullback in Meta shares would not only dent investor portfolios; it could directly weaken Meta’s ability to hold the researchers its entire AI roadmap depends on.
That is a tail risk, not a base case. But if your view on Meta AI stock extends beyond a 12-month horizon, it is a risk worth pricing in, because it is distinct from the capex and product risks covered elsewhere and it compounds them rather than sitting alongside them.
Equity-heavy AI compensation structures are not unique to Meta: across the sector, companies that over-relied on headcount reductions to fund AI programmes have encountered deferred rehiring costs and knowledge loss that finance teams did not model at the time of the original cut, a dynamic that adds another dimension to how talent risk compounds inside large AI buildouts.
The AR glasses launch and what Apple’s Vision Pro actually teaches us
Meta used Meta Connect 2026 to lay out a three-tier wearables strategy, and the pricing spread tells you how the company is trying to build a market from the entry level upward.
At the accessible end sit the Ray-Ban Meta Audio glasses from $349, shipping 13 October 2026. Above them are the Ray-Ban Meta Gen 3 from $449, available immediately at announcement. At the top is the flagship, the Meta VR Glasses at $1,299.99, with availability set for spring 2027 and a Meta AI agent built directly into the operating system, per Meta’s official blog (23 September 2026).
The obvious comparison is Apple’s Vision Pro, which the original commentary flagged as a cautionary parallel after it underperformed expectations. But the comparison sharpens the question rather than settling it.
| Attribute | Meta VR Glasses | Apple Vision Pro | Key Difference |
|---|---|---|---|
| Price at launch | $1,299.99 | Substantially higher | ~one-third the cost |
| Availability | Spring 2027 | Already launched | Meta later to market |
| Positioning | Consumer media, social, gaming | Professional workflows | Mainstream vs niche |
| AI integration | Meta AI in the OS | Limited AI focus | AI-native design |
Vision Pro faced three failure modes. The useful exercise is checking which ones Meta’s strategy actually addresses:
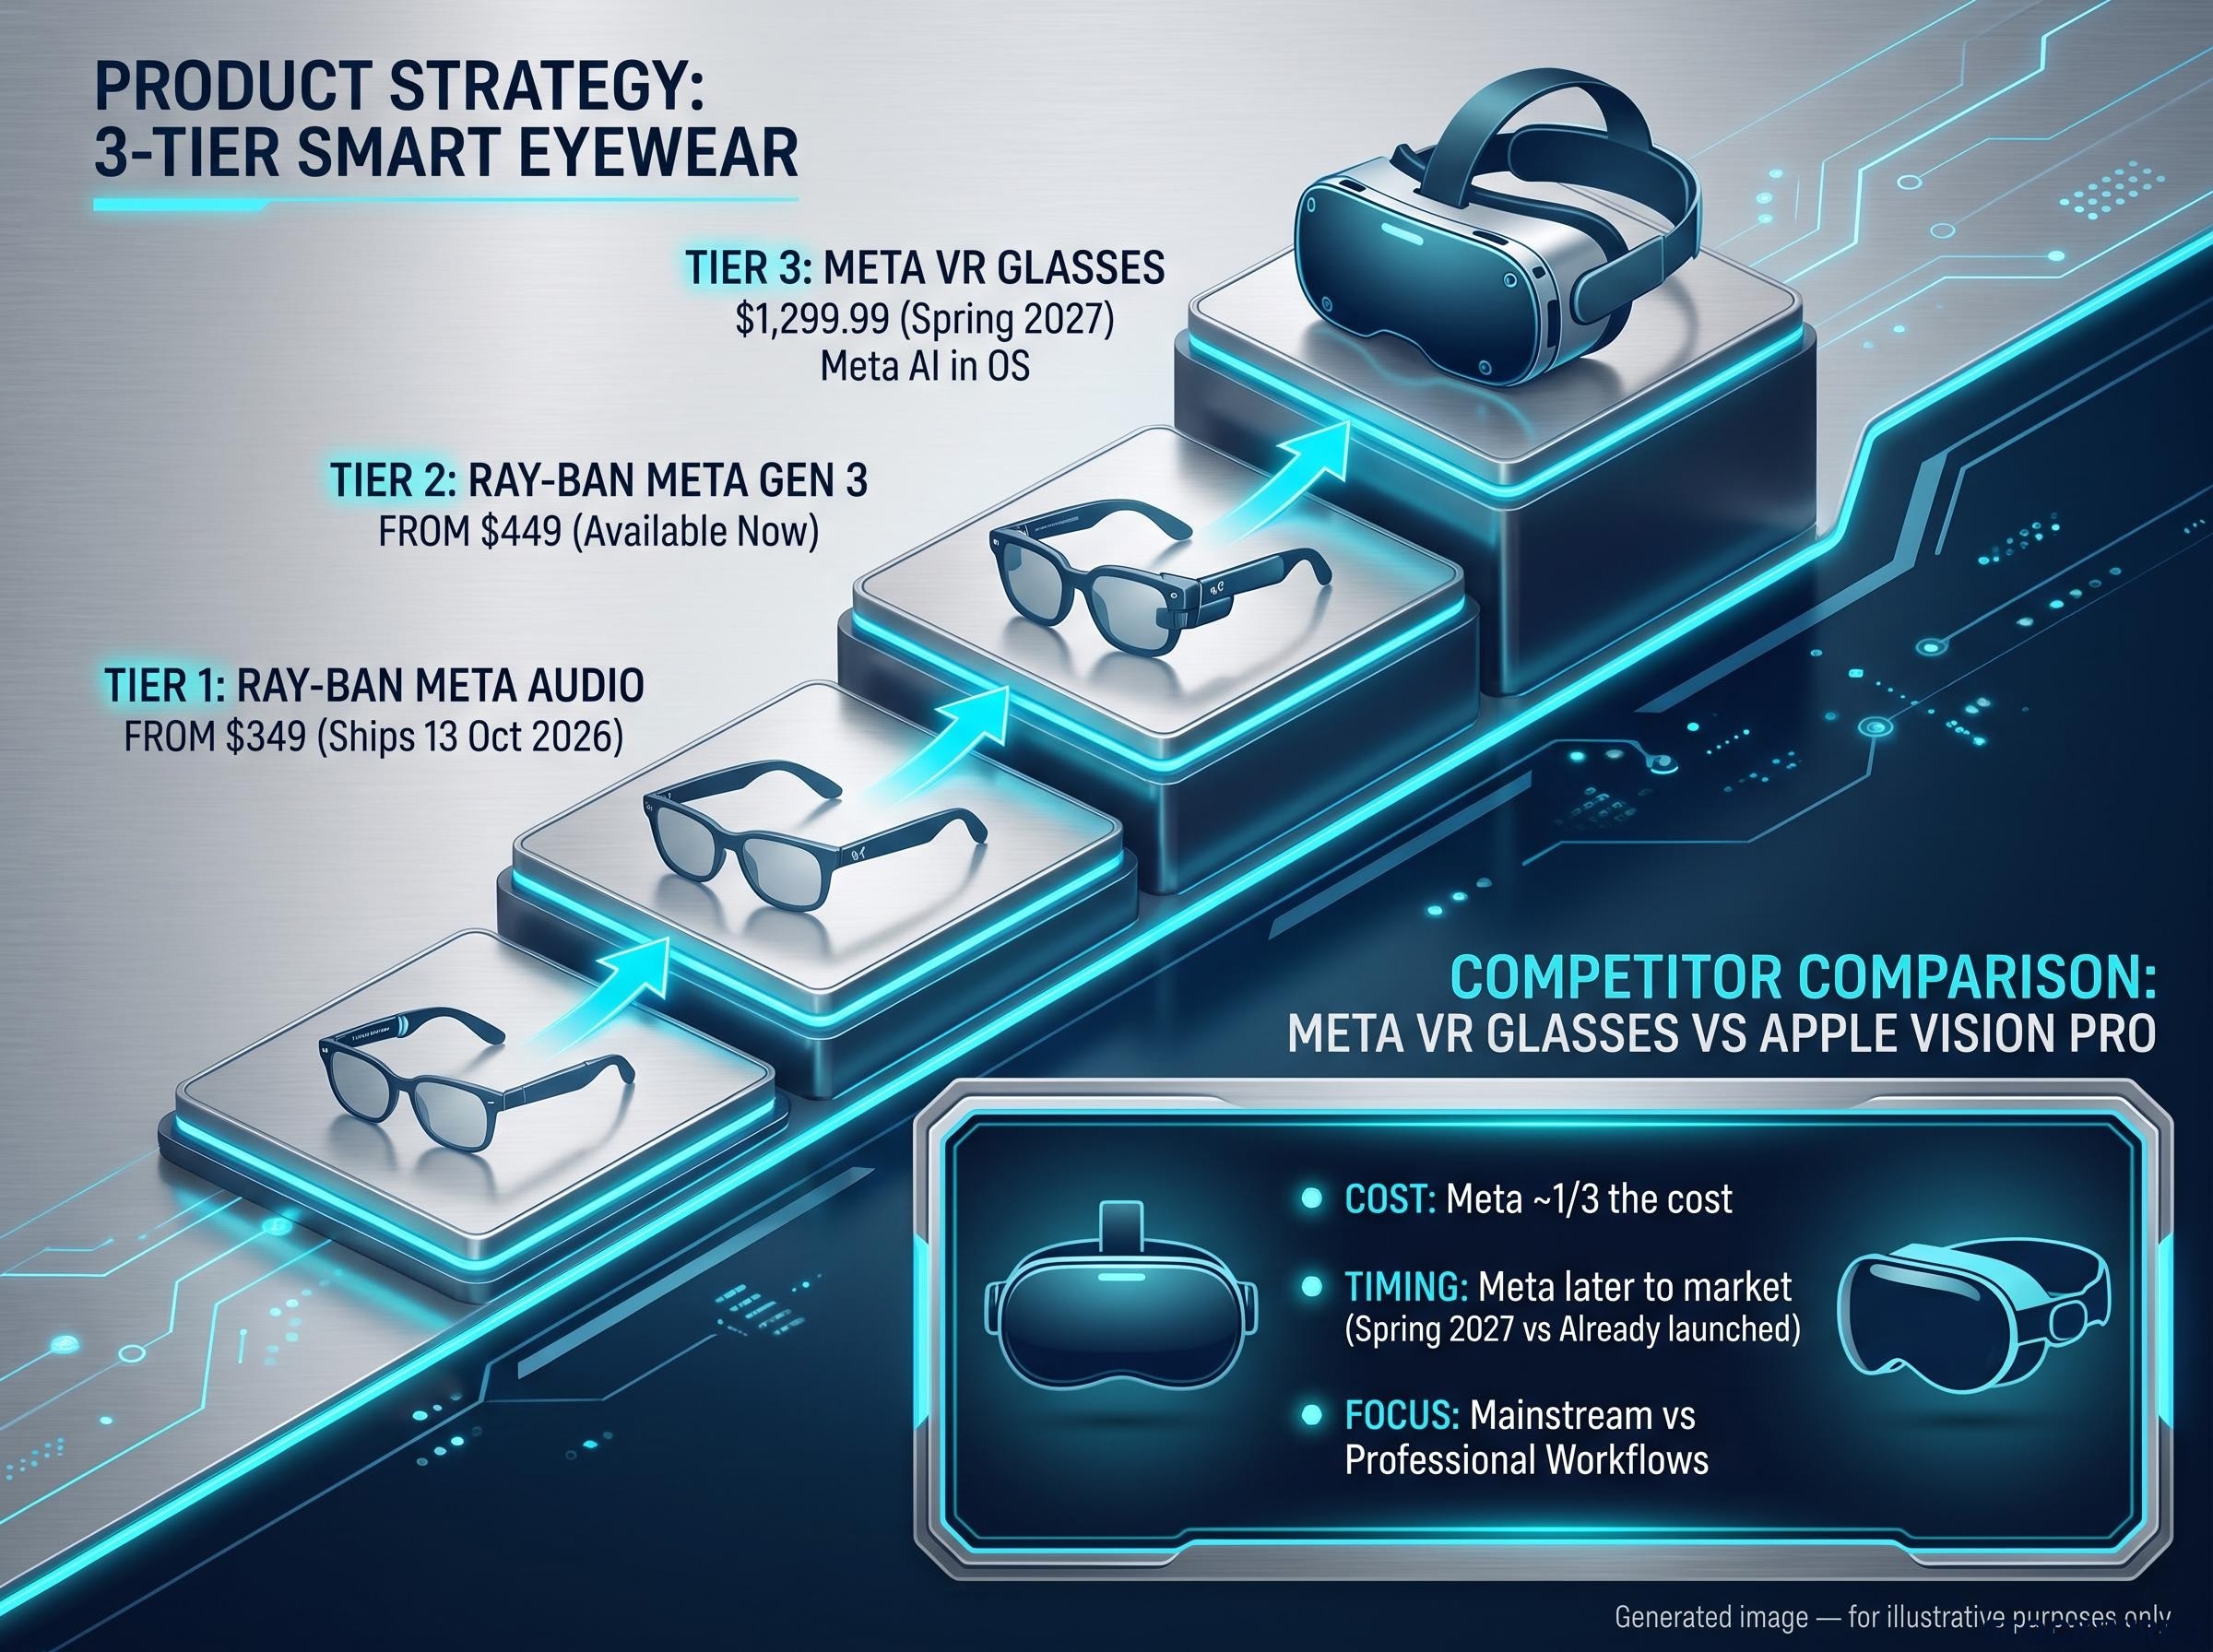
- Price: Vision Pro was expensive, and Meta directly confronts this by pricing at roughly one-third of the comparable introduction cost.
- Limited mainstream use cases: Meta’s consumer positioning helps, but a lower price does not by itself deepen the application ecosystem.
- Ergonomics: Comfort remains a hardware challenge that pricing cannot solve.
The single clearest differentiator Meta’s VR Glasses are priced at approximately one-third of Apple Vision Pro’s comparable introduction price, per original analyst commentary. Accessibility is where Meta most clearly separates itself.
Here is what the Apple comparison actually teaches you as an investor. Price accessibility is a necessary condition for mainstream adoption, but it is not a sufficient one. The spring 2027 window gives the market roughly six months from now to judge whether Meta’s application ecosystem and hardware comfort have matured enough to avoid the same stall.
That makes this the event-risk section of the thesis. A weak launch at $1,299.99 would not just disappoint on direct hardware revenue; it would call into question the returns case for the entire AI infrastructure build behind it.
Reading the setup before the $800 test arrives
Four threads now sit on the table, and together they form a framework you can actually monitor rather than a price target you have to trust. The resistance band at $780-$796, the capex-to-cash-flow trajectory through 2026, talent retention stability, and the VR Glasses reception in spring 2027 each carry independent signal.
The point is not to predict which way the $800 test breaks. It is to know precisely which data points to watch over the next two quarters, and what each one’s direction would tell you about your own position.
For investors new to interpreting price structure, our full explainer on reading stock charts covers candlestick formats, volume confirmation, and multi-year timeframe selection, the foundations needed to assess whether a resistance test like this one carries structural weight or is simply noise.
Here are the four variables and what a positive versus negative reading looks like for each:
- Technical resistance ($780-$796): A sustained close above $796 on volume is bullish; a rejection candle at the band is the warning sign.
- Capex and cash flow: Evidence of AI monetisation progress in Q3 and Q4 2026 earnings supports the thesis; further free cash flow compression beyond the $145 billion upper guidance undermines it.
- Talent retention: Stability supports the product roadmap; any signal of researcher disruption reintroduces the self-referential risk.
- VR Glasses reception: A clean spring 2027 launch validates the hardware bet; weak preorder signals do the opposite.
Bull case conditions vs. bear case signals
For the setup to support a genuine break above $800, three things would need to line up: a technical close above $796.25 on volume, Q3 2026 earnings that show tangible AI monetisation progress, and no negative preorder signal from the VR Glasses.
The bearish path is the mirror image. A rejection at the resistance band, free cash flow compression beyond current guidance, or any disruption to AI talent retention would each reopen the lower levels, with the $536 August low and even the lower-$500s back in view as plausible retest zones after a roughly $210 per share run.
The stock has voted twice that it is fully valued near $800. This time you have a scorecard to read the third vote as it happens.
This article is for informational purposes only and should not be considered financial advice. Investors should conduct their own research and consult with financial professionals before making investment decisions. Past performance does not guarantee future results. Financial projections are subject to market conditions and various risk factors, and the forward-looking scenarios described here are speculative and subject to change based on market developments and company performance.