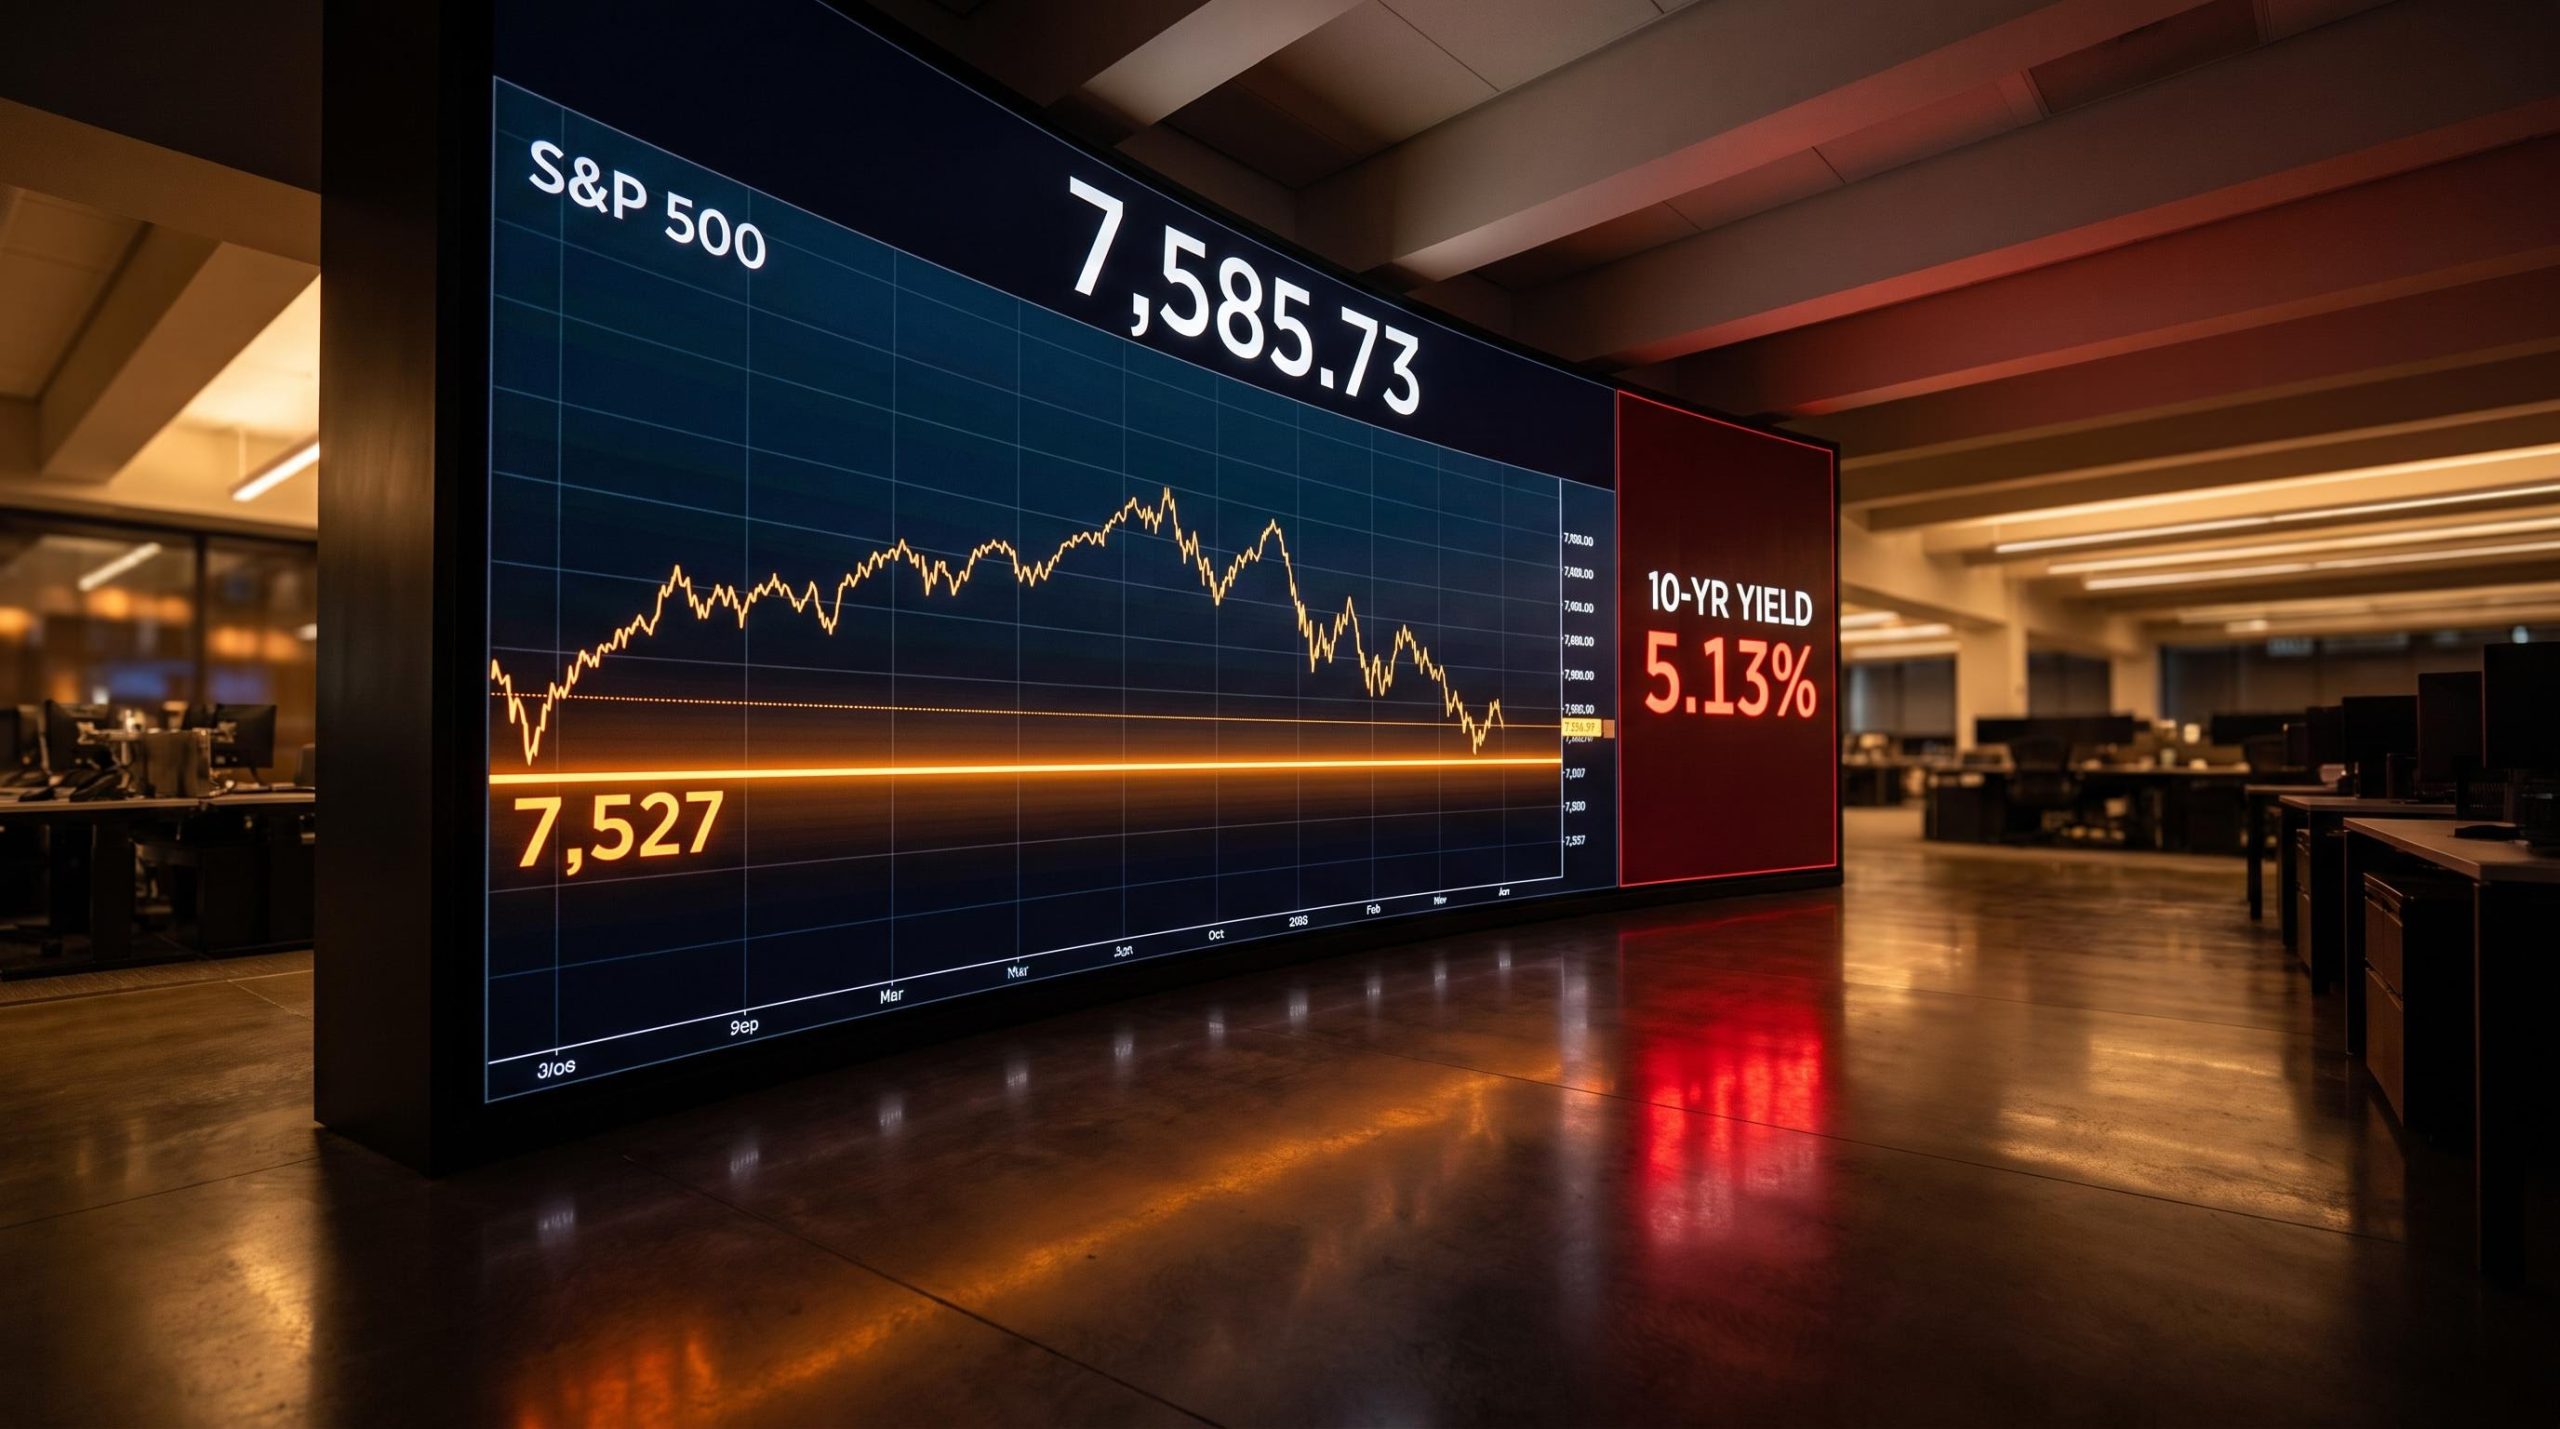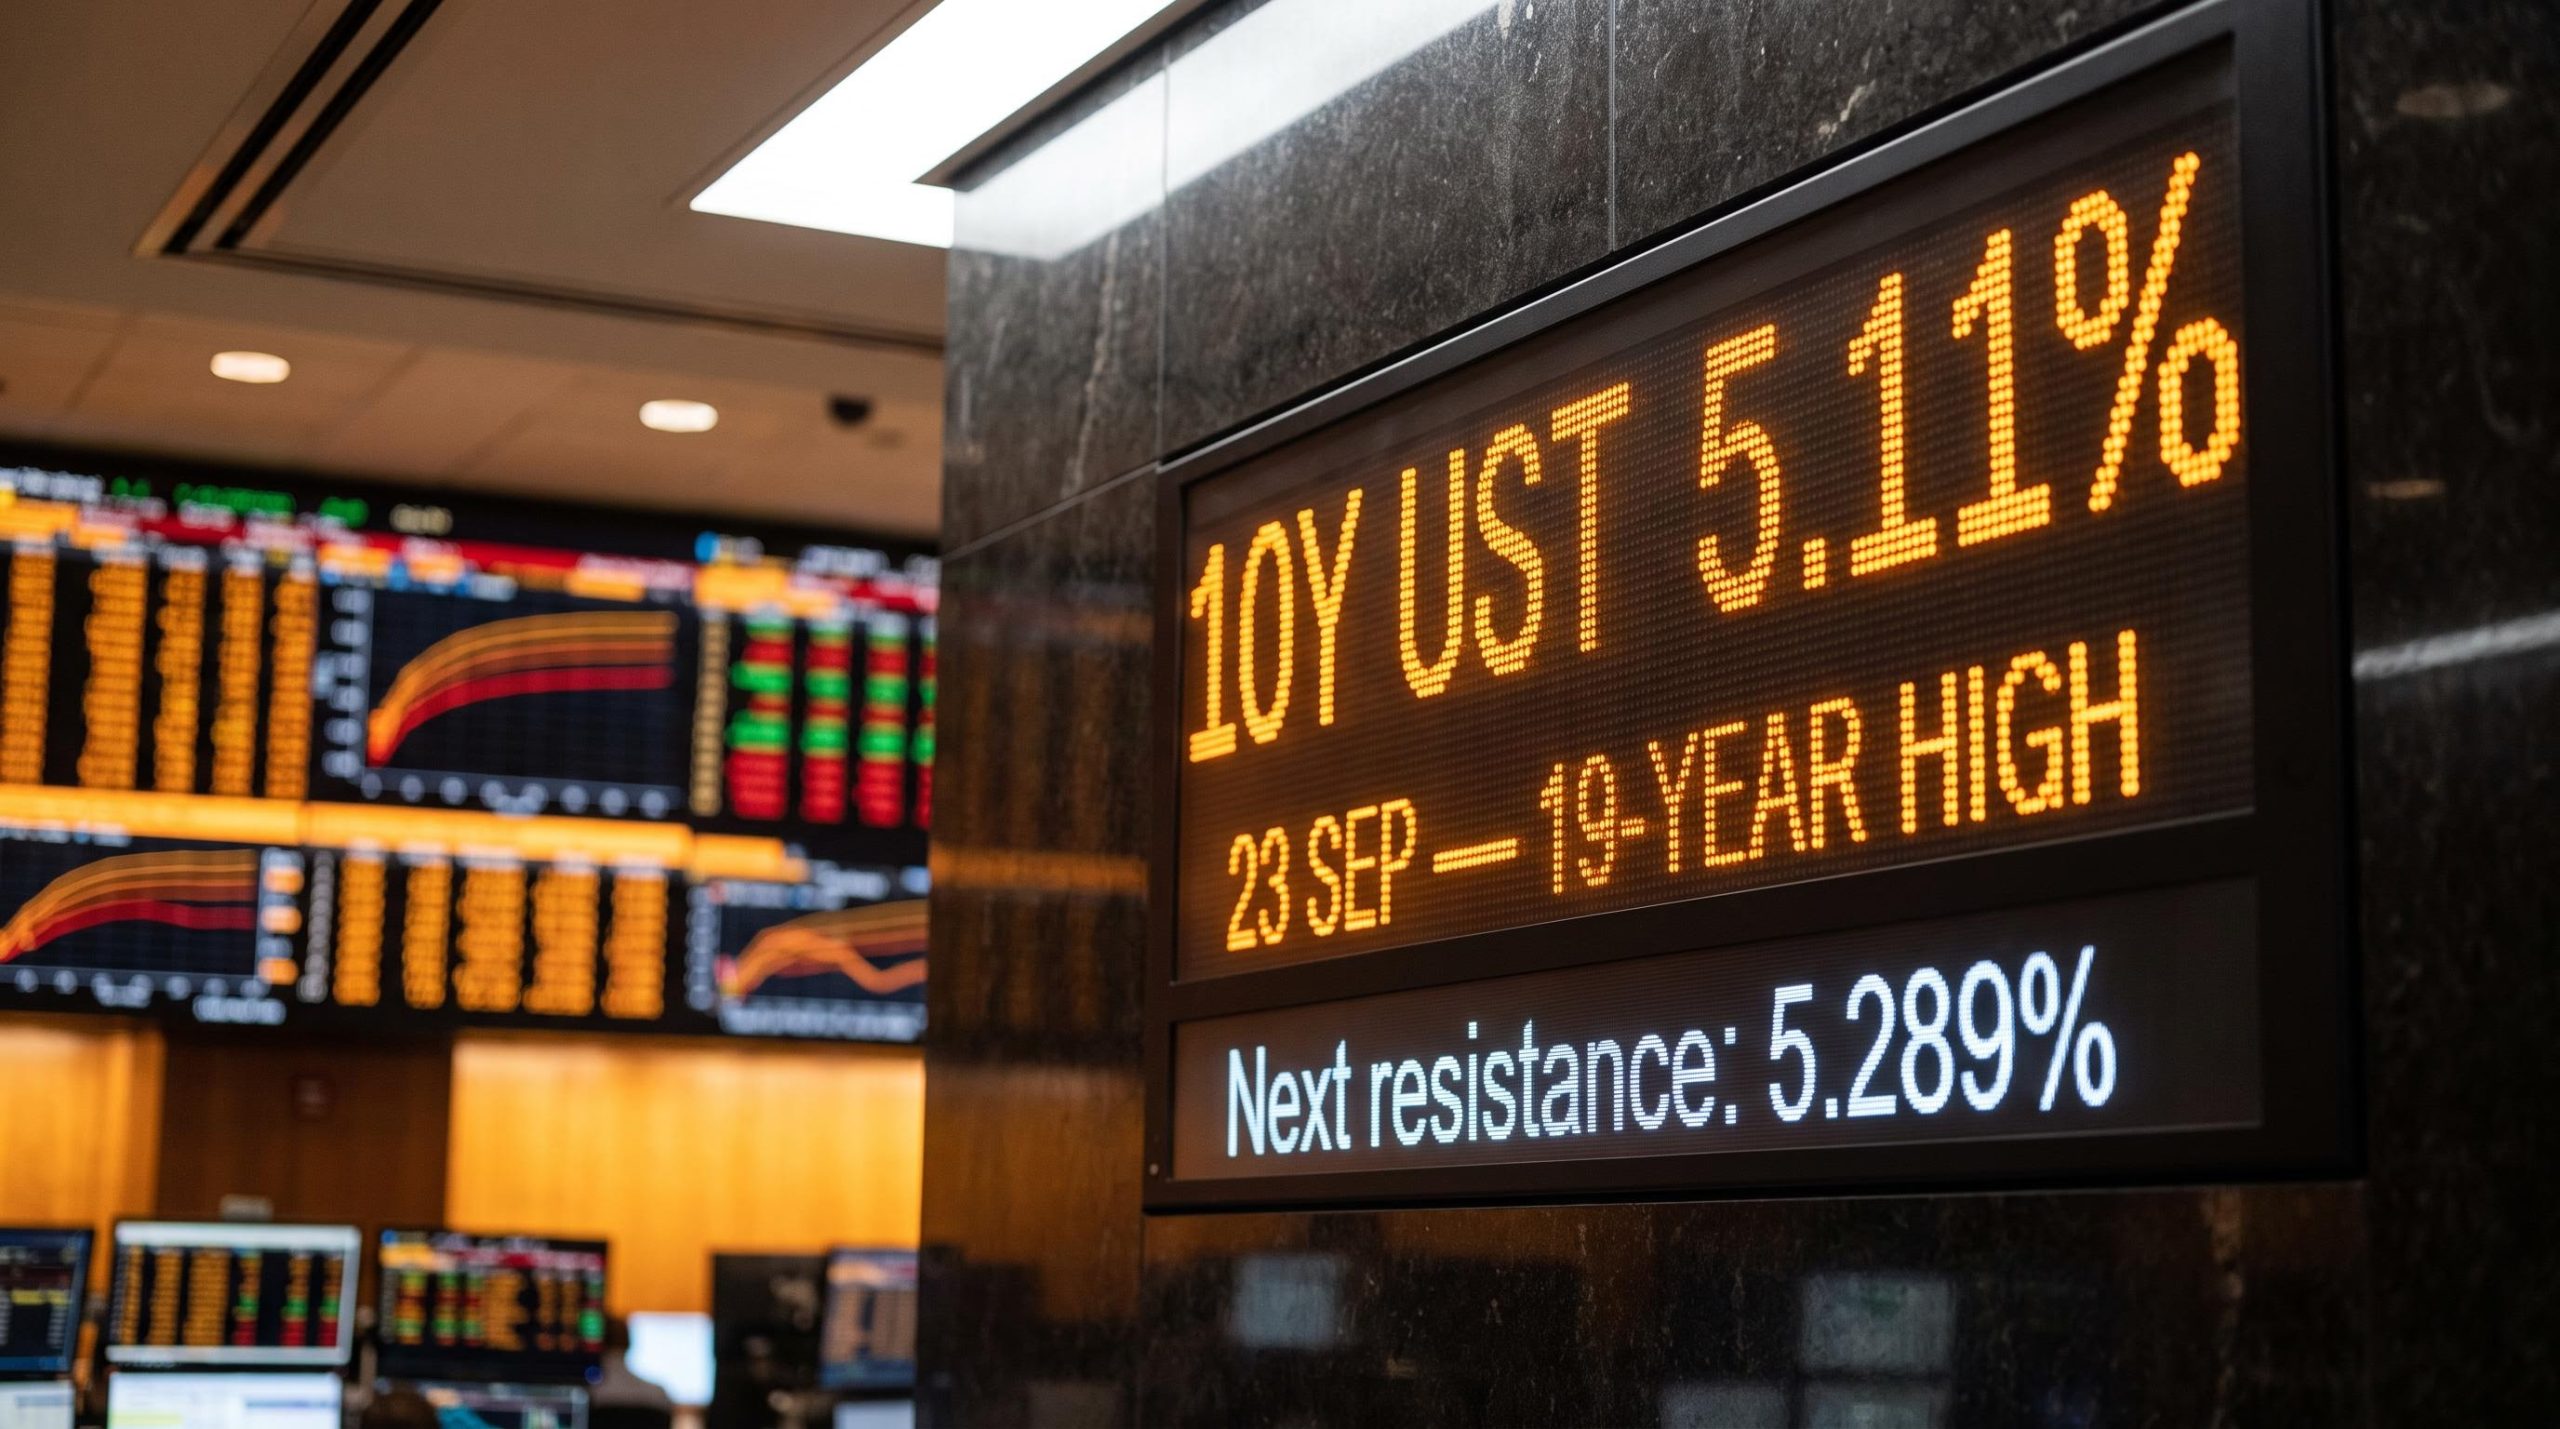
The 10-year Treasury yield closed 23 September at 5.11%, its highest settlement in roughly 19 years. That single data point is doing more to reshape positioning across equities, commodities, and rate expectations than any single Federal Reserve decision this cycle.
The move from below 4.8% in early September to above 5.1% in roughly three weeks is not a routine repricing. It has pushed relative strength readings past overbought territory on both daily and weekly timeframes, placed the next meaningful resistance at 5.289% (the pre-financial-crisis high), and driven CME FedWatch odds of an October rate hike into a wide but elevated range.
Each of those facts alone is notable. Together, they describe a market reconsidering its assumptions about where rates finally settle. Here is a framework for reading what this move is actually signalling, which assets face the most direct pressure, and how to hold both competing interpretations at once without getting trapped in a single narrative.
A 19-year high with a clear next target: the 5.289% pre-crisis ceiling
To understand why 5.289% matters, follow how the yield got here. This was not a single lurch higher. It was a sequence, and each step tightened the logic of the one before it.
The base was set in late August, with the 10-year sitting near 4.73%. From there the climb was steady rather than violent, until it hit the level that carries the most psychological weight in the entire rate complex.
- 8 September: The yield pushed above 4.8% intraday, closing near 4.786%, as oil prices firmed ahead of key inflation data.
- 14 September: The 10-year touched 5% for the first time since 2007, a level CNN described as a “critical threshold” for the US economy.
- 22 September: A short-term pullback, with the yield closing at 4.96%, hinting that 5% might act as a ceiling.
- 23 September: A renewed surge to a 5.11% close, with intraday highs near 5.14%.
That final session did the heavy lifting. According to CNBC, the intraday move exceeded 13 basis points, the largest one-day jump since 7 April 2025.
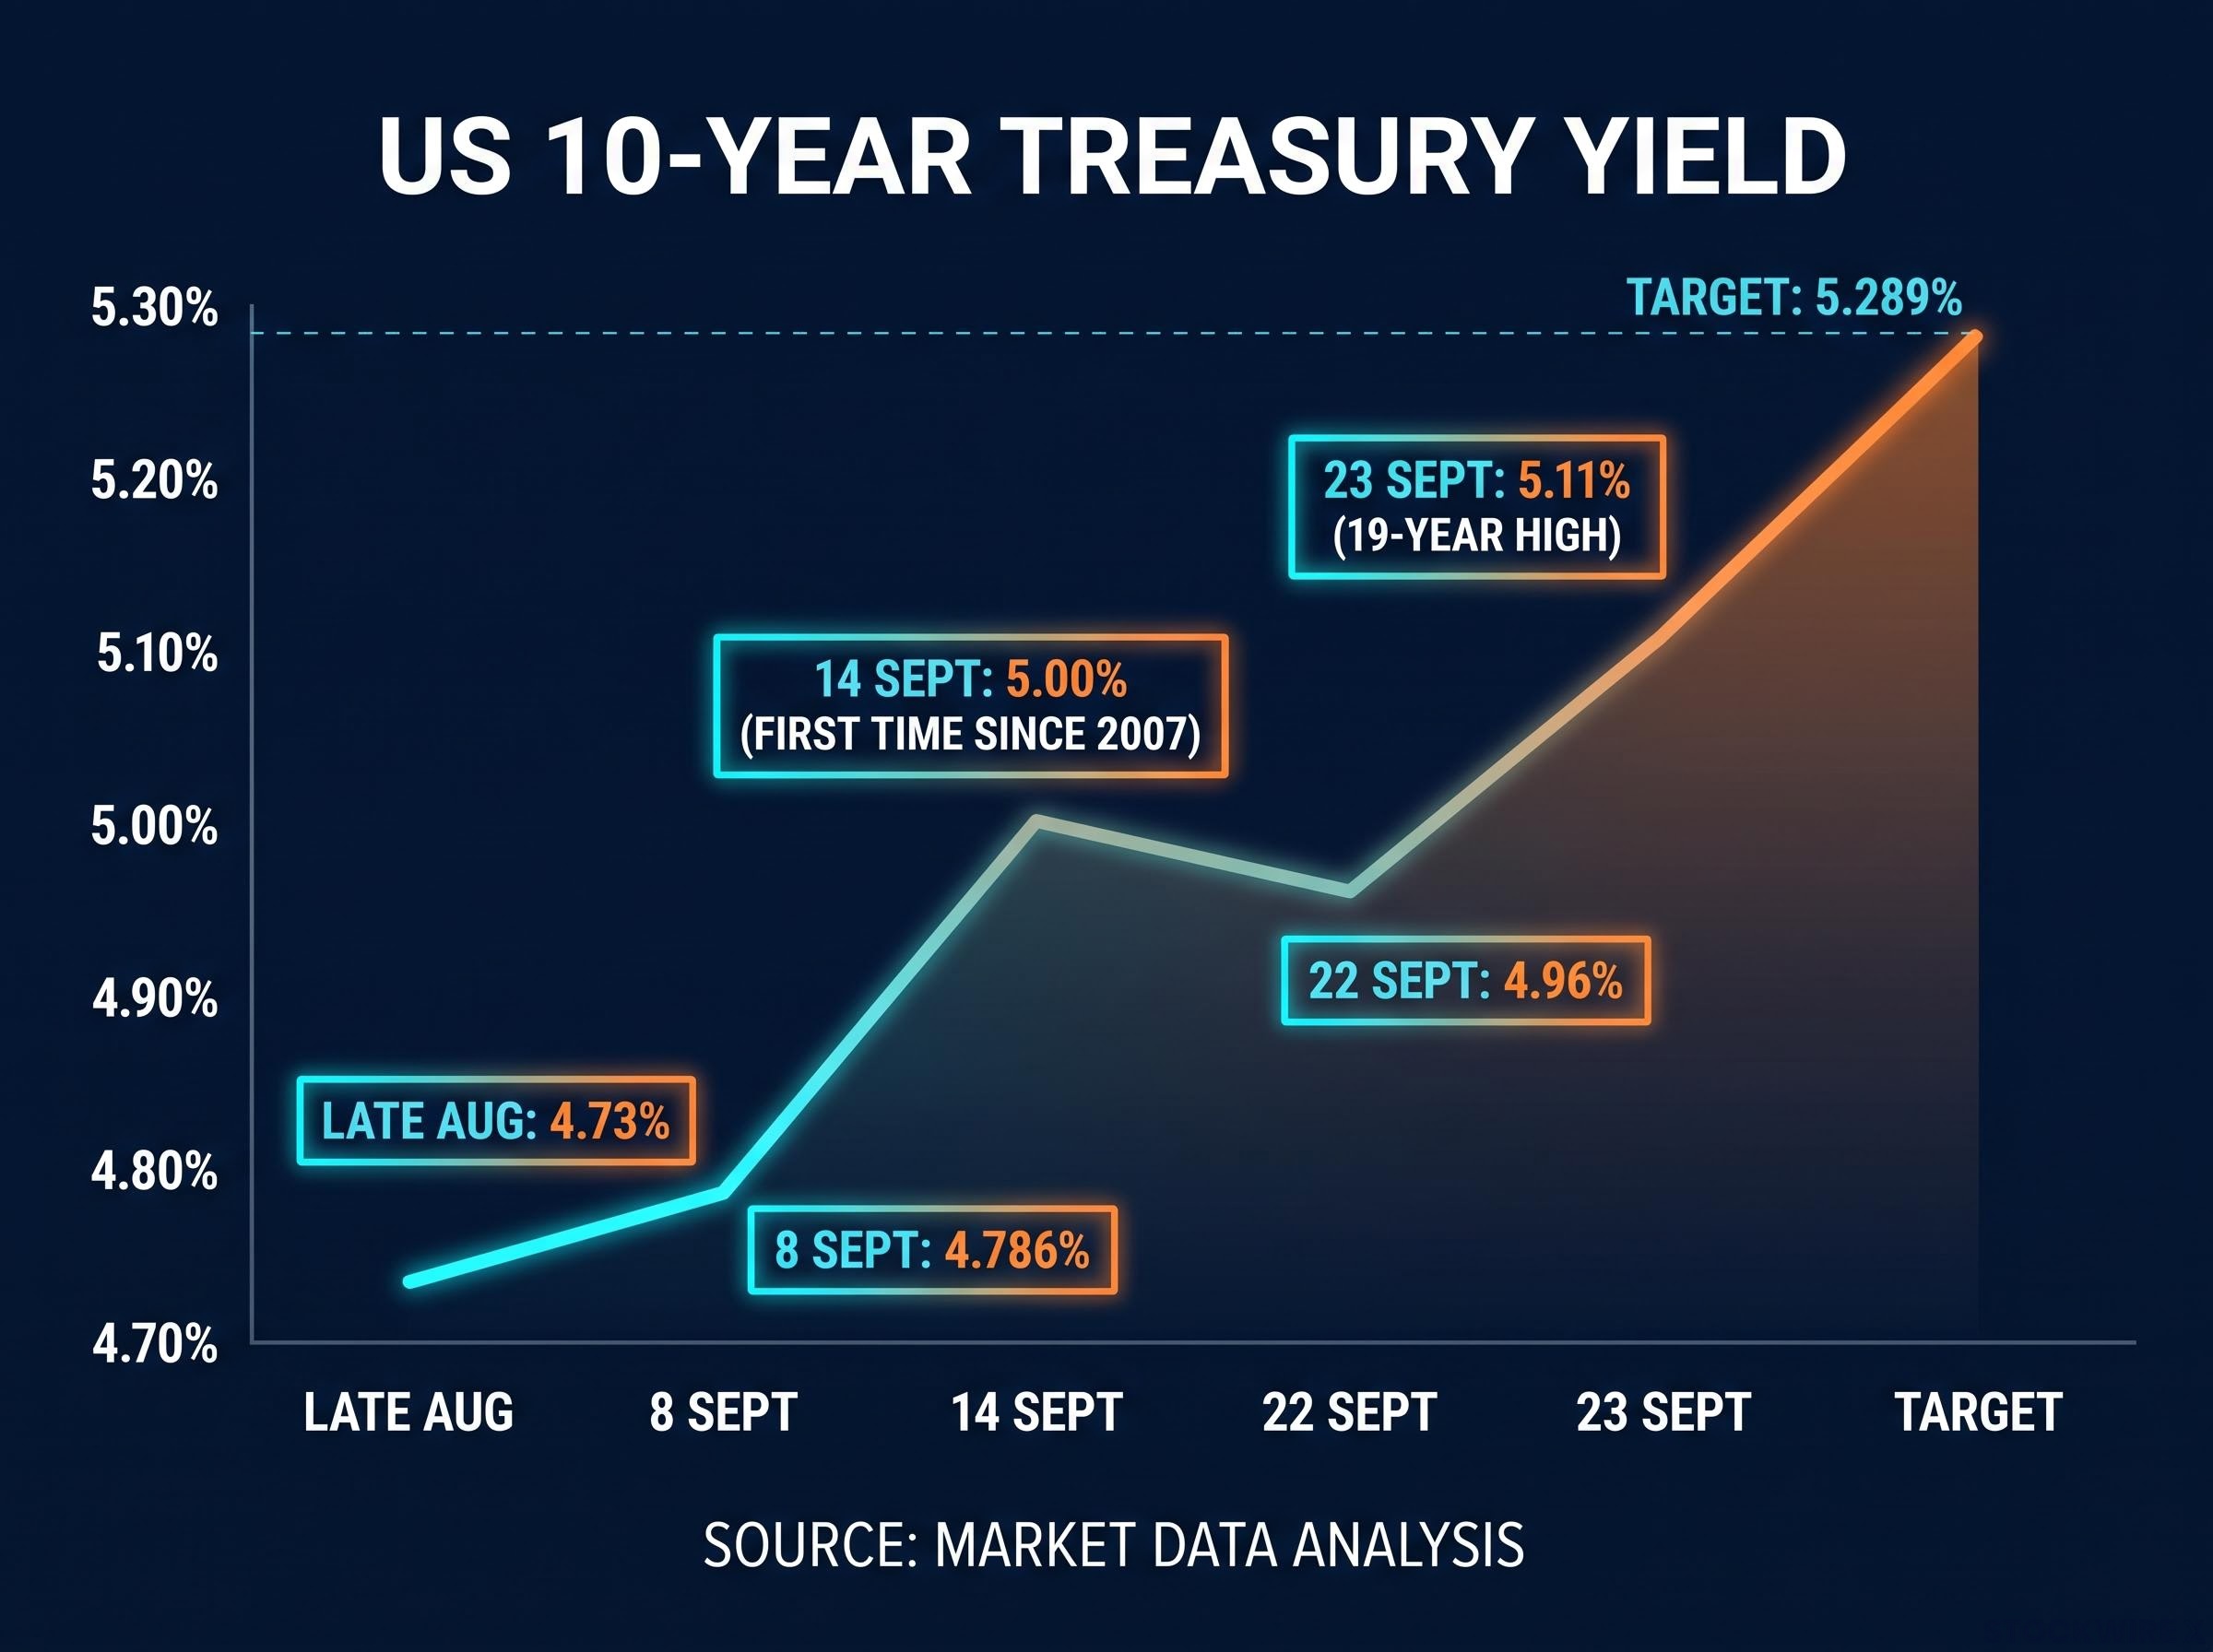
FRED DGS10 in one session Close of 4.96% on 22 September. Close of 5.11% on 23 September. A 15-basis-point round trip through the most watched level in fixed income.
The technical picture is stretched. Daily RSI reached roughly 75.69 and weekly RSI roughly 78.17, both firmly in overbought territory. A reading above 70 conventionally warns that a move has run hot and may be due for a pause.
Here is the part that matters for how you read the chart. The yield kept advancing despite those signals. In a strongly trending move, overbought conditions frequently precede consolidation rather than a genuine reversal, which means the pullback to 4.96% behaved like a pause, not a top.
That is why 5.289% is now a live target rather than a distant scenario. It represents the last sustained high before the 2008 financial crisis, and its weight is as much psychological as numerical. If the yield reaches it, the playbook for equities and rate-sensitive assets shifts materially again, and you want that reference point mapped before price gets there, not after.
The FRED DGS10 series tracks daily 10-year constant maturity Treasury yields back to 1962, providing the full historical context that makes the September 2025 readings above 5.1% and the 5.289% pre-crisis reference verifiable against the prior rate cycle.
When big ASX news breaks, our subscribers know first
What is actually driving yields this high, and why this time feels different
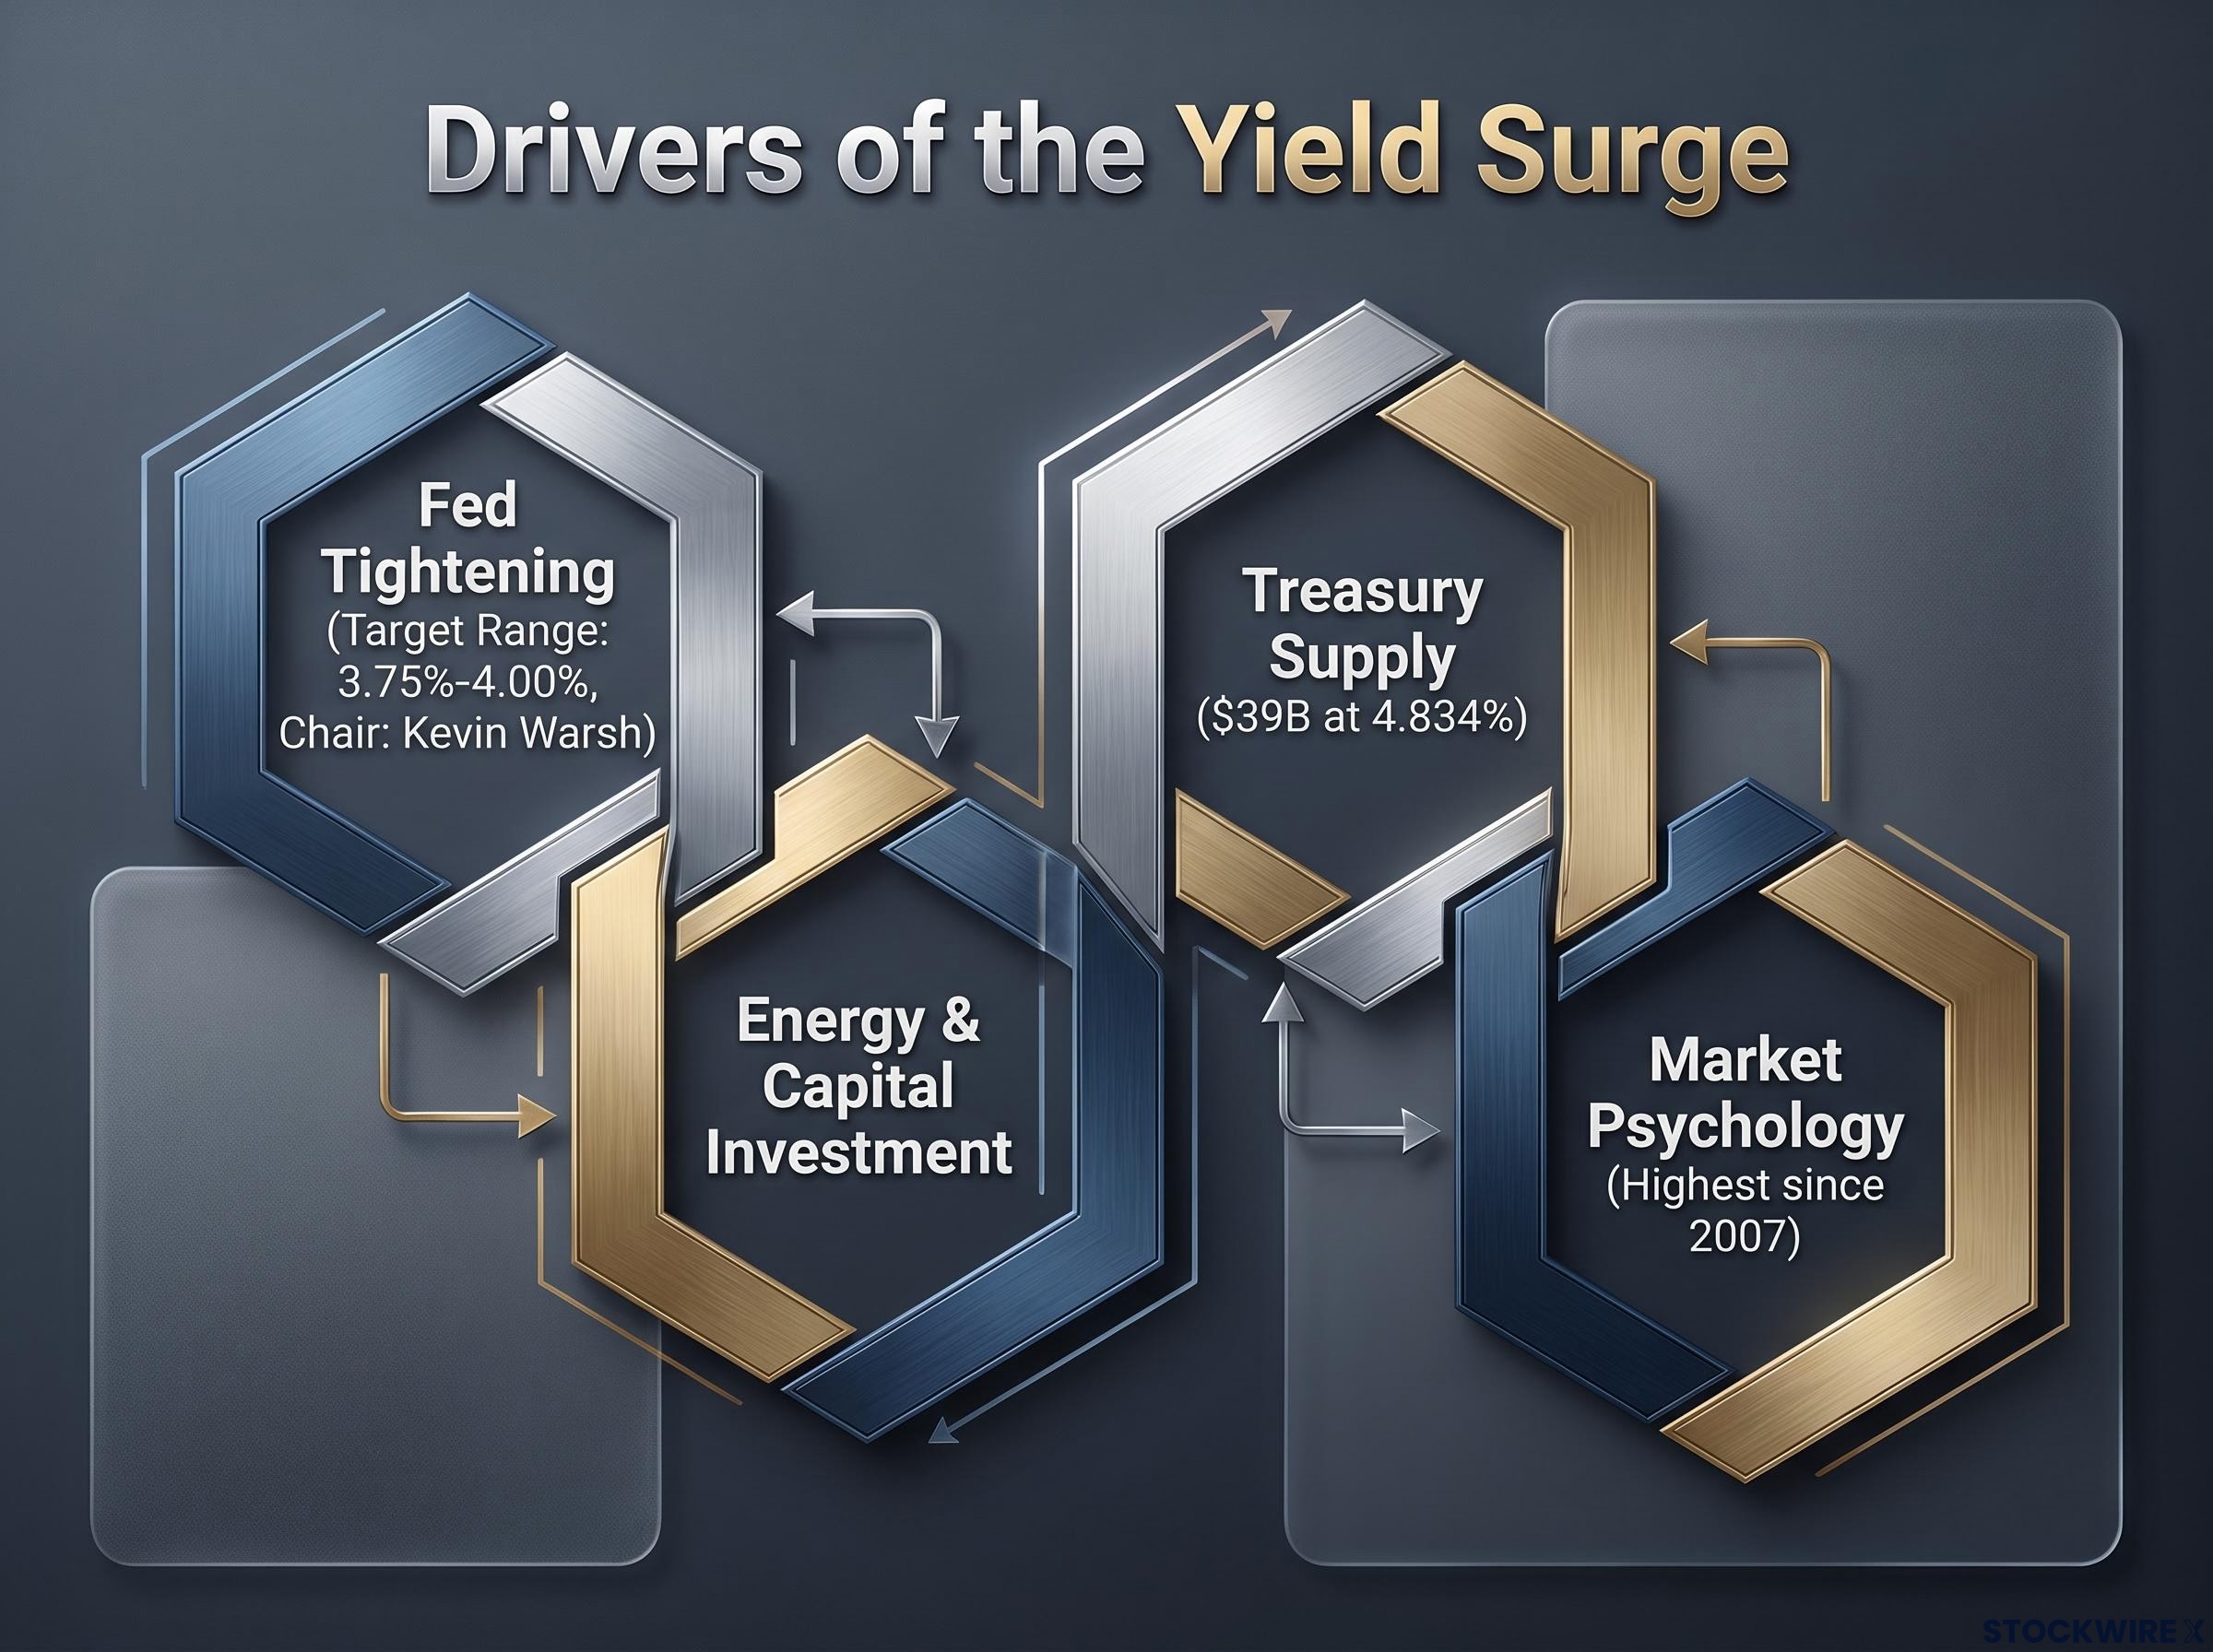
A single trigger can reverse. Several overlapping forces are far harder to unwind, and that distinction is the whole story of this move. The 10-year is not responding to one catalyst. It is absorbing four, and they compound each other.
- Fed tightening and hawkish signalling. The most recent rate hike lifted the federal funds target range to 3.75%-4.00%, described by CNBC as the first increase in three years. Comments from Fed Chair Kevin Warsh stressing persistent inflation risk pushed the market to revise its view of where the policy endpoint sits. This is the primary policy anchor beneath everything else.
- Energy-driven inflation meeting capital investment demand. Bloomberg framed the broader bond selloff as the product of booming capital investment and soaring energy prices, both feeding inflation and the term premium built into longer-dated bonds. The 8 September move above 4.8% tracked directly with rising oil ahead of inflation data.
- Treasury supply and auction mechanics. Reuters reported the government sold $39 billion in 10-year notes at roughly 4.834%, paired with an enlarged buyback of longer-dated bonds that disappointed investors wanting more. When supply pressure meets underwhelming buyback support, holders demand higher yields to take on long-dated paper.
- The psychology of multi-decade thresholds. Repeated “highest since 2007” and “19-year high” framing across major outlets is not just colour. Breaching long-standing levels reinforces selling and repositioning flows, becoming a driver in its own right.
The auction dynamics behind bond yield mechanics, where competitive bidding sets the initial price and secondary-market activity continuously reprices it based on inflation signals and policy expectations, explain why Treasury supply events like the $39 billion 10-year note sale can move yields independent of any Fed action.
Why the mix matters more than any single cause
Notice that these are not alternatives competing to explain the move. They stack. Policy tightening raises the front end, energy and investment lift the inflation and term-premium components, supply dynamics push the long end, and psychology amplifies the whole thing.
For anyone holding equity or bond exposure, that structure carries a hard implication. A single piece of good news, a softer inflation print for instance, is unlikely to reverse this. You would need several of these pressures to ease at once.
That also clarifies your watchlist. An energy pullback addresses one engine. A dovish shift in Warsh’s language addresses another. Neither alone resolves the picture, which is precisely why this move feels different from a positioning-driven spike.
How rising yields are transmitting across equities, gold, and silver
The 10-year yield is the benchmark risk-free rate, and that single role explains its reach across markets. When it rises, it changes the maths behind almost every other asset. Understanding the mechanism first makes the price action that follows readable rather than random.
For equities, the channel is the discount rate. Valuation models discount future corporate earnings back to today, and a higher risk-free rate raises the denominator in that calculation.
Discount rate compression works through the present-value denominator in every valuation model: as the risk-free rate climbs, even unchanged earnings estimates produce lower intrinsic value readings, and the effect scales with duration, hitting long-dated growth cash flows far harder than near-term income streams.
The present value of future cash flows falls, and it falls hardest for long-duration growth stocks whose earnings sit far out in the future. This is the same mechanism that drove sharp underperformance in technology and unprofitable growth names during the 2022 tightening cycle.
First Solar (FSLR) shows this in real time. The stock broke down from an ascending parallel channel that had held since the April 2025 lows, retraced to the breakdown level, then resumed lower in a bearish flag, a pattern that points to continued downside as the base case. The identified near-term bounce level near $160.30 aligns with a Fibonacci retracement and a gap fill, marking a relief target rather than a reversal signal.
For precious metals, the channel is the real yield: the nominal yield adjusted for inflation expectations.
The real yield mechanism Gold and silver pay no income. When real yields rise, Treasuries offer higher real income with less price risk, which removes the relative appeal of holding non-yielding metals.
Both metals are re-pricing that competition now. The table below maps where each asset sits and the levels that now function as reference points.
| Asset | Current Price / Level | Key Support | Broken Level / Resistance | Implied Pressure |
|---|---|---|---|---|
| Gold (spot) | ~$4,272-$4,275/oz | ~$4,227 | Ascending channel lost | Downward |
| Silver (spot) | ~$63.75-$64.19/oz | ~$61.30 | ~$64.75 (now resistance) | Downward |
| FSLR | Below channel | ~$160.30 (bounce target) | April 2025 channel lost | Downward |
Gold had already failed to hold its ascending channel and slipped further, with the next trend-line support at roughly $4,227. Silver’s story is sharper: 24 September marked its first confirmed close beneath the trend line it had been sitting on.
That silver break is more than a chart note. Its broken support at roughly $64.75 now acts as a ceiling, with the next downside marker near $61.30. If you hold commodity exposure, treat that former support as resistance until price proves otherwise, because the metal is now re-pricing its yield competition rather than debating it.
Overshoot or regime change? The two readings that determine your next move
Here is where the analysis has to hold two ideas at once, because the evidence genuinely supports both. Is this a positioning-driven overshoot that mean-reverts, or a structural shift to a higher-rate regime? The honest answer is that the data has not yet chosen.
The overshoot case rests on the speed and volatility of the move.
- Daily RSI near 75.69 and weekly RSI near 78.17 both flag overbought conditions that often precede mean reversion.
- The yield hit 5% on 14 September, retreated to 4.96% by 22 September, then re-surged, behaviour consistent with stop-loss flows and auction reactions rather than settled conviction.
- The 23 September single-day move above 13 basis points, the largest since 7 April 2025, points to disorderly speed rather than a smooth repricing.
The structural regime-change case rests on the drivers, not the tape.
- Bloomberg’s capital investment and energy framing describes forces that lift the long-run real rate rather than a temporary spike.
- The relentless “highest since 2007” and “19-year high” characterisations suggest a break from the post-2008 low-rate regime.
- The view that the global neutral rate has durably shifted higher would justify these levels as an equilibrium, not an aberration.
The pre-2008 analogy In the mid-2000s, 10-year yields near or above 5% coexisted with expanding credit and housing. Those same borrowing costs gradually exposed leverage across housing, private credit, and corporate balance sheets. Sustained high yields can look benign long before they bite.
The Fed futures market offers a clue that sits between the two camps. CME FedWatch implied roughly 54-70% odds of a 25-basis-point October hike, with roughly 30-46% for no change, and December odds in the mid-50% range.
That pricing tells you something specific. The market’s base case is not a return to aggressive multi-hike sequences; it is a soft landing into slightly higher rates. Both the overshoot and the structural readings can coexist with that base case depending on the horizon you are managing to.
That is the real takeaway. The overshoot view favours patience and holding duration; the structural view favours repositioning now. You do not need to know which wins to act, you need to know which one your time horizon exposes you to.
For readers wanting to stress-test the structural regime-change case against historical precedent, our full explainer on post-QE yield normalisation examines four decades of government bond data and live auction demand figures to assess whether 5% yields represent a return to pre-2008 norms or a genuine break from them.
What a 5.1% yield means for positioning before the October FOMC
Uncertainty is not the same as paralysis. You cannot know today whether this is overshoot or regime change, but you can watch the specific variables that will settle it. Three matter most in the near term.
- The yield relative to 5.289%. A clean test or break of the pre-crisis high would hand real credibility to the structural regime-change reading. Holding well below it keeps the overshoot case alive.
- The October FOMC decision and Warsh’s language. This is the next major binary event shaping the probability structure. A hike paired with hawkish framing sustains the pressure; a pause or softer tone loosens it.
- The energy price trajectory. Oil has already been tied directly to the September moves. A sustained pullback removes one of the four engines driving yields.
FOMC structure and forward guidance shape the yield curve well before any formal rate decision lands; the gap between what voting members signal and what markets price is where the most actionable repositioning windows open, which makes Warsh’s language at the October meeting a more consequential variable than the hike-or-hold binary alone.
Not every equity is reacting identically, which is itself instructive. Hewlett Packard Enterprise (HPE) closed above a declining trend line for a second consecutive session and printed an intraday high of $65.48, edging into potential price-discovery territory. Meta Platforms is pressing a resistance cluster near its $796.25 prior high and the roughly $800 weekly channel level tracked since December 2023. Rate pressure is a headwind, not a universal cap.
The clearest near-term tell Whether the 10-year holds above 5.1% or retreats before the October FOMC will reveal more than any single data release. Sustained holding implies structural supply and inflation dynamics. A sharp retreat implies a positioning-driven overshoot.
Given that genuine uncertainty, concentrated bets on either a rapid reversal or a permanently higher-rate world both carry asymmetric risk. Diversifying across duration and asset classes is the sober response to a debate the data has not yet resolved.
This article is for informational purposes only and should not be considered financial advice. Investors should conduct their own research and consult with financial professionals before making investment decisions. Past performance does not guarantee future results, and these statements are speculative and subject to change based on market developments.