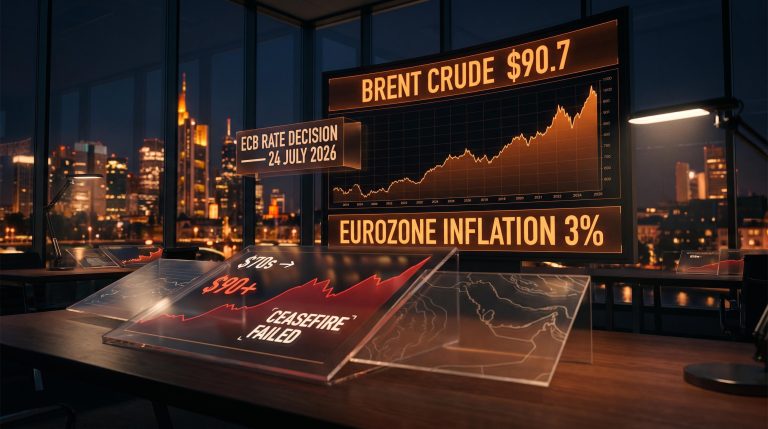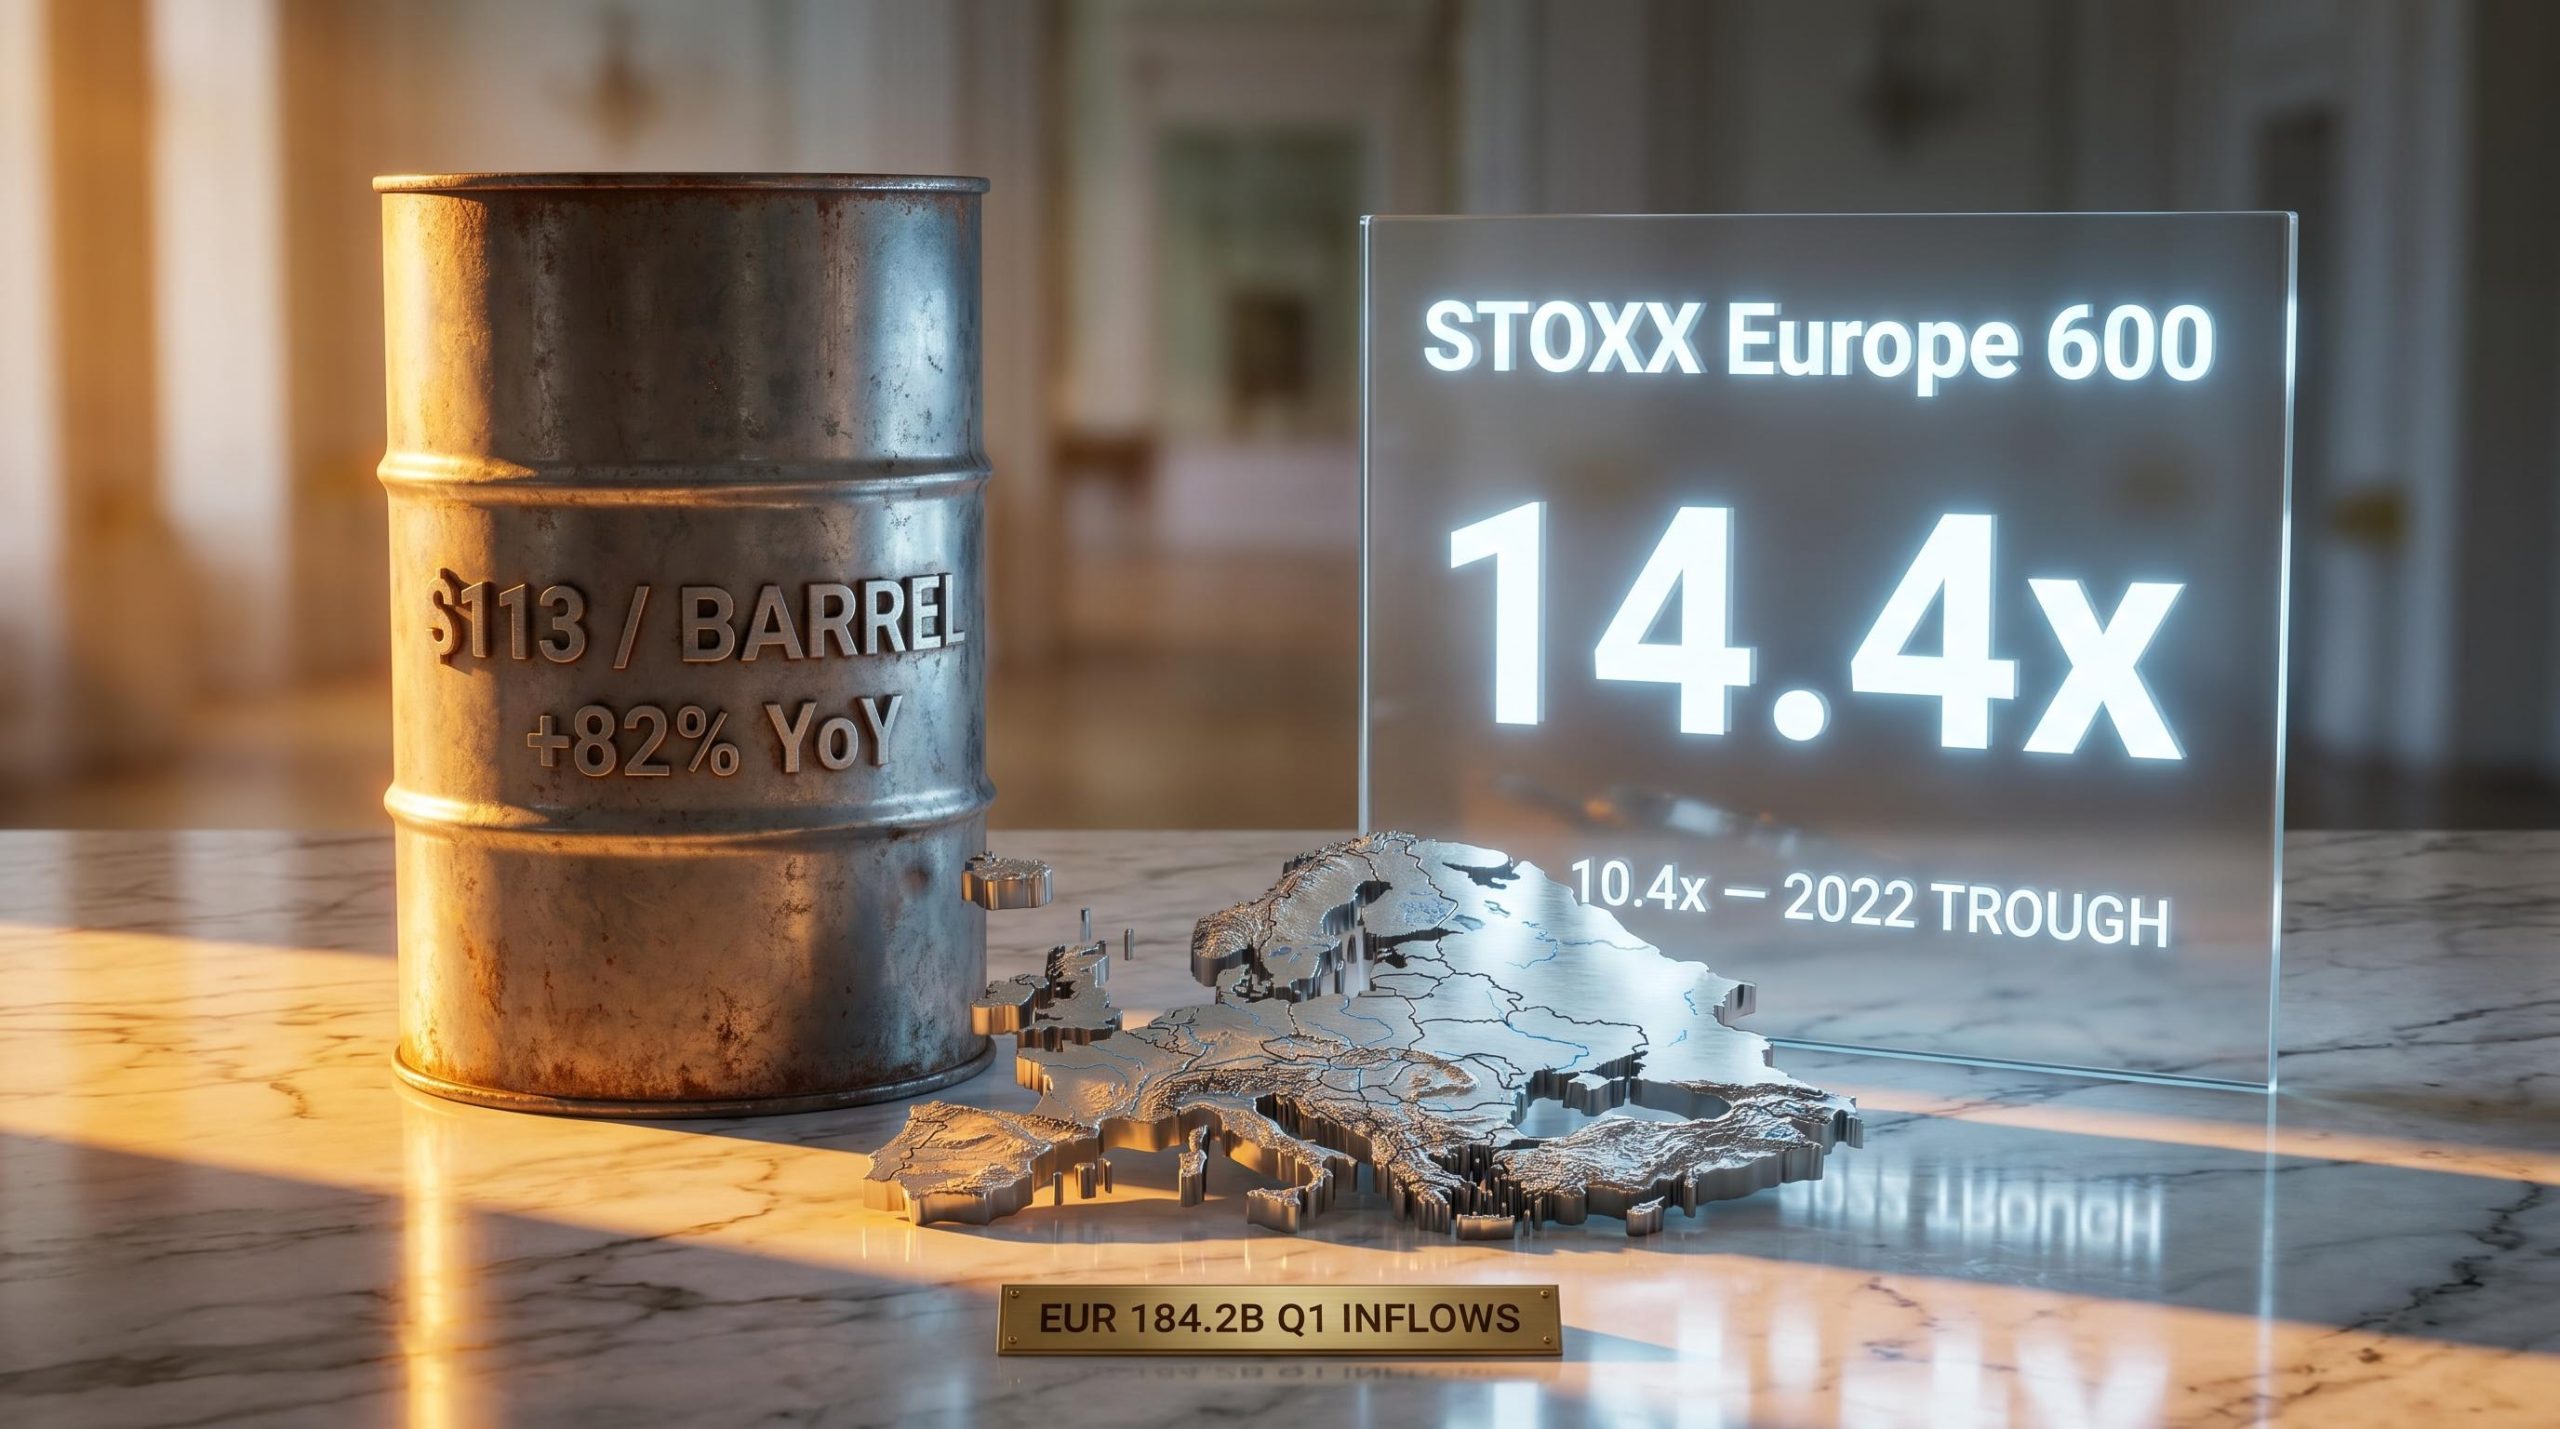
European equities are trading at 14.4x forward earnings in the middle of a Middle East conflict that has sent Brent crude to $113 per barrel. Goldman Sachs strategists have described this valuation resilience as the most surprising aspect of current market behaviour, and the numbers support that assessment.
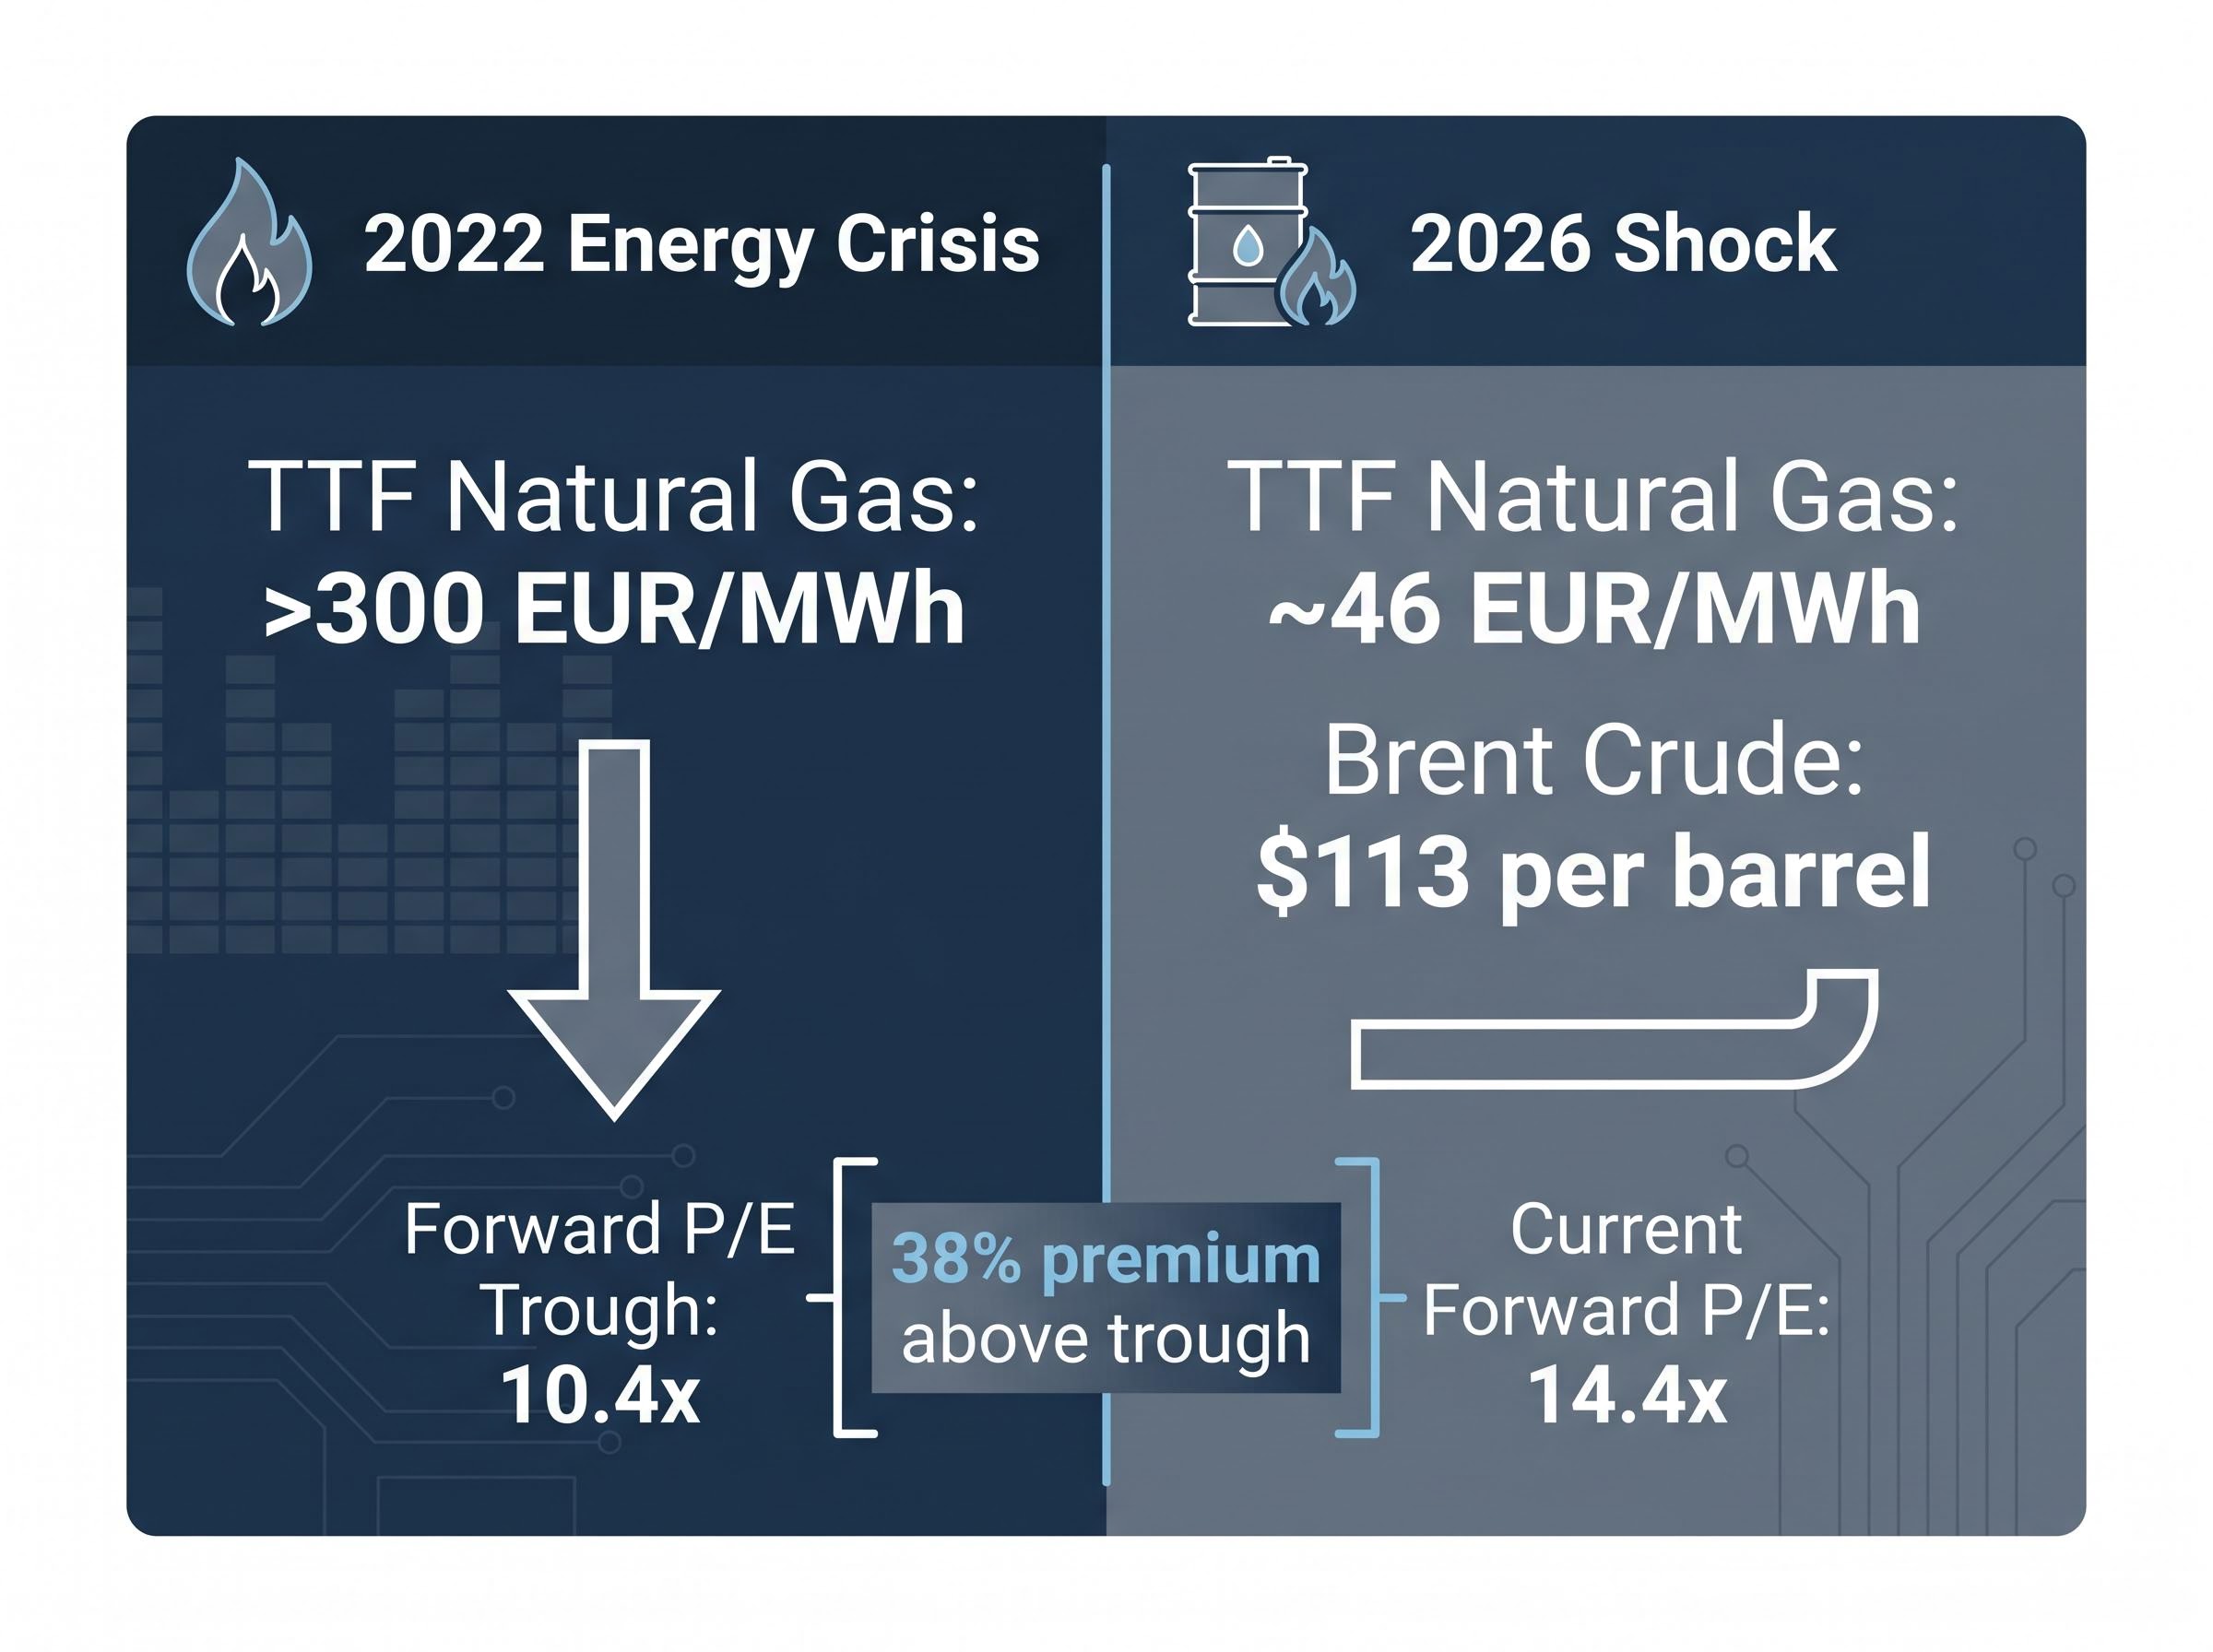
A geopolitical shock of this magnitude has historically triggered a sharp jump in risk premiums and a rapid derating of equity multiples. The 2022 energy crisis compressed Europe’s forward price-to-earnings ratio (P/E) to 10.4x. That precedent makes the current multiple, still 38% above that trough, difficult to explain at first glance.
What follows unpacks why European equity valuations have held, how oil price sensitivity flows through markets and why the transmission channel matters more than the headline price, which sectors are capturing the rotation, and what Goldman Sachs’s updated strategic framework means for portfolio positioning through the second half of 2026.
Why European stocks haven’t cratered despite a major oil shock
Geopolitical disruptions of this scale have historically triggered sharp risk premium increases. The pattern has not materialised in 2026.
The STOXX Europe 600 sits at approximately -0.89% year to date and roughly 4% below its pre-conflict peak. Those are modest drawdowns for an index absorbing an 82% year-over-year surge in Brent crude. Part of the explanation is mechanical: ongoing earnings growth and the rolling forward of estimates have modestly reduced the aggregate P/E from recent highs even without a meaningful price decline. The multiple has compressed slightly under its own momentum rather than through forced selling.
The April 30 Brent crude spike above $125 per barrel, which the IEA estimated had removed approximately 13 million barrels per day from global circulation, represents the single largest supply disruption in the current crisis window; the subsequent partial retracement to $113 reflects contradictory diplomatic signals rather than any restoration of throughput.
The other factor is positioning. U.S. investors sold European equities heavily from 2022 to 2024, which left the marginal seller pressure that typically accelerates drawdowns structurally absent when the conflict began. The buyers who remained were diversification-driven allocators, not momentum traders, and their mandates do not reverse on a single geopolitical event.
Goldman Sachs strategists have described the resilience of European equity valuations as “the most surprising aspect” of current market behaviour, given the severity of the underlying energy shock.
How the current shock compares to 2022
The distinction is one of magnitude. TTF natural gas, the benchmark for European energy costs, sits at approximately 46 EUR/MWh. During the 2022 crisis, TTF exceeded 300 EUR/MWh, a level that forced widespread industrial shutdowns across Germany and Southern Europe.
The current oil shock is severe in percentage terms, but it has not breached the operational thresholds that caused the 2022 derating. European manufacturers are absorbing higher input costs rather than halting production lines, and that difference explains why the valuation floor has held roughly 4 points above the 10.4x trough.
When big ASX news breaks, our subscribers know first
The oil price transmission mechanism most investors misunderstand
Rising oil prices damage European equity valuations not through earnings deterioration but through multiple compression. The distinction carries significant implications for how investors should monitor risk.
Goldman Sachs estimates that each 1% rise in oil prices reduces European equity valuations by approximately 20 basis points, and the reduction flows entirely through the multiple rather than through reported profits. In practical terms, a 10% rise in crude removes approximately 200 basis points from the forward P/E, independent of what happens to quarterly earnings.
The Goldman Sachs oil-to-equity valuation framework, as reported by Investing.com, states explicitly that each 1% rise in oil prices removes approximately 20 basis points from European equity valuations entirely through multiple compression rather than earnings deterioration, a distinction that shapes how the current shock should be monitored.
The transmission follows a specific sequence:
- Oil prices rise, increasing perceived macroeconomic uncertainty.
- Investors revise their discount rate assumptions upward to reflect elevated risk.
- The equity risk premium expands as compensation for holding risk assets.
- The forward P/E compresses, even if underlying earnings estimates remain unchanged.
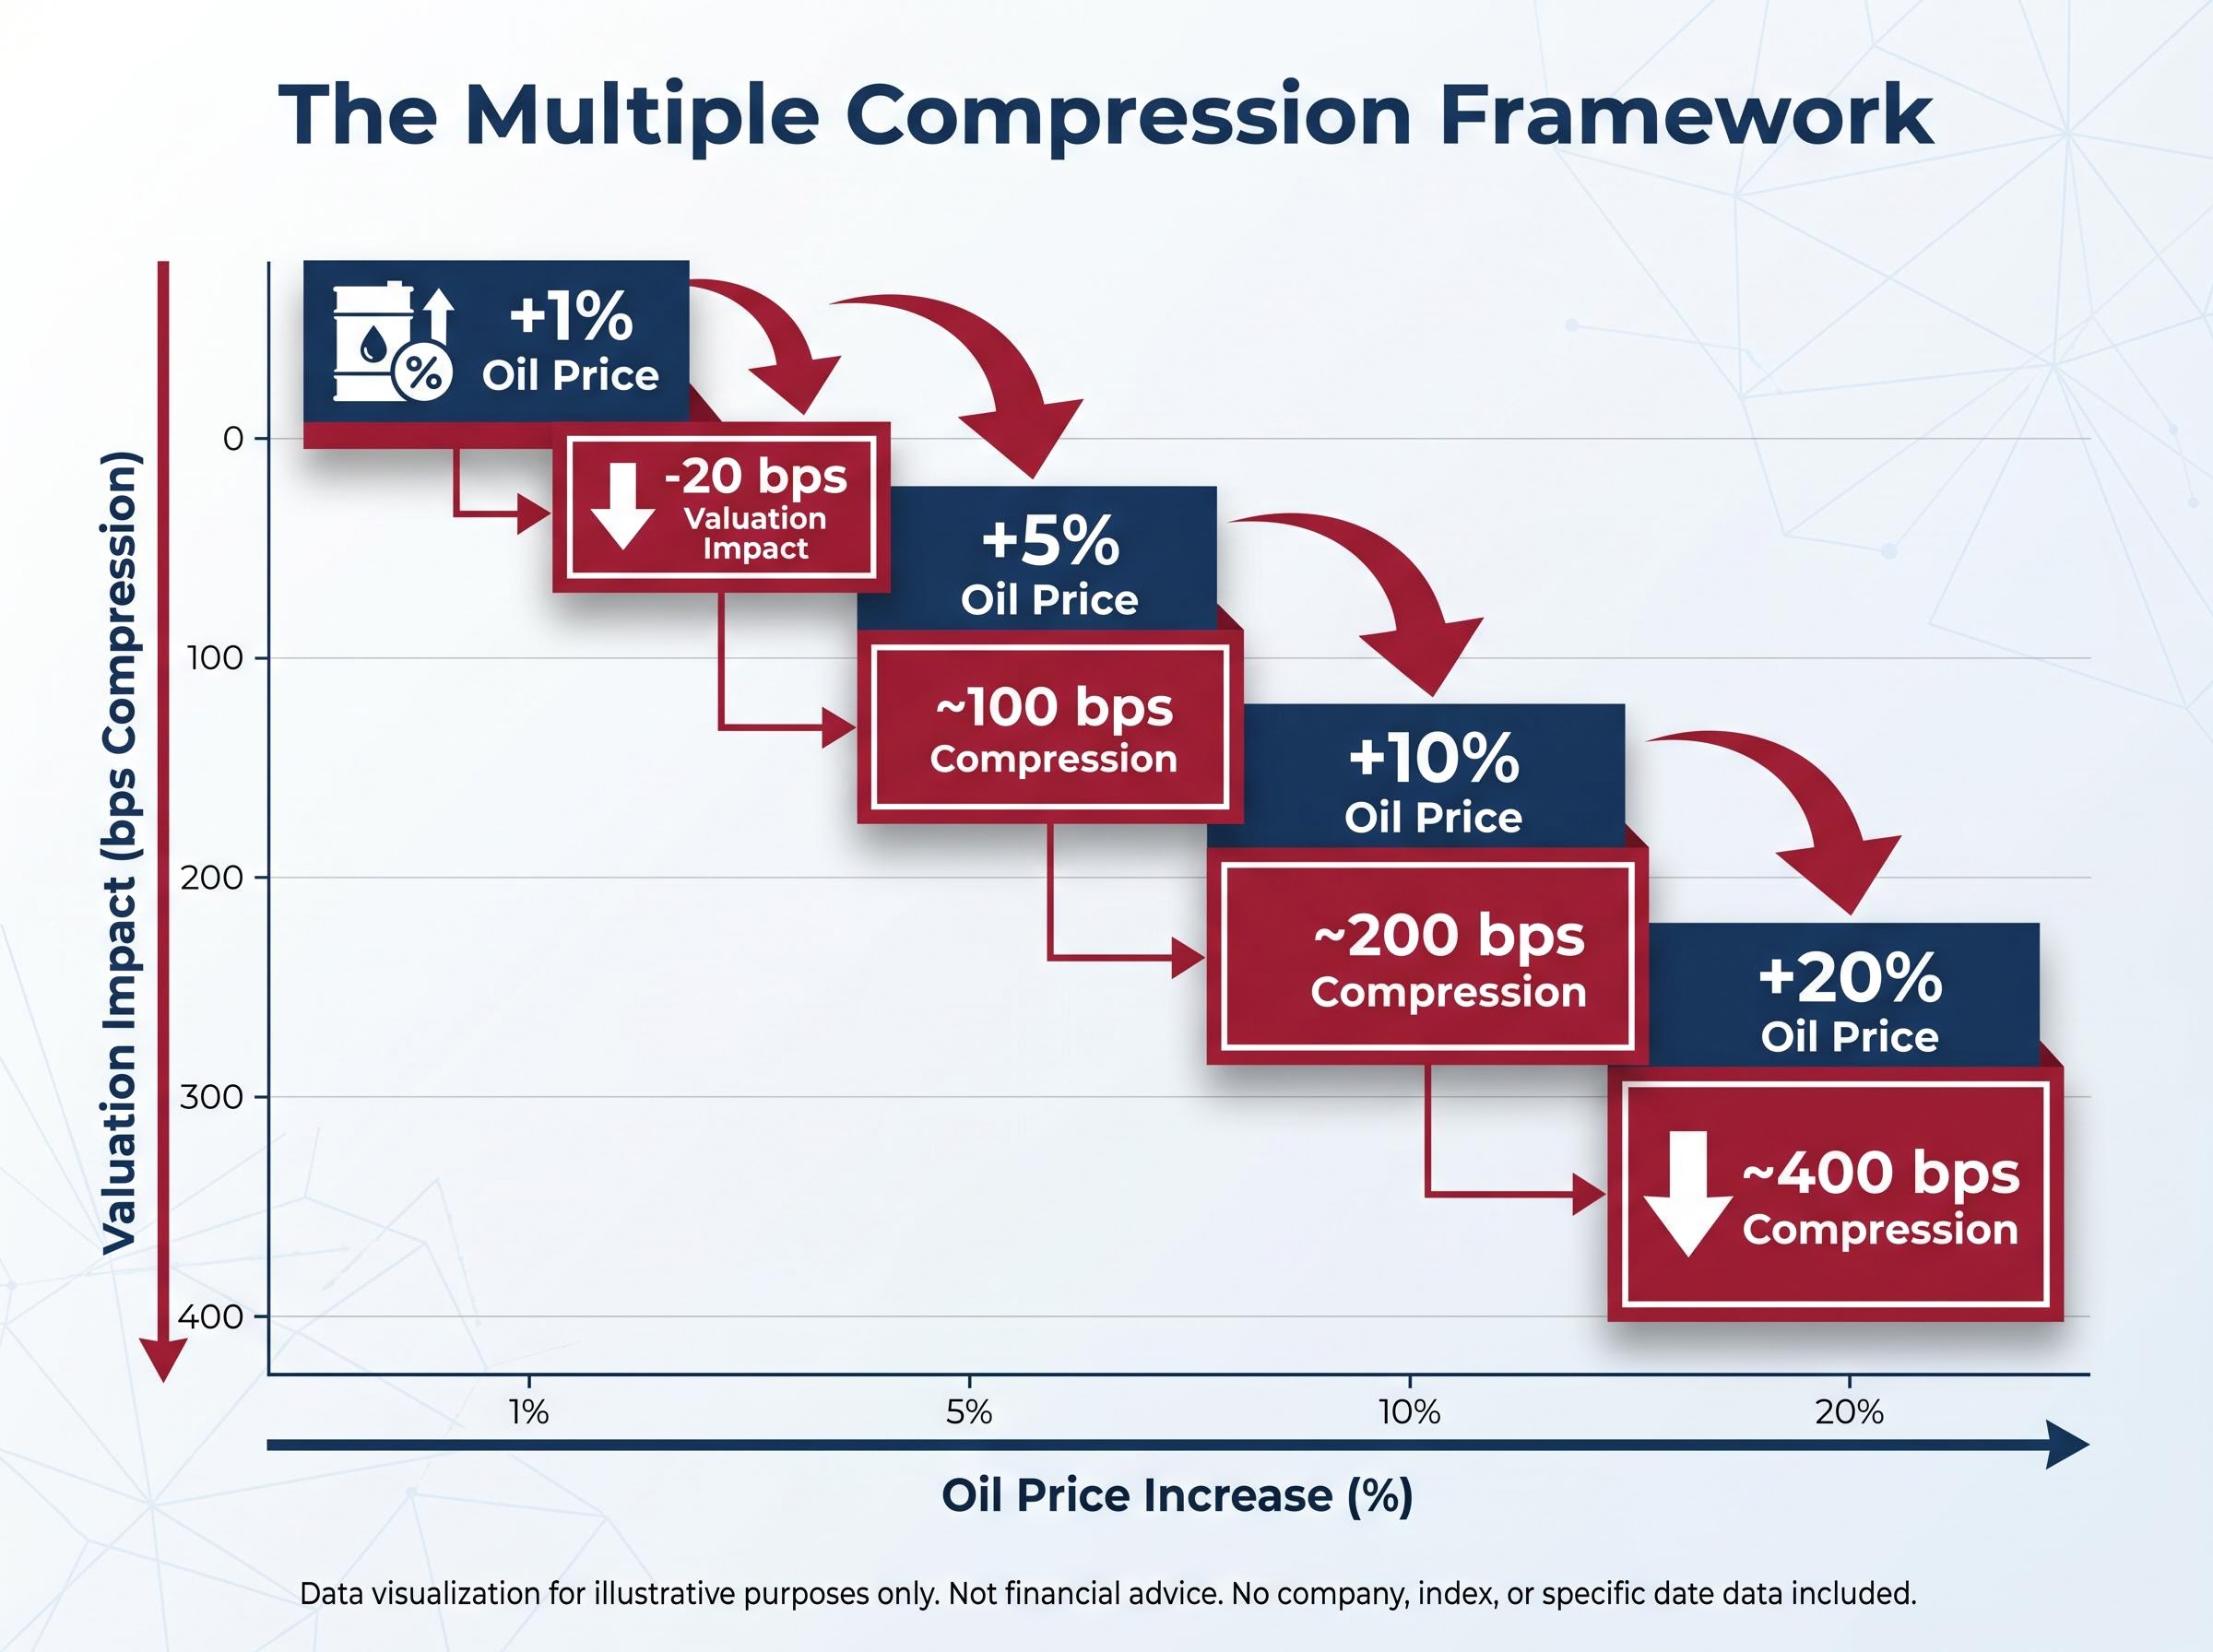
This means the P/E ratio is the primary variable to watch during an oil-driven geopolitical shock, not quarterly earnings beats or misses. Brent crude at approximately $113 per barrel, up 82% year over year, has already applied meaningful pressure through this channel, yet European equities remain roughly flat on the year and only 4% below pre-conflict levels.
The following table illustrates the estimated valuation impact at different oil price movements, based on the Goldman Sachs framework:
| Oil Price Change | Estimated Valuation Impact (basis points) |
|---|---|
| +5% | ~100 bps compression |
| +10% | ~200 bps compression |
| +20% | ~400 bps compression |
What “multiple compression” means in practice
The forward P/E ratio represents the price investors pay today for each unit of expected earnings over the next 12 months. At 14.4x, the market is paying $14.40 for every $1 of forecast earnings across the STOXX Europe 600.
When macro uncertainty rises, investors demand a higher return for holding equities. That higher required return means they pay less per unit of earnings, even if those earnings do not change. The multiple compresses without any deterioration in the underlying business.
A concrete example clarifies the mechanism. If a stock trades at 15x expected earnings and the multiple compresses to 13x with earnings unchanged, the share price falls by roughly 13%. No profit warning is required. No revenue miss triggers the decline. Investor sentiment alone reprices the stock.
The contrast matters for portfolio monitoring:
- Earnings deterioration: revenue declines, margins compress, forward estimates are cut, and share prices follow the lower profit outlook.
- Multiple compression: revenue and margins may hold steady, but investors demand a larger discount for uncertainty, and prices fall before any earnings deterioration materialises.
The 2022 trough of 10.4x illustrates what severe compression looks like. The current 14.4x sits between that trough and normalised levels, reflecting a market that has absorbed some oil-driven risk premium expansion but not the full dislocation of a direct energy supply crisis.
The sector rotation that has quietly reshaped European portfolios
The shift from quality and asset-light businesses toward capital-intensive sectors did not begin with the February 2026 conflict. It has been running since January 2025.
Goldman Sachs’s capital-intensive basket, which captures infrastructure, energy, and industrial names, outperformed broader European equities by approximately 3% from late February 2026 through early May 2026. Over the longer window, the same basket has appreciated approximately 36% since January 2025.
A 36% cumulative gain in capital-intensive names since January 2025 represents a structural regime, not a short-term tactical trade. Investors who rotate back to quality prematurely may be misreading the durability of real-asset demand in an elevated geopolitical risk environment.
GRANOLAS (the cluster of large-cap European quality names spanning healthcare, technology, and consumer staples) and quality strategies ranked among the weakest 2026 performers year to date. The fundamental basis of this divergence is visible in earnings revision data: sectors such as Travel and Leisure, Automobiles, and Luxury recorded the sharpest estimate cuts following the conflict, while Banks, Technology, and Utilities maintained the most stable forward earnings profiles.
| Sector | Earnings Revision (Post-Conflict) | YTD Performance | Goldman Sachs Stance |
|---|---|---|---|
| Energy | Upgraded | Positive | Beneficiary of commodity tailwind |
| Industrials | Stable to upgraded | Positive | Capital-intensive overweight |
| Banks | Stable | Positive | Overweight |
| Technology | Stable | Mixed | Overweight |
| Utilities | Stable | Positive | Defensive positioning |
| Travel and Leisure | Sharp downward cut | Negative | Underperformer |
| Automobiles | Sharp downward cut | Negative | Underperformer |
| Luxury | Sharp downward cut | Negative | Underperformer |
The earnings story hiding beneath the index level
Goldman Sachs revised its 2026 STOXX Europe 600 earnings growth estimate upward to 10%, doubling the prior 5% forecast. The headline number suggests broad corporate health. The composition tells a different story.
The upgrade is driven almost entirely by commodity sector revisions and a reduced foreign exchange headwind. Ex-commodity margins are expected to remain approximately flat in 2026, a sharp divergence from consensus expectations for a 100-basis-point improvement. The non-commodity earnings picture, in other words, has not improved.
The bifurcation runs across three layers:
- Headline growth: 10% earnings growth for the full STOXX Europe 600 in 2026, up from a prior 5% estimate.
- Commodity contribution: Energy and commodity-linked sectors account for the bulk of the upward revision, supported by Brent crude at $113 per barrel.
- Non-commodity reality: Ex-commodity margins are expected to be approximately unchanged, falling well short of consensus expectations for margin expansion.
The 2027 reversal risk
Goldman Sachs expects energy earnings to decline in 2027, which means the current commodity-driven upgrade carries a built-in expiry date. Investors holding multi-year positions face a specific challenge: the earnings tailwind supporting the 10% growth figure is not projected to persist beyond the current cycle.
Even a full Strait reopening would not immediately resolve the energy shock: the supply chain normalisation timeline for global oil markets, according to Minneapolis Fed estimates, runs to approximately six months after transit resumes, a lag that keeps the commodity earnings tailwind alive well beyond any ceasefire announcement.
Goldman Sachs’s 12-month STOXX Europe 600 price target of 625 implies approximately 5% total return from current levels, a figure that already incorporates the expectation of fading commodity support. A headline earnings upgrade built on commodity tailwinds that are expected to reverse is a materially different investment proposition than a broad-based earnings recovery.
Stagflation risk and where Goldman Sachs sees the smart money now
Goldman Sachs does not treat stagflation as its central case. It has, however, explicitly incorporated the scenario into its European equities guidance, representing a meaningful departure from the optimistic cyclical-rally thesis that underpinned its January 2026 outlook.
The macro data supports the shift in tone. Eurozone GDP grew just +0.1% in Q1 2026, near stagnation. Headline inflation sits at approximately 2.6% with upside risk from energy costs. The manufacturing Purchasing Managers’ Index (PMI) for April 2026 came in at 52.2, still in expansion territory but decelerating.
The oil price recession transmission follows four simultaneous channels: compressed consumer disposable income, rising business input costs, Federal Reserve rate pressure, and a pullback in investment and hiring; European equities are absorbing the first two directly while the third plays out primarily through ECB guidance rather than actual rate moves.
Median real quarterly STOXX 600 returns in stagflationary environments have historically been approximately -1%, compared with approximately +3% in normal periods. That 4-percentage-point gap defines the range within which European equity positioning decisions are playing out now.
Where Goldman Sachs is positioned
The Strait of Hormuz remains the key variable. A sustained blockade or escalation that restricts crude flows through the strait would shift stagflation from a scenario to the base case, with materially different implications for equity multiples.
Goldman Sachs currently overweights three sectors, each chosen for resilience in either a stagflationary or elevated geopolitical risk environment:
- Banks: benefit from wider net interest margins in a higher-rate, higher-inflation backdrop, and their earnings revisions have been among the most stable post-conflict.
- Technology: maintains pricing power and margin resilience through the cycle, with lower direct energy cost exposure than industrials.
- Defence: captures structural spending increases driven by European rearmament commitments that are accelerating under geopolitical pressure.
Q1 2026 ETF and open-end fund inflows into European equities reached EUR 184.2 billion, according to Morningstar data. That level of structural buying has provided a technical support floor beneath valuations even as the macro picture has deteriorated.
The Morningstar Europe Open End and ETF Flows report for Q1 2026 recorded net inflows of EUR 184.2 billion into European funds during the quarter, a figure that provides independent verification of the structural buying trend that has supported valuations through the drawdown.
The valuation floor is not guaranteed, but the architecture has changed
The question is no longer why European equity valuations have held. The question is what would have to be true for them to collapse from here.
Several structural factors have supported the 14.4x forward P/E: lighter investor positioning entering the conflict, the commodity-driven earnings upgrade, the significant severity gap versus the 2022 energy crisis, and EUR 184.2 billion in Q1 fund inflows providing persistent technical demand. Each of these supports has a specific failure condition.
A Strait of Hormuz blockade becoming the base case would reprice energy risk to a level closer to the 2022 experience. Non-commodity margin deterioration accelerating beyond current expectations would undercut the earnings upgrade narrative. An outflow reversal of the structural inflow trend would remove the technical bid that has absorbed selling pressure through the drawdown.
The Strait of Hormuz supply mechanics have grown considerably more complex than a simple naval blockade: US operations, Iranian toll enforcement on non-aligned vessels, and the near-total withdrawal of commercial war risk insurance have each independently restricted throughput, meaning a ceasefire announcement alone would not restore commercial transit flows.
Rather than arriving at a binary bullish or bearish conclusion, investors can monitor three variables for early signals of regime change:
- Strait of Hormuz operational status: the single largest determinant of whether the oil shock escalates from a managed disruption to a supply crisis.
- Ex-commodity earnings revisions: the leading indicator of whether the 10% headline growth figure is masking deterioration beneath the surface.
- Fund flow data: whether the EUR 184.2 billion Q1 inflow pace sustains or reverses in Q2 and Q3.
Goldman Sachs’s 12-month target of 625 implies modest upside from current levels. The 10.4x trough of 2022 remains the reference point for a full derating, but the conditions that produced it, TTF gas above 300 EUR/MWh and widespread industrial shutdowns, are not present today. The architecture supporting current valuations has changed from the pre-conflict structure, and whether it holds depends on a narrow set of observable conditions rather than broad macro sentiment.
This article is for informational purposes only and should not be considered financial advice. Investors should conduct their own research and consult with financial professionals before making investment decisions. Past performance does not guarantee future results. Financial projections are subject to market conditions and various risk factors.