Think about why the same economic headline, say a US inflation print landing 0.1% below forecast, can move a currency pair by 80 pips inside five minutes. If currencies were driven by vague “market sentiment,” that kind of precision and speed would not exist. Something mechanical is at work, and it is learnable.
By daily volume, EUR/USD sits at the top of the global forex market, responsible for close to 30% of all currency transactions that take place each day. Every participant in global markets, from institutional asset managers to individual investors holding international equities, carries some exposure to the forces that drive it. Yet most explanations of what moves the pair stay at the surface level, listing factors without explaining how they connect.
This piece gives you a clear, mechanical understanding of what actually drives EUR/USD over weeks and months, using real central bank policy cycles and specific data releases as the worked examples. The framework is not complicated, but it is specific, and specificity is what separates a usable mental model from a list of buzzwords.
Why EUR/USD is the benchmark currency pair
The scale of EUR/USD trading is not just a market trivia fact. It shapes how the pair behaves. Used across 20 EU member states, the Euro ranks as the second most widely traded currency globally, behind only the US Dollar. 2022 data showed it represented 31% of all foreign exchange transactions worldwide, with turnover averaging more than $2.2 trillion each day.
The dollar’s global dominance extends well beyond EUR/USD: the currency appears on one side of 89.2% of all forex transactions daily despite the US accounting for only roughly 10% of world trade, a structural asymmetry that amplifies every Fed policy signal across every currency pair simultaneously.
To put that dominance in context, here is how EUR/USD compares to the next largest euro crosses:
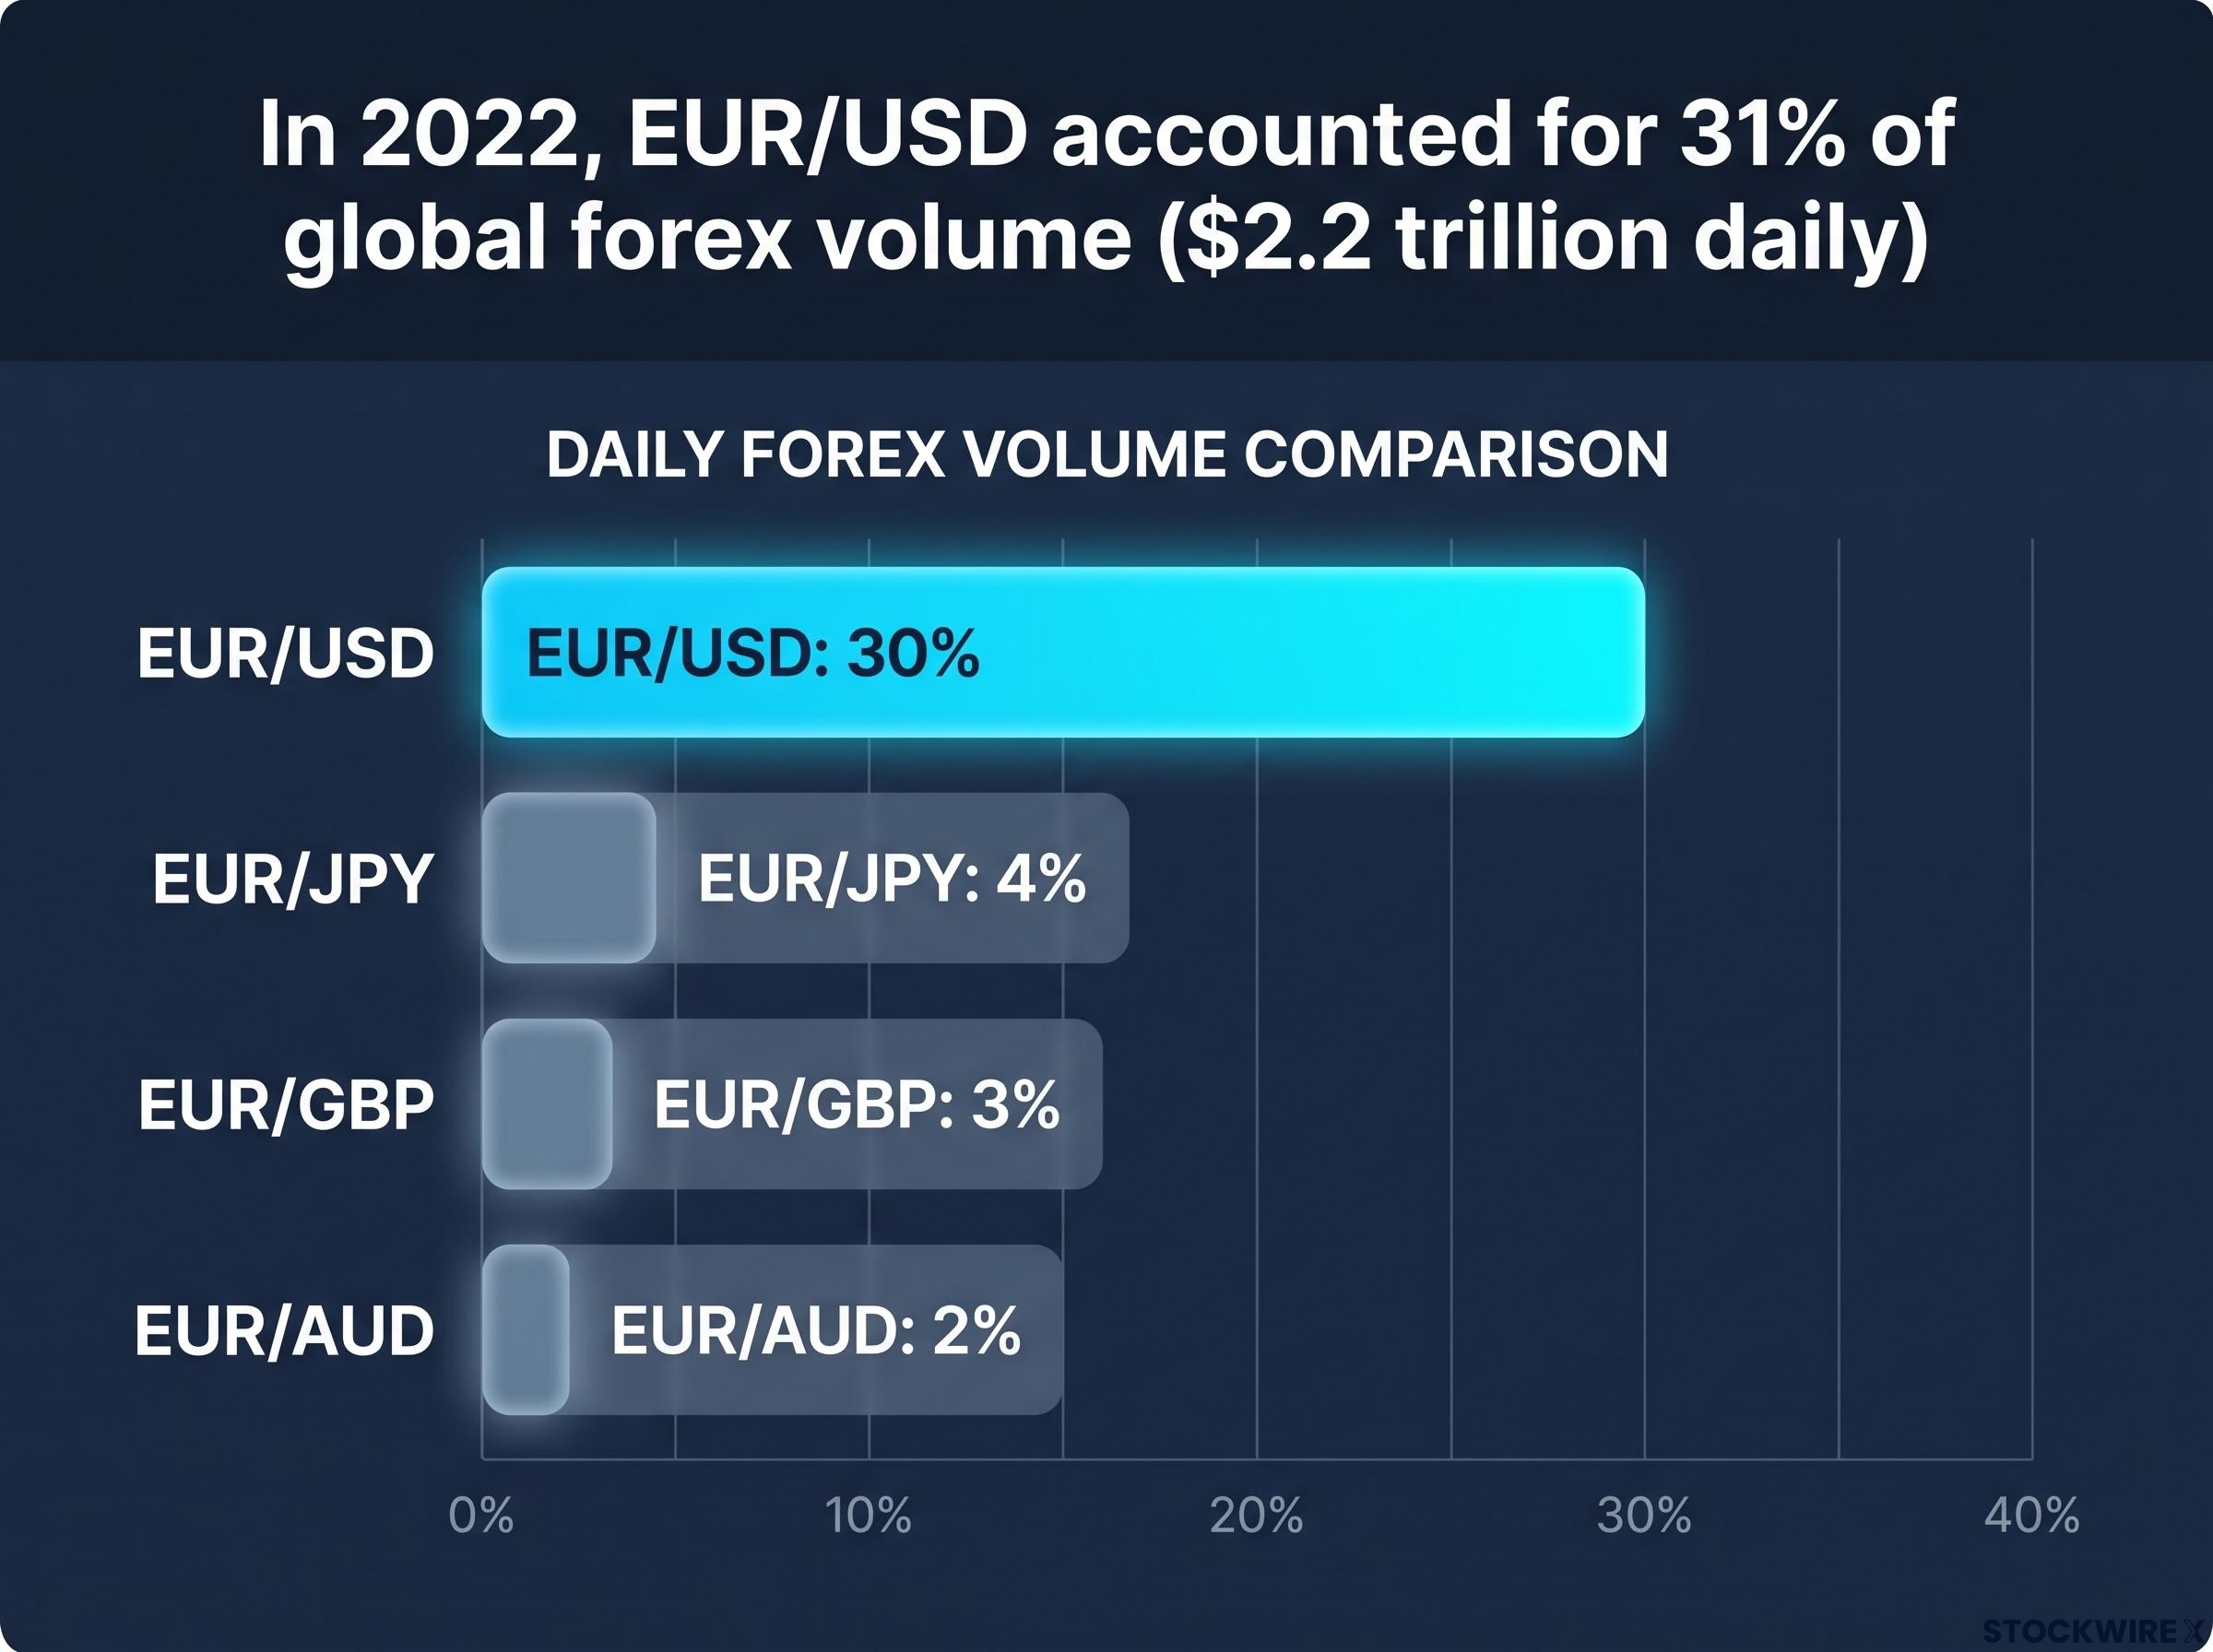
- EUR/USD: roughly 30% of total daily forex volume
- EUR/JPY: roughly 4%
- EUR/GBP: roughly 3%
- EUR/AUD: roughly 2%
EUR/USD is not just the most popular pair. It is structurally different from smaller crosses in one critical respect: liquidity.
What liquidity means for how information gets priced
When a currency pair is this liquid, macro information gets absorbed fast. Central bank expectations are usually priced in before the formal decision arrives, not at the moment it is announced. By the time a major ECB or Fed meeting takes place, the headline rate decision is almost always already in the price. The real opportunity, and the real risk, sits in the surprise: the unexpected data point, the shift in tone, the off-calendar speech that catches markets leaning the wrong way.
That is the mechanic that governs everything else in this article.
When big ASX news breaks, our subscribers know first
The one force that explains most EUR/USD moves over time
Start with a simple question. If you are a global fund manager choosing between a euro-denominated bond and a US dollar-denominated bond, what is the first thing you check? The yield.
When US interest rates are expected to stay well above Eurozone rates, capital tends to flow toward dollar assets. EUR/USD generally trades lower. When the gap narrows, because the ECB stays tighter or the Fed is expected to cut sooner, euro assets look relatively more attractive, and EUR/USD tends to rise. This is the interest rate differential, and over multi-month horizons it is the single most powerful fundamental driver of the pair.
Interest rate differentials also govern the yen carry trade: with the BoJ at 1% and the Fed holding at 3.50-3.75%, a spread of approximately 2.5-2.75% makes yen-funded dollar positions structurally attractive, illustrating how the same differential mechanic that drives EUR/USD operates across every major currency pair.
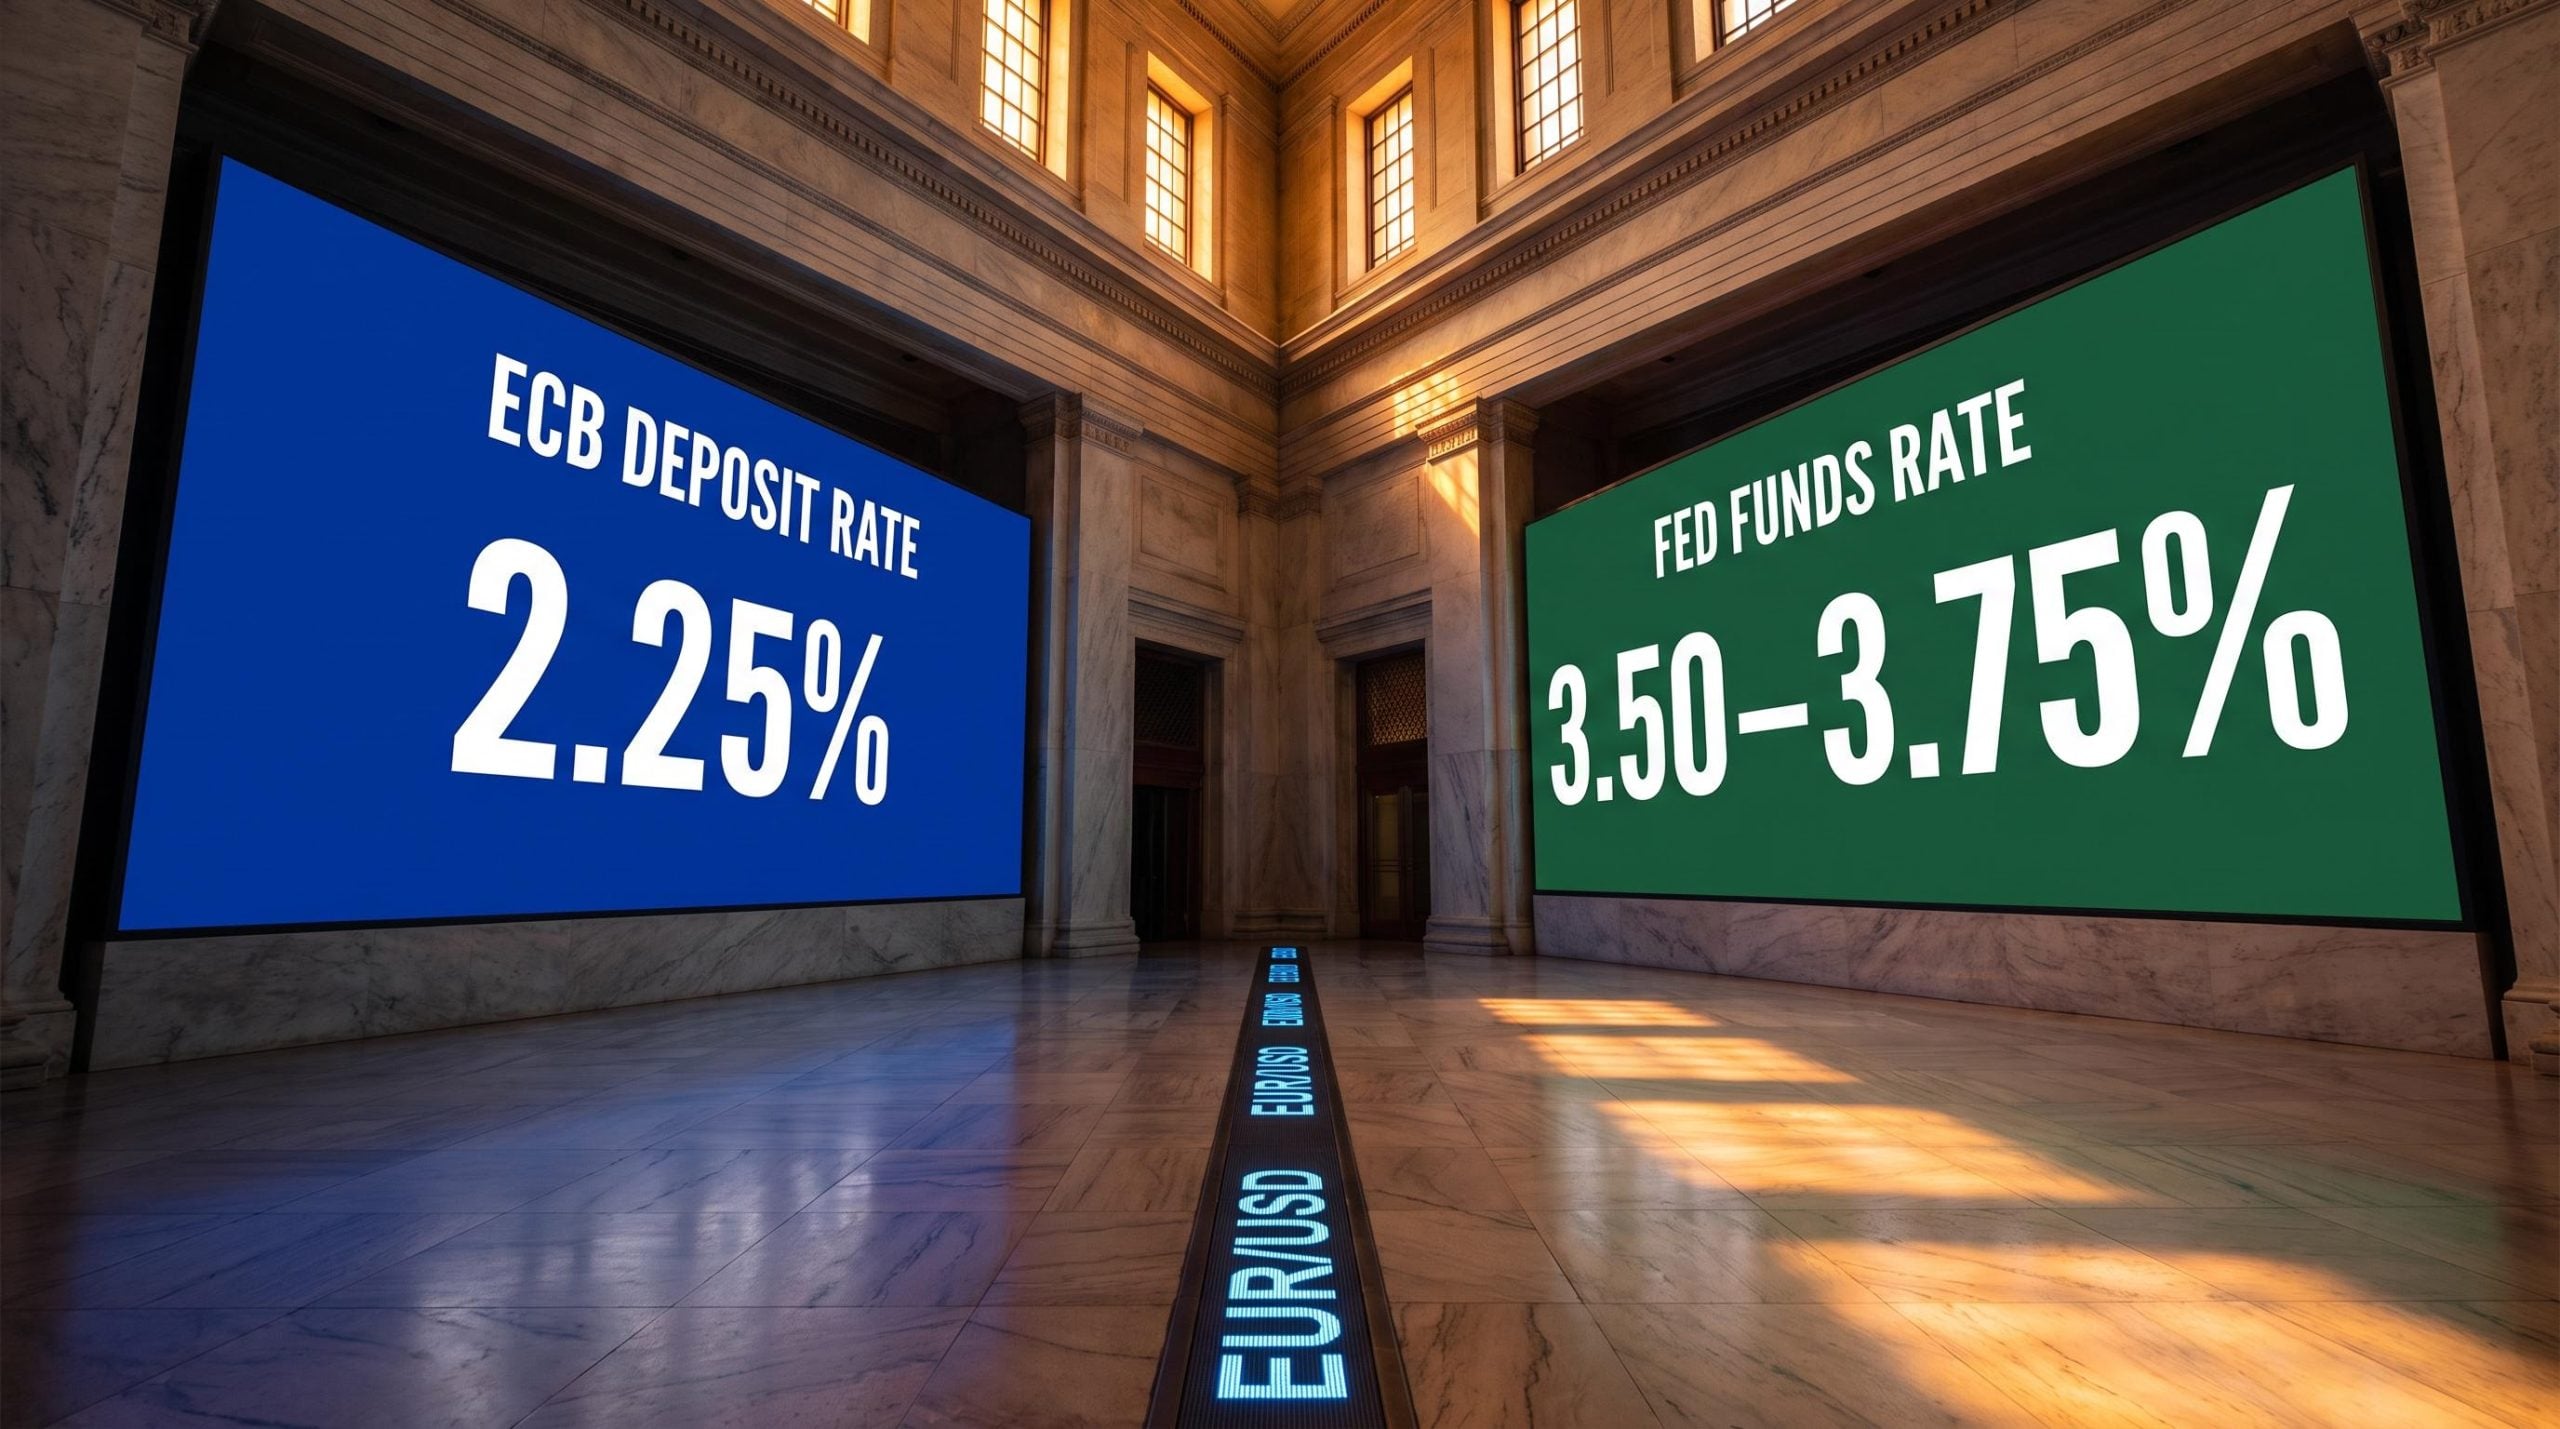
The recent policy cycles show the scale of the moves involved. The Fed raised the federal funds rate by a cumulative 5.25 percentage points to a peak of 5.25-5.50% from early 2022, and has since cut to a target range of 3.50-3.75%. The ECB raised rates by a cumulative 4.50 percentage points from -0.50% to a peak of 4.00% by September 2023, then cut eight times through 2025 to 2.00%, before raising again to 2.25% in June 2026.
| Central bank | Rate cycle peak | Current level |
|---|---|---|
| Federal Reserve | 5.25-5.50% | 3.50-3.75% |
| ECB | 4.00% | 2.25% |
Here is the part that matters most. Markets trade expectations of the future differential, not just today’s official rates. A softer-than-expected US inflation print that reduces Fed hike odds often triggers immediate EUR/USD gains, because traders mark down the expected US yield path. The formal rate decision, if it was already priced in, changes nothing about expectations.
EUR/USD is essentially a bet on where the ECB and Fed are expected to set rates over the coming quarters, not where they have set them today.
For you, that means a single inflation data point can legitimately move EUR/USD more than a formal rate decision. Data reshapes the expected future path. A priced-in decision does not.
How the ECB’s inflation mandate shapes euro valuations
Price stability is the ECB’s founding objective, with 2% inflation over the medium term set as the definition of that target. That single-mandate structure makes the ECB’s reaction function simpler to track than the Fed’s (which carries a dual mandate, covered in the next section). When Eurozone inflation is above target and rising, the ECB has one primary tool, interest rates, and one primary objective. Its likely response is more predictable than a central bank juggling two goals.
The ECB’s primary inflation gauge is the Harmonised Index of Consumer Prices (HICP), a standardised measure of consumer price changes across the Eurozone. Both headline and core HICP (which strips out volatile food and energy prices) function as direct inputs to market expectations about ECB policy.
July’s final Eurozone HICP confirmed a month-on-month gain of 0.2%, matching the preliminary figure without revision. Core HICP held at 2.5% on a year-over-year basis. Persistent upward pressure from energy costs across the Eurozone has kept expectations for ECB tightening alive; the bank lifted rates by 25 basis points to 2.25% in June 2026, and a further increase in September is broadly anticipated by markets.
The ECB Governing Council convenes eight times each year to set monetary policy, with Christine Lagarde holding the position of ECB President. But you do not need to wait for meetings. HICP data, released monthly, functions as a live signal.
Here is how an HICP surprise feeds through to the pair:
- HICP prints above consensus expectations
- Markets reprice the ECB rate path higher (expecting more tightening)
- Eurozone yield expectations rise relative to US yields
- EUR/USD moves higher as capital flow expectations shift toward euro-denominated assets
When HICP surprises to the downside, the sequence reverses: markets anticipate earlier or deeper ECB cuts, euro yields fall relative to US yields, and EUR/USD typically weakens.
Why German data carries outsized weight
The four biggest Eurozone economies, Germany, France, Italy, and Spain, together make up close to three-quarters of the bloc’s total output. But Germany carries a special role. As the largest Eurozone economy, German PMIs (purchasing managers’ indices, monthly surveys of business activity) and German inflation readings often arrive before the aggregate Eurozone figures. Experienced traders watch them as leading signals for where HICP and ECB policy may be heading. Softer German numbers can tilt expectations toward a more dovish ECB stance and weaken the euro before the official Eurozone data even arrives.
How the Fed’s dual mandate creates a more complex EUR/USD signal
The Federal Reserve operates under a dual mandate: maximum employment and price stability. That second objective, employment, is the complication. Unlike the ECB, the Fed must weigh labour market conditions alongside inflation when setting rates. A strong jobs report and a soft inflation print can point in opposite directions, and frequently do.
The Fed’s dual mandate of maximum employment and price stability, as defined by Congress and administered through the FOMC, requires policymakers to weigh labour market conditions alongside inflation when calibrating rates, a structural complexity that has no equivalent in the ECB’s single-objective framework.
For you, that means tracking the USD leg of EUR/USD requires holding two variables simultaneously. You cannot read the Fed’s likely path from inflation data alone.
The specific data releases that most reliably reshape Fed expectations, and therefore move EUR/USD, are:
- CPI and PCE (consumer and personal consumption inflation measures): softer readings reduce Fed hike expectations and tend to lift EUR/USD
- Non-Farm Payrolls (NFP) and unemployment rate: strong jobs data reinforce higher-for-longer Fed expectations and can support the dollar
- Wage growth: rising wages feed inflation expectations and complicate the inflation picture
- US GDP and PMIs: broader activity gauges that shape the growth side of the dual mandate
- FOMC decisions and projections: the headline decision plus updated rate projections (the “dot plot”)
- FOMC minutes: released three weeks after each meeting, often revealing a more hawkish or dovish internal debate than the press conference suggested
- Fed-speak: off-calendar speeches and interviews by Fed officials that routinely move EUR/USD when they signal a shift in thinking ahead of formal meetings
The FOMC meets eight times a year. But the rate decision itself is usually priced in well before the announcement. The surprise tends to sit in the tone of forward guidance, the press conference language, and subsequent minutes. A run of disappointing US economic releases over recent weeks led investors to dial back their expectations for a Fed hike, with attention now focused on the FOMC minutes for clearer direction on where policy is heading.
Markets react to surprises in expected rate paths, not to headline decisions that are already priced in. The data release that changes the forward outlook is the one that moves the pair.
A single strong jobs report can complicate or even contradict what a soft inflation print seemed to signal. That ambiguity is the dual mandate at work, and it is why the Fed side of EUR/USD analysis demands more inputs than the ECB side.
What happens when the ECB and Fed move in opposite directions
EUR/USD trends are most powerful when the two central banks are expected to move in opposite directions, or at meaningfully different speeds. The framework is not about which bank has higher rates in absolute terms. It is about the direction and speed of expected divergence.
Two recent cycles illustrate this clearly.
| Period | Fed stance | ECB stance | EUR/USD direction |
|---|---|---|---|
| 2022-2023 | Hiked aggressively to 5.25-5.50%, moved earlier | Hiked to 4.00%, started later and peaked lower | Lower (USD dominance) |
| Mid-2026 | Holding at 3.50-3.75% | Raised to 2.25%, further hikes expected | Higher (euro supported by tightening expectations) |
In 2022-2023, the Fed moved higher earlier and more aggressively, opening a wide US-over-Eurozone rate differential. That was a period of pronounced USD strength. EUR/USD traded lower as capital flowed toward the higher-yielding dollar.
By mid-2026, the picture has reversed. Renewed energy-driven inflation prompted the ECB to raise rates while the Fed held its lower range steady. The ECB is the bank expected to tighten further from here, and that shift in relative expectations is supporting the euro.
The currency that the market expects to tighten further from the current point is the one that tends to attract capital. It is the direction of divergence, not the absolute level of either rate, that drives the trend.
When trade balances complicate the picture
Trade balances exert a slower but meaningful influence. When a region exports more than it imports, the resulting net inflow of foreign currency creates ongoing structural demand for the domestic currency. The Eurozone has historically run a trade surplus, creating steady organic demand for euros.
But when energy prices spike, the Eurozone’s import bill rises sharply. Trade surpluses can shrink or even flip into deficit, undermining that structural euro demand even when ECB policy is relatively tight. This is a complicating variable rather than the primary driver, but it explains periods when EUR/USD moves in a different direction from what simple rate differentials would suggest. Factor it in; do not overweight it.
Structural headwinds suppressing the euro can override positive data entirely: in August 2026, European natural gas prices above EUR 60 per megawatt-hour and persistent Gulf geopolitical tensions were discounting Eurozone data surprises before they could move EUR/USD, a real-world demonstration of the complicating variables this framework must account for.
Building your EUR/USD monitoring framework
Everything covered so far condenses into a repeatable three-step process you can apply to any calendar event or data release:
- Map the expected rate path for each central bank. Where do markets think the ECB and Fed are heading over the next two to four quarters?
- Compare the paths. Which bank is expected to be more hawkish, and for how long? Is the gap widening or narrowing?
- Watch for data or speeches that challenge the consensus. Those are the events that tend to move EUR/USD the most, because they force a repricing of the expected differential.
The framework is not about predicting central bank decisions. It is about tracking what the market already expects, and then identifying what could break that expectation.
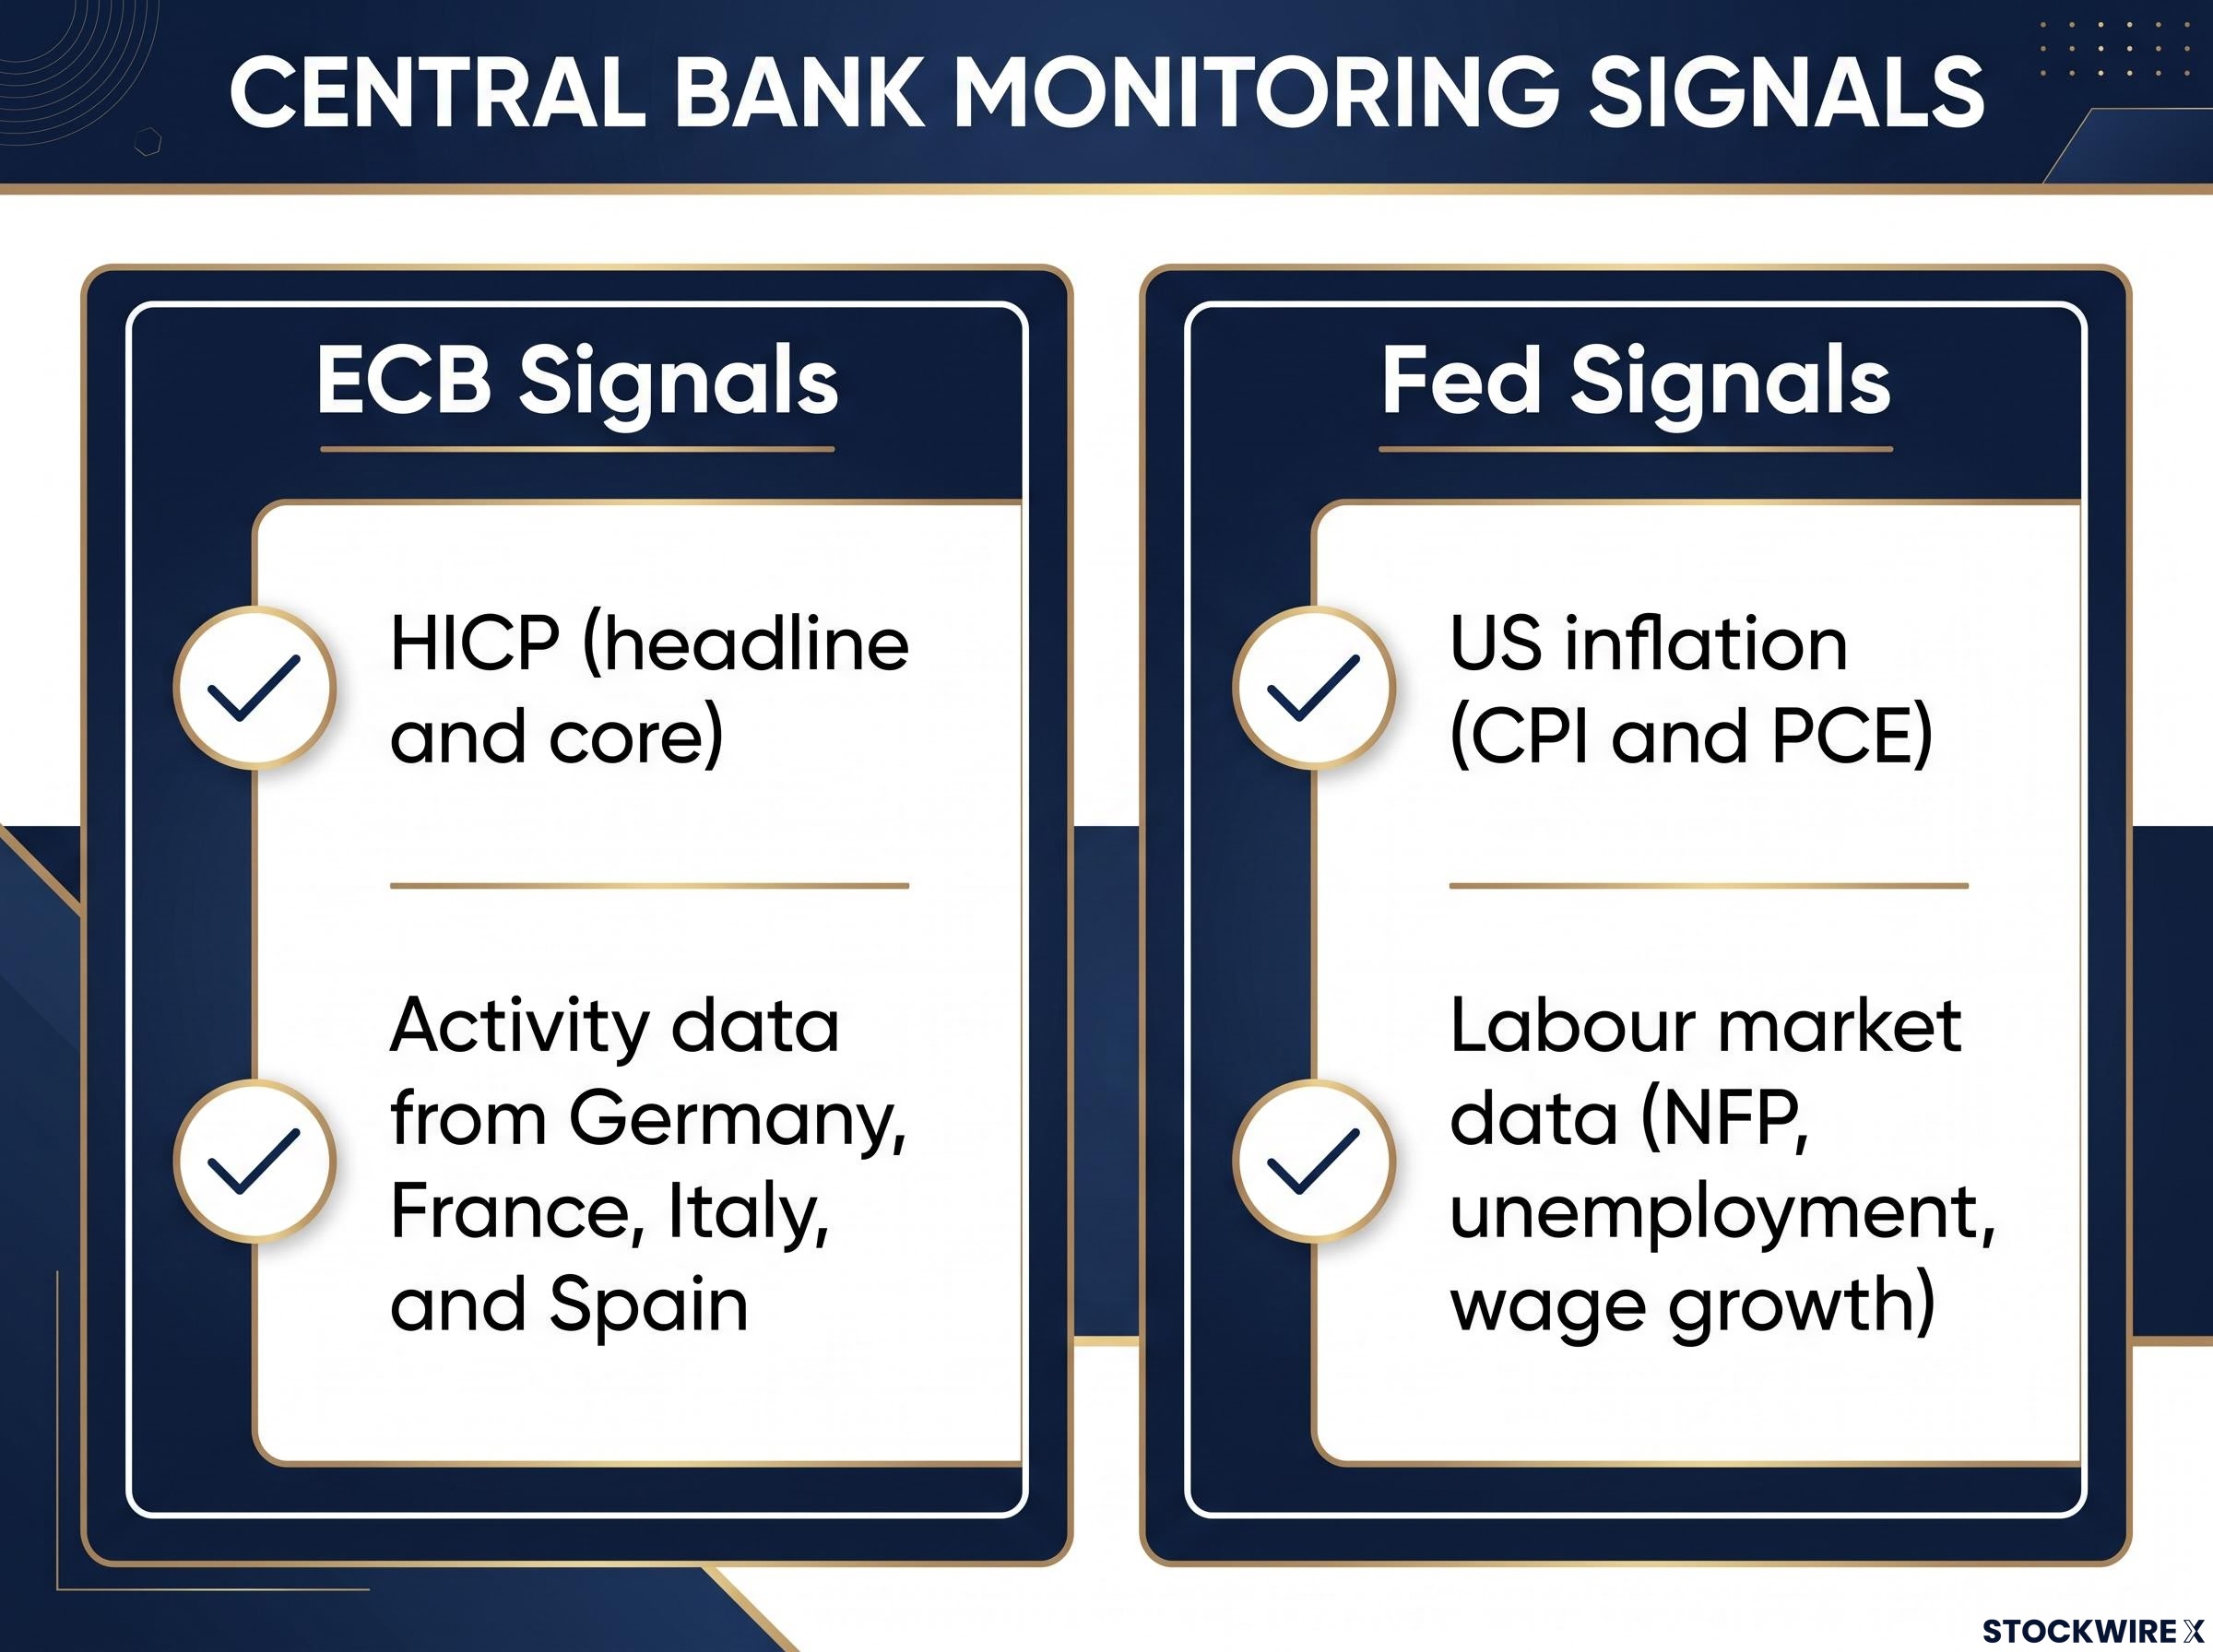
ECB-side signals to track
- HICP (headline and core): the ECB’s primary inflation input and the fastest-moving signal for rate expectations
- Activity data from Germany, France, Italy, and Spain: GDP, PMIs, and industrial production shape the growth outlook
- ECB rate decisions and press conferences: tone of inflation and growth assessments matters as much as the decision itself
- ECB Accounts (minutes): insight into internal debate and dissent among Governing Council members
- Eurozone trade balance and energy developments: structural flow signals that can reinforce or offset the rate differential
Fed-side signals to track
- US inflation (CPI and PCE): the most direct input to Fed rate path expectations
- Labour market data (NFP, unemployment rate, wage growth): the employment side of the dual mandate
- US GDP and PMIs: broader activity gauges that shape growth expectations
- FOMC decisions, projections, and press conferences: headline decision plus forward guidance signals
- FOMC minutes and Fed-speak: off-calendar speeches and interview comments that can shift expectations between meetings
Three misconceptions trip up new participants in this market:
- “The stronger economy’s currency always wins.” Not true. Relative policy matters more than absolute growth. A solid Eurozone can still see a weaker euro if the Fed is expected to run significantly higher real rates.
- “Rate hikes automatically push a currency higher.” Markets react to surprises. A fully priced-in hike accompanied by dovish forward guidance can weaken a currency, while a smaller-than-expected cut can strengthen it.
- “Only scheduled events matter.” Off-calendar speeches and interviews by ECB and Fed officials routinely move EUR/USD when they signal a shift ahead of formal meetings. The monitoring process is continuous, not calendar-bound.
What the rate differential tells you, and what it does not
EUR/USD is a continuous referendum on the relative attractiveness of euro- versus dollar-denominated assets. That attractiveness is anchored in where traders expect the ECB and Fed to set policy rates over the coming quarters. Surprise shifts in the perceived policy gap, not the headline decisions themselves, drive the most important moves in the pair.
EUR/USD moves most when the expected policy gap between the ECB and Fed shifts suddenly, not when a central bank delivers what was already priced in.
That framework explains the majority of EUR/USD’s medium-term behaviour. It does not explain every intraday tick. Over days and weeks, policy and macro data shape the trend. In shorter timeframes, positioning, liquidity, and options flows can dominate, causing moves that appear disconnected from fundamentals. Accept this boundary rather than forcing the framework to explain price action it was never designed to cover.
What you now hold is a primary filter for medium-term orientation: map relative rate expectations, compare them, and watch for what could break the consensus. Use it as your starting point for any EUR/USD view, and you will be working with the same mechanic that drives the world’s most liquid currency pair.
For investors wanting to see the three-step monitoring framework applied to a specific EUR/USD move in real time, our dedicated guide to EUR/USD live rate dynamics traces how a -0.6% retail sales miss drove Fed hike probability from 44% to 33.1% and what follow-on catalysts must resolve for the directional move to hold.
This article is for informational purposes only and should not be considered financial advice. Investors should conduct their own research and consult with financial professionals before making investment decisions.