A government inventory report landed this week expecting roughly one million barrels to quietly leave U.S. crude storage. The actual number was 7.2 million. That gap, not the headline figure itself, is the story worth understanding.
The week ending 24 July 2026 produced one of the more striking divergences between analyst consensus and physical market reality that the Energy Information Administration (EIA) has generated in recent years. Commercial crude stocks are now at their lowest point since 2018, Cushing is below operational comfort thresholds, and total crude including the Strategic Petroleum Reserve (SPR) has hit levels unseen since the 1980s. Each of those figures carries its own implication for energy prices, refining margins, and portfolio positioning.
Here is what the numbers are actually telling you, why the surprise component matters as much as the absolute level, what combination of factors drove the drawdown, and what anyone with energy exposure should be tracking in the weeks ahead.
What the EIA data actually showed this week
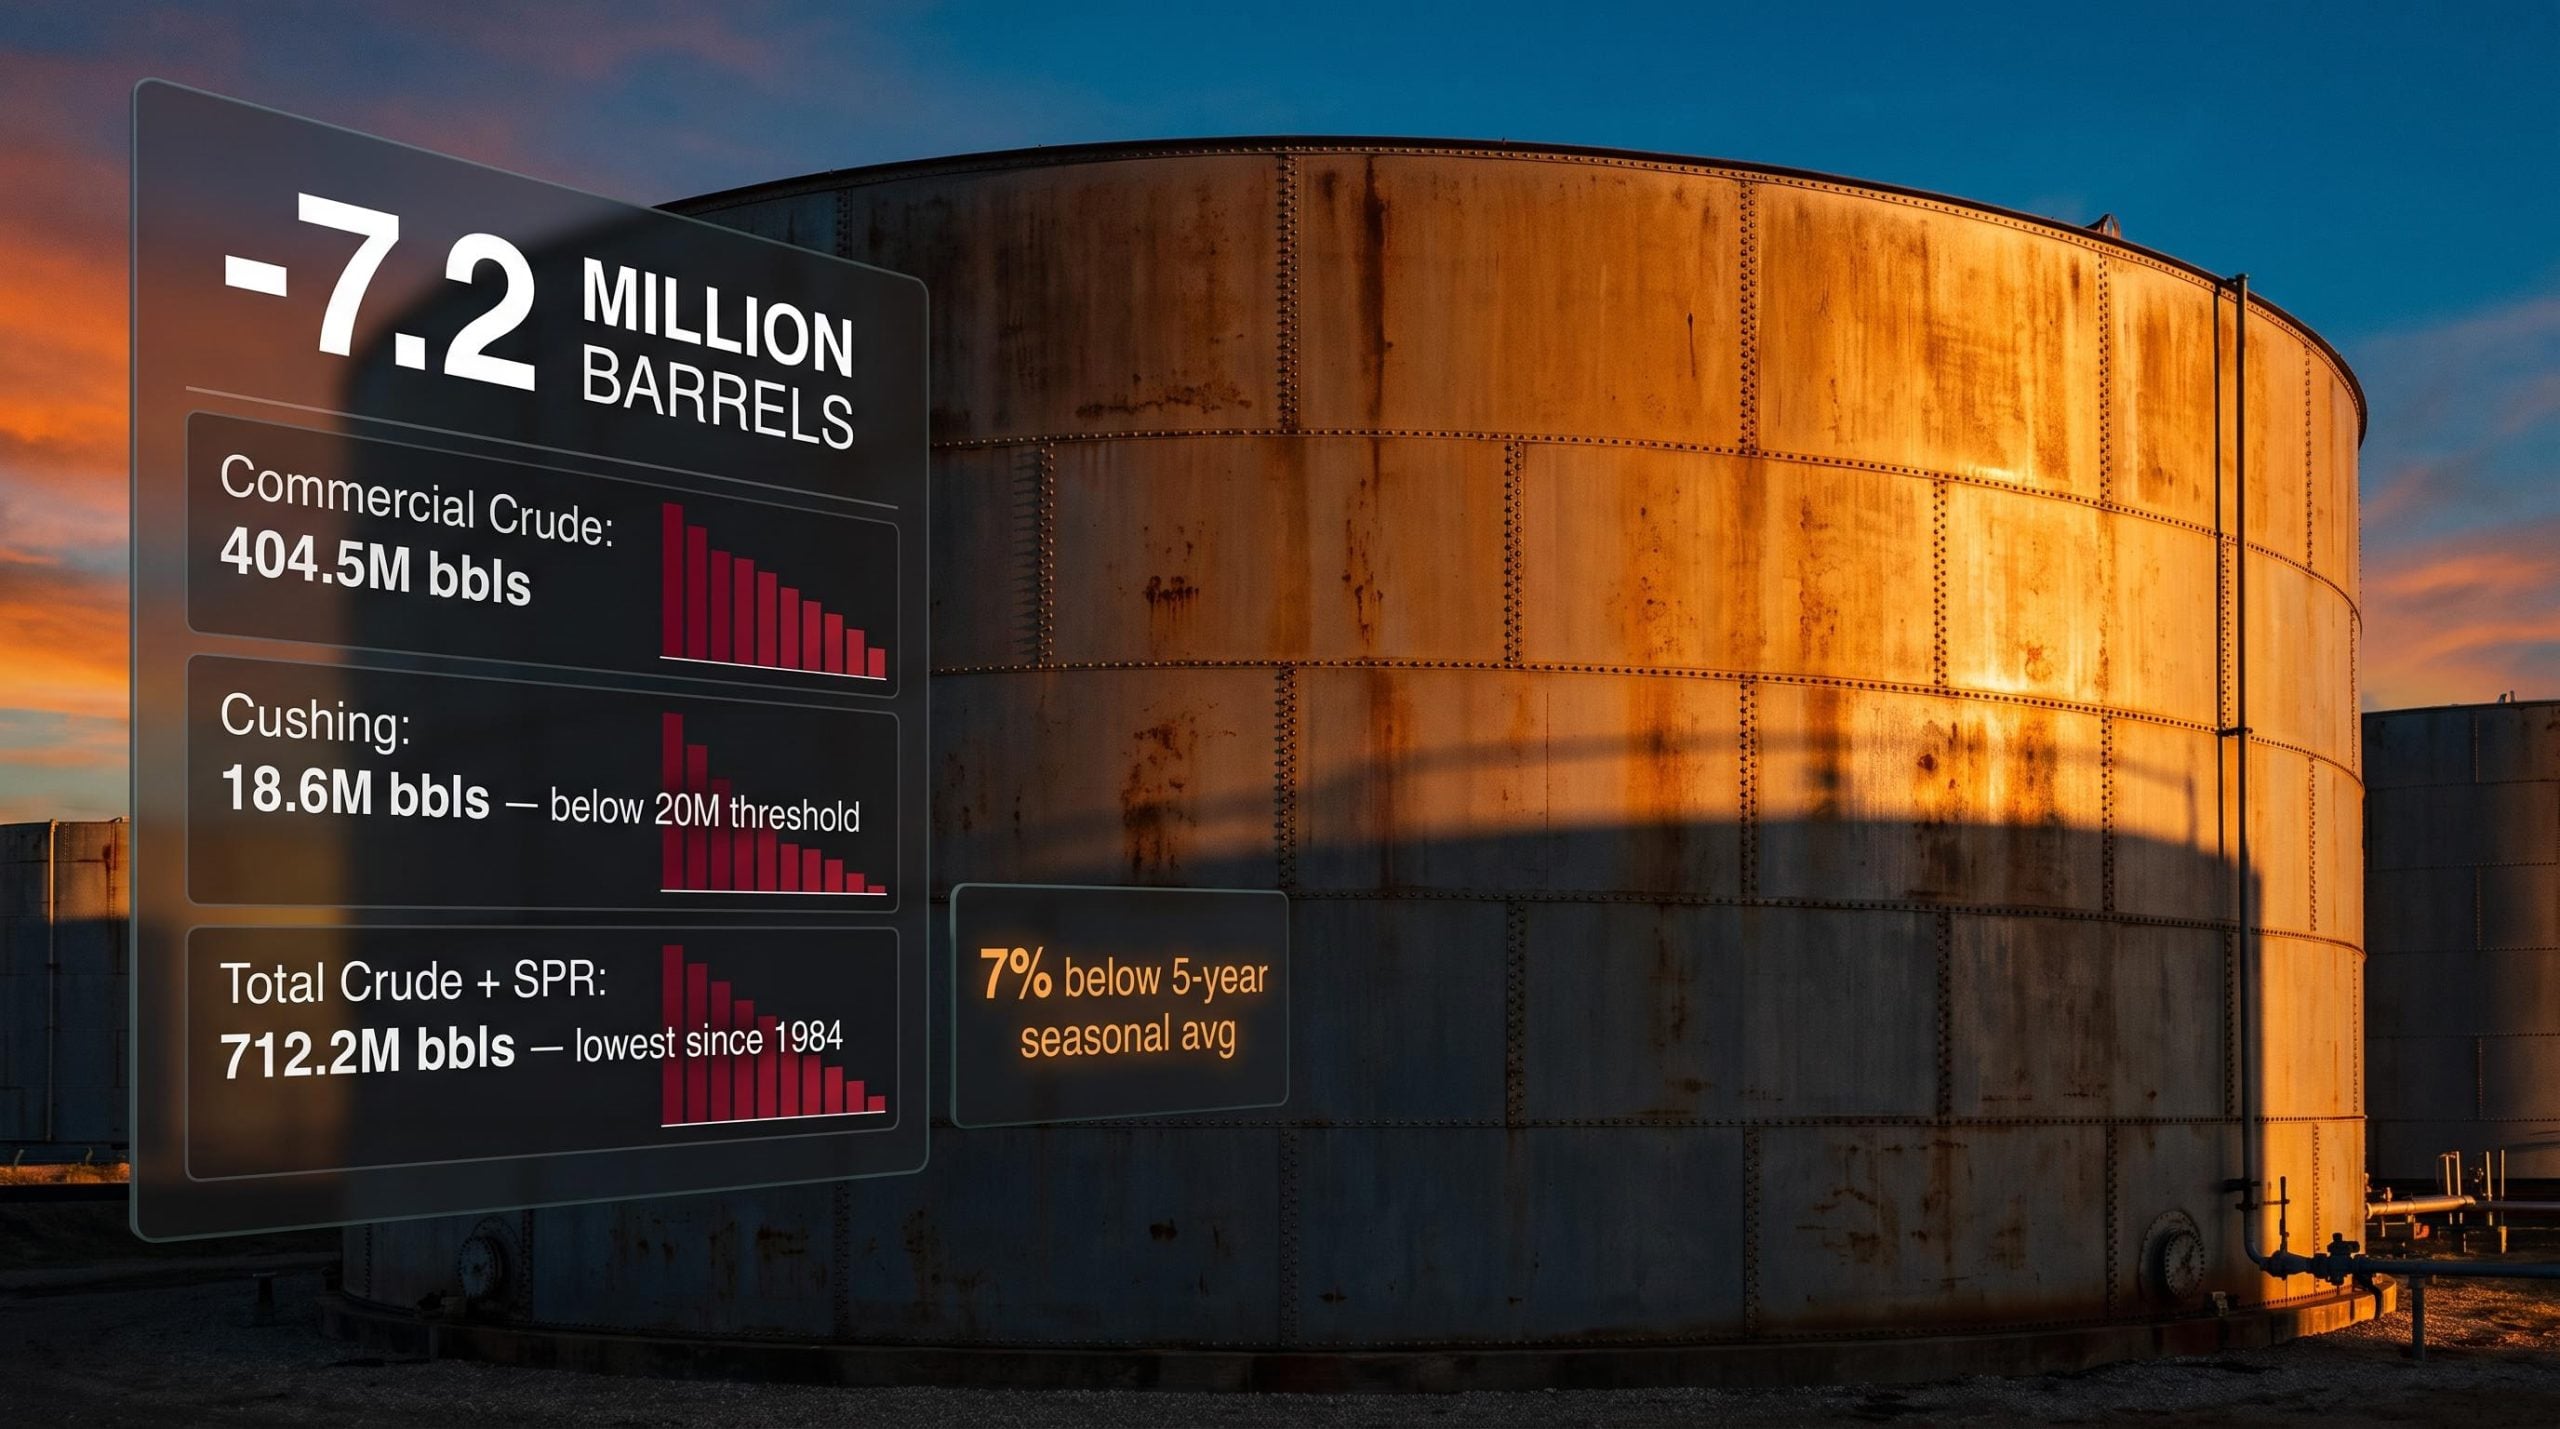
For the week ending 24 July 2026, the EIA reported that commercial crude stocks declined by 7.2 million barrels, settling at 404.5 million barrels. That reading marks a multi-year trough not seen since 2018 and leaves inventories running approximately 7% below the five-year (2021-2025) seasonal average for this point in the calendar.
Those numbers alone would be notable. The rest of the report made them harder to dismiss.
At the Cushing, Oklahoma delivery hub, the physical settlement point for West Texas Intermediate (WTI) futures, inventories dropped roughly 0.8 million barrels to 18.6 million barrels, the lowest reading since 2014. That figure sits below the approximately 20 million barrel operational threshold at which logistical constraints begin to affect WTI delivery mechanics. When Cushing gets this low, even routine pipeline maintenance or a scheduling delay can produce outsized price swings in the U.S. benchmark.
The full picture sharpens further when you include government reserves. Total U.S. crude stocks, commercial plus SPR, fell to 712.2 million barrels, the lowest level since 1984.
SPR buffer capacity has been under sustained pressure since early in the conflict cycle; global inventories were drawing at 8.5 million barrels per day in Q2 2026 according to IEA data, and emergency releases totalling approximately 280 million barrels failed to halt the drawdown, context that makes the current total-stocks reading of 712.2 million barrels considerably more consequential than a simple comparison to historical averages.
Key context points against the five-year seasonal average:
- Commercial crude stocks are running 7% below the seasonal norm for late July
- Cushing has breached the 20 million barrel threshold often cited as the floor for comfortable WTI operations
- Total crude plus SPR at 712.2 million barrels represents a four-decade low in combined buffer capacity
Product inventories told a less dramatic story. Gasoline volumes were little changed, finishing near 211 million barrels, while distillate fuel stocks covering diesel and heating oil posted a modest gain of around 1.1 million barrels.
| Category | Current Level | Weekly Change | Multi-Year Context |
|---|---|---|---|
| Commercial Crude | 404.5M barrels | -7.2M barrels | Lowest since 2018; 7% below 5-year avg |
| Cushing, Oklahoma | 18.6M barrels | -0.8M barrels | Lowest since 2014; below 20M threshold |
| Total Crude + SPR | 712.2M barrels | -11M barrels | Lowest since 1984 |
| Gasoline | ~211M barrels | Flat | Near seasonal norms |
| Distillates | Modest build | +1.1M barrels | One area of relief |
The combination of record-low total stocks and a Cushing level below operational thresholds tells you the U.S. system has materially less cushion against any near-term supply disruption than headline crude prices alone might suggest.
When big ASX news breaks, our subscribers know first
Why the forecast miss tells a different story than the inventory number alone
The headline draw was large. The surprise was enormous.
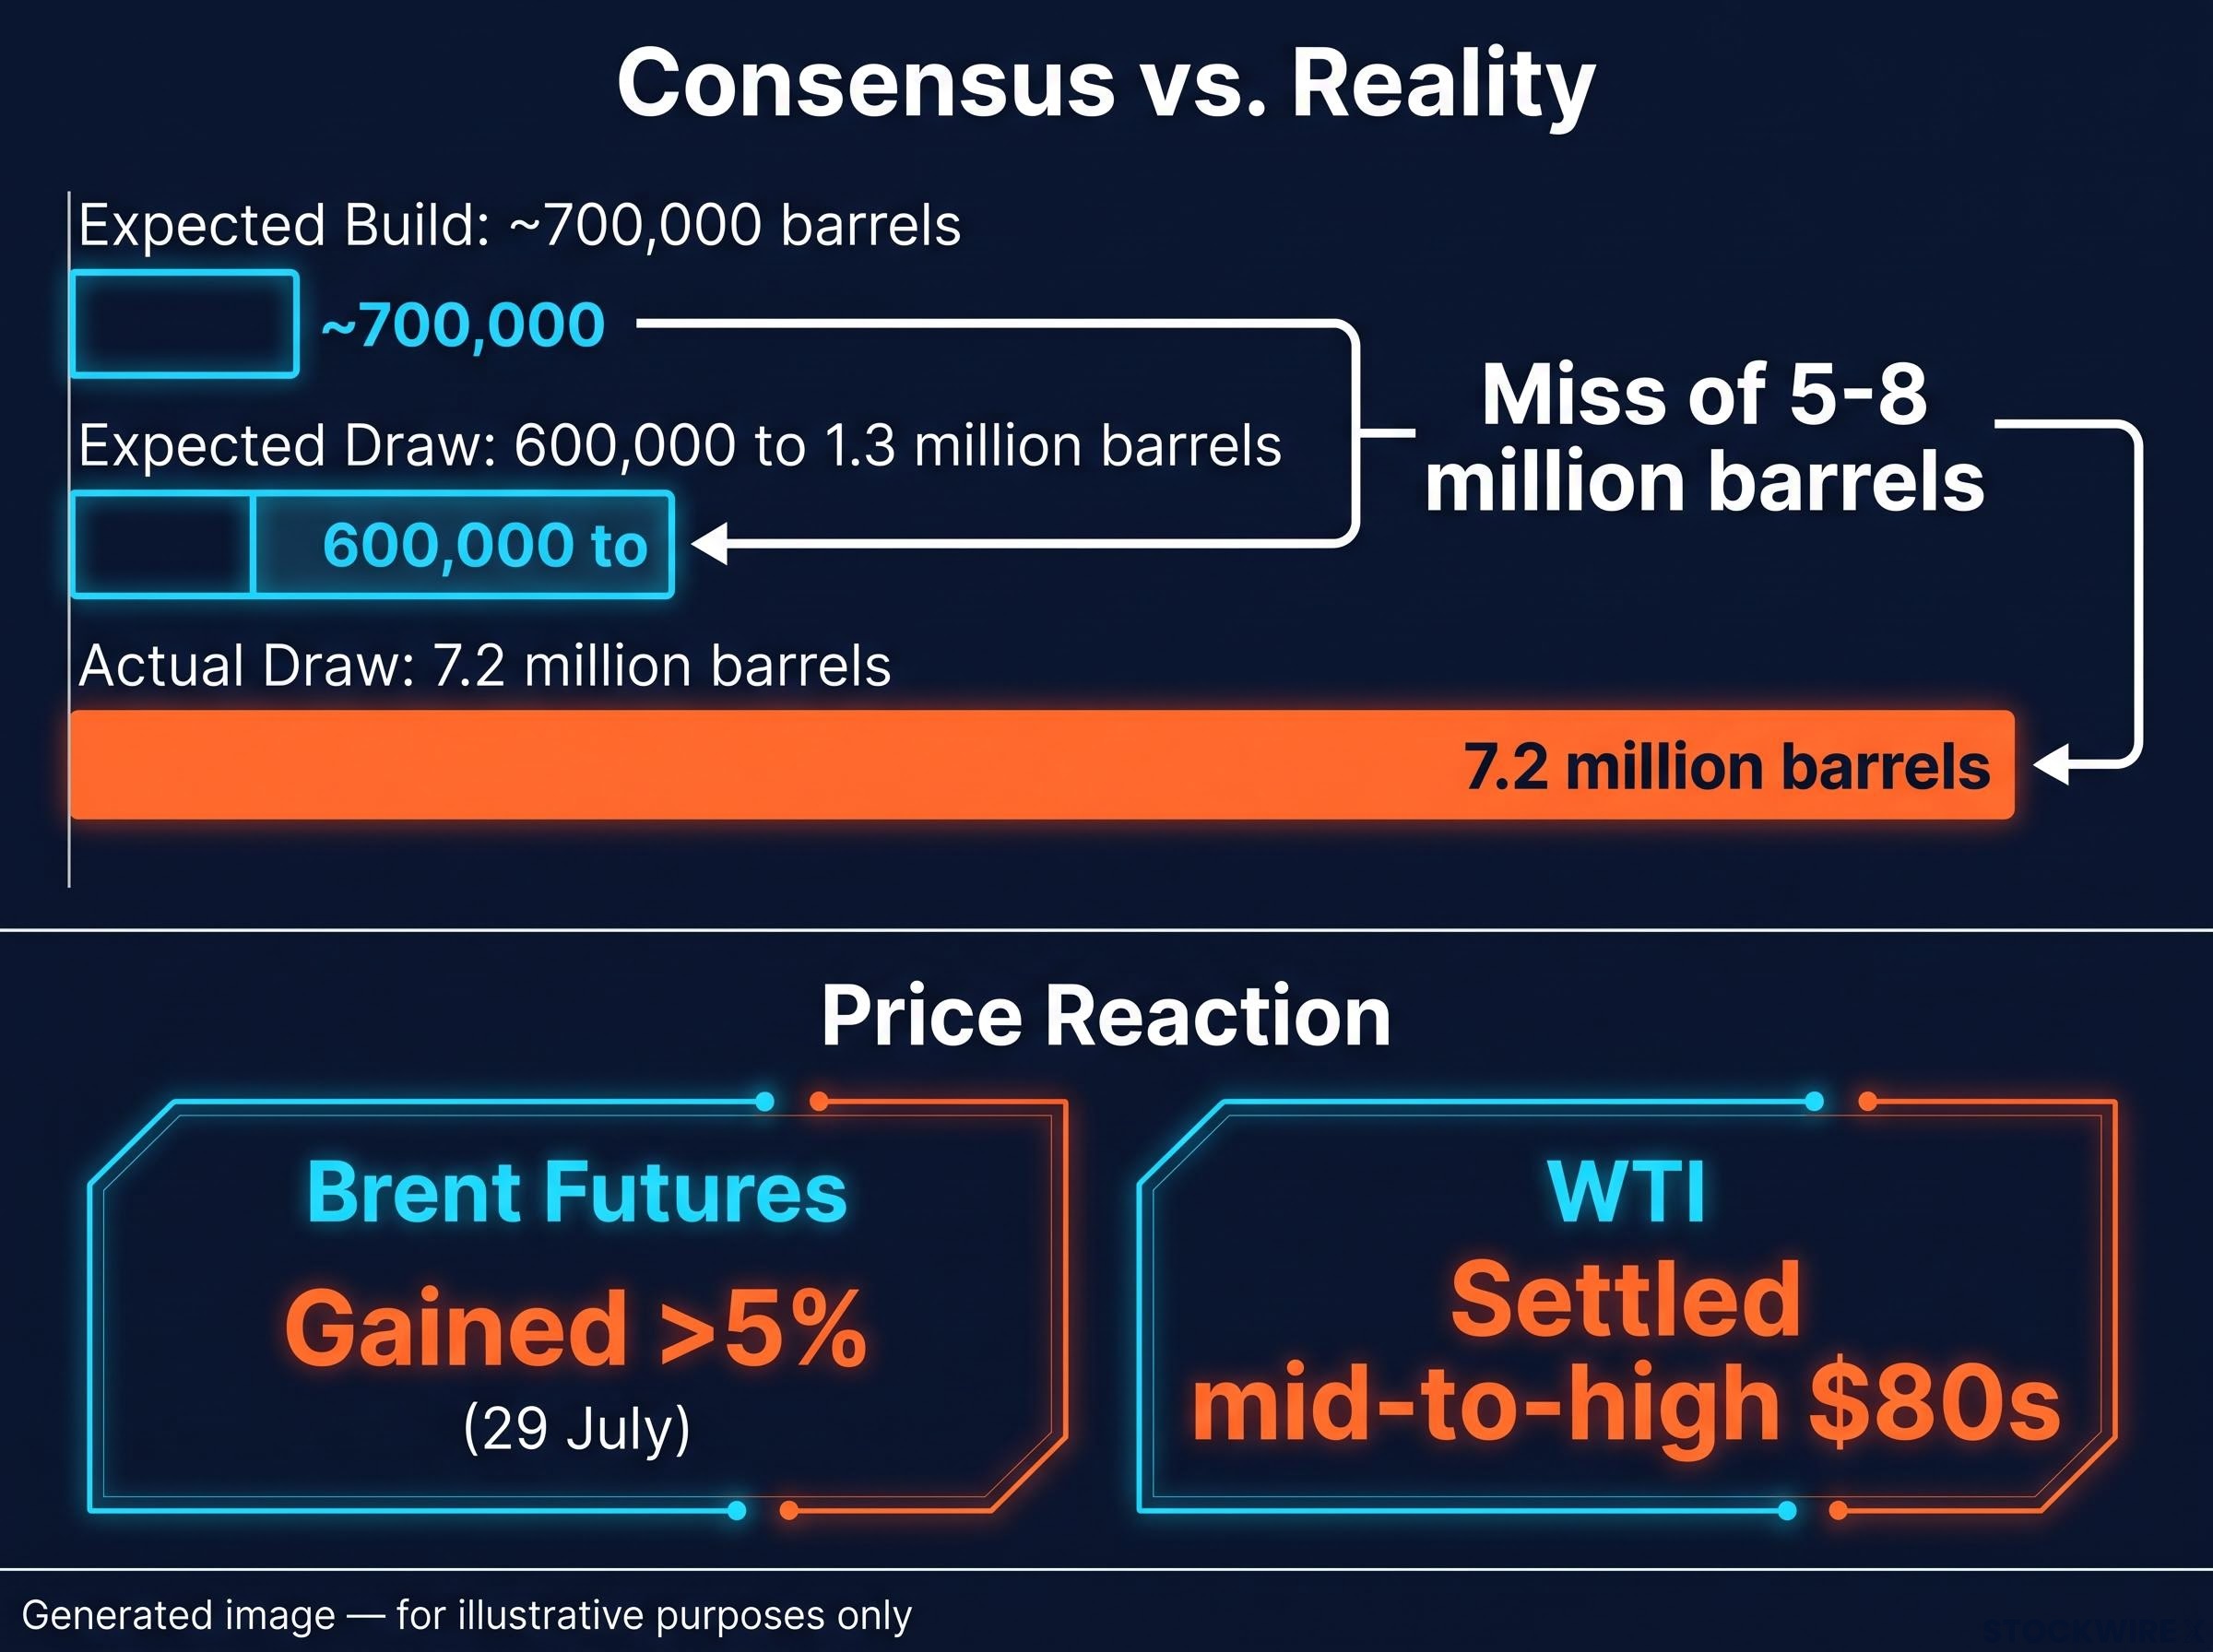
Consensus vs. reality: Analyst surveys ahead of this release pointed to a draw of roughly 600,000 to 1.3 million barrels (Reuters and Wall Street Journal polls). One version of the pre-release consensus, drawn from the original EIA source material, indicated analysts actually expected a small build of approximately 700,000 barrels. The actual result: a 7.2 million barrel draw, a miss of 5-8 million barrels depending on which benchmark you use.
Regardless of which directional characterisation of consensus proves most accurate, every reading confirms the same thing: professional forecast models were operating on assumptions about supply flows and demand that the physical market had already moved past.
The interpretive framework for reading oil inventory data extends beyond any single week’s headline number; the tradeable signal has consistently been the magnitude of the surprise relative to consensus, not the absolute barrel count, a distinction that separates analysts who predicted this week’s price reaction from those who did not.
That matters because of how futures markets work. Crude futures prices had already absorbed the consensus view before the EIA report dropped. A small draw would have produced a shrug. A 7.2 million barrel draw forced an immediate repricing. Traders who had positioned around a consensus-sized move had to adjust, covering short positions and adding long exposure, which is exactly why Brent futures gained more than 5% on 29 July and WTI settled in the mid-to-high $80s.
The implication for you is straightforward: if you only read the headline inventory figure without noting the forecast context, you miss the part of the report that most directly explains the price reaction. The surprise is the variable that creates the market move. The absolute level is background. The gap between expected and actual is the trigger.
What actually drove 7.2 million barrels out of storage in one week
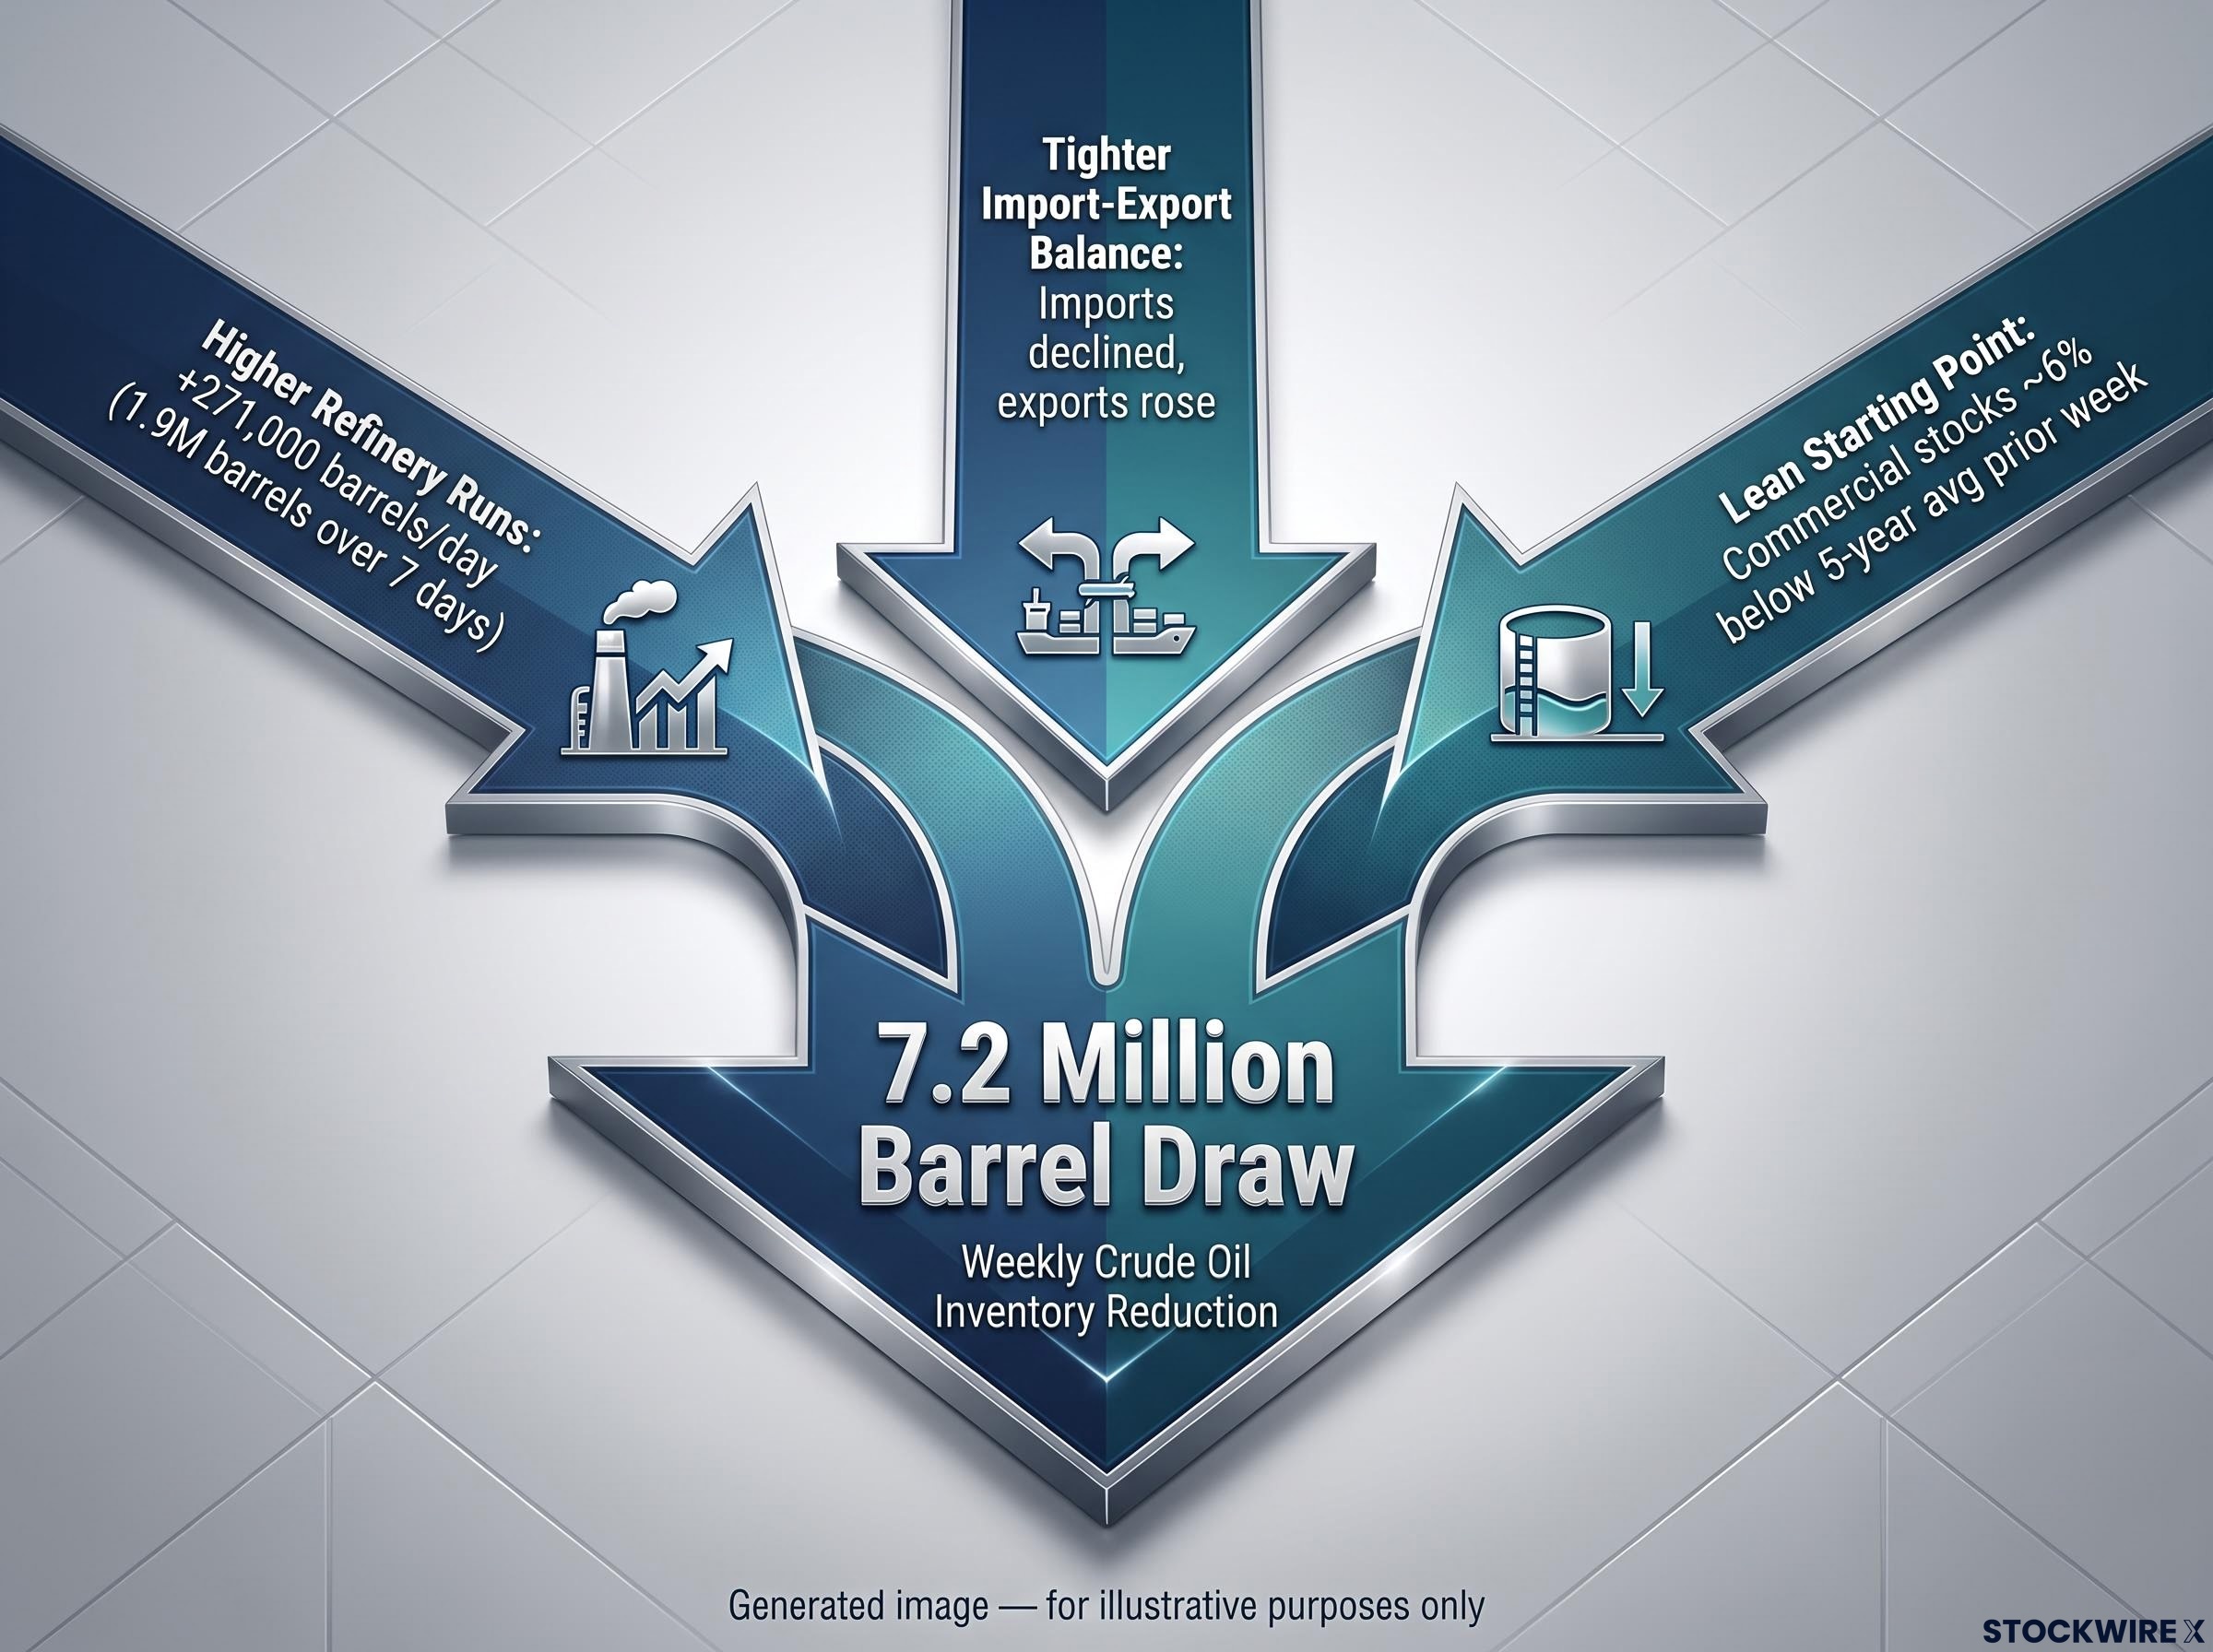
No single factor explains a draw this large. Three converged simultaneously, and the combination is what makes the signal structurally meaningful rather than a timing quirk.
- Higher refinery runs. Crude runs increased by approximately 271,000 barrels per day week-on-week. Over seven days, that additional throughput alone accounts for nearly 1.9 million barrels of extra crude drawn from storage compared to the prior week. Elevated runs are consistent with strong summer gasoline demand and attractive refining margins.
- Tighter import-export balance. Imports declined and exports rose, squeezing net crude inflows. When exports are strong, the U.S. effectively acts as a swing supplier to international markets, and domestic inventories fall even if domestic demand holds steady.
- An already-lean starting point. Commercial stocks were already approximately 6% below the five-year seasonal average in the prior week. In a low-inventory environment, the same combination of stronger runs and firmer exports produces proportionally larger percentage changes in weekly draws.
Petrol stocks remaining near unchanged even as demand stayed firm completes the picture: refinery throughput was keeping pace with consumption rather than running ahead of it, meaning additional crude processed went directly into end-use channels rather than into product buffer rebuilding.
Why lean inventories amplify every barrel drawn
The mathematics are simple but the market implications are significant. A 7.2 million barrel draw from a 404 million barrel base represents a larger percentage move than the same draw from a 450 million barrel base. When stocks are below seasonal norms, every barrel removed registers more sharply in percentage terms.
Trader positioning adjusts faster in this environment because there is less buffer absorbing supply disruptions or demand spikes. The result: each EIA report carries more price-moving potential when inventories are lean than when they sit comfortably above the five-year band.
The convergence of three separate drivers tells you this draw is not attributable to a single anomaly likely to reverse next week. It reflects a system under sustained tightening pressure.
How to read an EIA inventory report the way professionals do
The EIA’s Weekly Petroleum Status Report is free, published every Wednesday, and is one of the most directly market-moving data releases in the commodity calendar. Knowing how to read it systematically is a practical edge. Here is the framework professionals apply, using this week’s data as the live example at each step.
- Start with consensus versus actual. Before drawing any conclusion from the headline figure, check what the market expected. A small difference of 1-2 million barrels is usually noise. A miss of 5-8 million barrels, like this week, merits investigation.
- Look at the whole barrel, not just crude. Review changes in gasoline and distillate stocks to determine whether the crude draw is demand-driven (strong product draw alongside crude) or more trade-driven (exports and imports). This week, gasoline was flat and distillates built modestly, suggesting the crude tightness was more a supply-side and export story than a domestic consumption surge.
- Check refinery utilisation. Utilisation above 90-92% signals refiners are running hard, typically because product demand and crack spreads (the difference between crude input costs and refined product prices) are strong. High runs combined with crude draws is a bullish near-term combination.
- Benchmark against the five-year average. Stocks 7% below the seasonal band during a high-demand season carries more weight than the same reading in a low-demand period.
- Focus on trends, not single prints. Examine 4-8 weeks of data rather than reacting to one report. A single sharp draw can be driven by port congestion or a temporary export spike. A sequence of draws with stocks remaining below the five-year average is more likely to reflect a genuine shift.
The interpretive rule: A single large draw can be a timing quirk. A sequence of draws that keeps stocks below the five-year seasonal band is a structural signal. That distinction is the difference between noise and a thesis.
The five-year average band: what it is and why it matters
The five-year average band is the EIA’s own seasonal benchmark, recalculated annually using the prior five years of weekly data. It represents what normal supply conditions look like for each specific week of the year.
Reading stocks against this band, rather than against a fixed absolute threshold, accounts for seasonal demand patterns. Higher summer gasoline consumption and winter heating fuel draws mean the “right” inventory level shifts throughout the year. A reading 7% below the band in late July, peak driving season, carries more analytical weight than the same gap in a shoulder month.
What tighter crude stocks mean for different types of energy investors
The same tightness creates different risk-reward profiles depending on your exposure.
| Investor Segment | Key Metric to Monitor | Primary Risk to Watch |
|---|---|---|
| Crude futures / energy ETFs | Weekly EIA crude draws; Cushing levels | Demand destruction as prices rise |
| Integrated majors / upstream | Price realisations vs. cost inflation | Geopolitical and operational disruption |
| Refiners | Crack spreads; product inventory builds | Crude spike compressing margins |
| Midstream / storage | Cushing hub capacity; throughput volumes | Flow management at very low hub levels |
For crude futures and broad energy ETF holders, multi-year-low inventories and a large surprise draw support a near-term bullish bias. Brent moved into the low-to-mid $90s and WTI into the mid-to-high $80s as of 30 July reporting. But rising prices bring demand destruction risk that needs monitoring alongside inventory data.
For integrated majors and upstream producers, elevated prices support cash flows and capital returns, provided cost inflation stays contained. Geopolitical risk remains elevated, and operational disruption can erode the benefit even as price realisations improve.
Refiners sit in a more nuanced position. High throughput and lean product stocks suggest robust crack spreads. But a crude price spike that outruns product price increases could compress margins quickly. Tracking gasoline and distillate stocks alongside crude is where the refining thesis lives.
Variables each segment should be tracking week-on-week:
- Crude futures/ETFs: Weekly commercial crude changes, Cushing relative to the 20 million barrel threshold
- Upstream: Price realisations versus operating cost trends, geopolitical risk premiums
- Refiners: Crack spreads, product inventory direction, refinery utilisation rates
- Midstream: Hub capacity utilisation, throughput volumes, arbitrage spreads
When the system’s inventory buffer is this thin across commercial stocks, Cushing, and government reserves simultaneously, the risk premium built into crude prices is not speculative excess. It is a rational market response, and it should factor into your energy exposure sizing.
The war-risk premium in crude prices is not additive to the inventory signal but interactive with it; Brent’s 6.8% single-session drop on 27 July as ceasefire signals emerged showed that even a partially stripped premium can move prices more sharply than a multi-million barrel inventory draw, which is why monitoring both variables simultaneously is the more complete analytical framework.
What the next four to six weeks of EIA data will actually confirm or deny
This week’s report is striking. Whether it marks a structural inflection or a transient dislocation depends on what comes next.
The core binary is clear. If subsequent weekly reports show continued draws with stocks remaining well below the five-year average, the structural tightening thesis firms. If stocks rebuild toward seasonal norms over the next four to six weeks, this week reads as a sharp but temporary swing driven by shipping and refinery timing.
The interpretive challenge of separating inventory signals and geopolitical risk became acute in the preceding two weeks, when back-to-back U.S. crude builds failed to dent prices because Houthi naval blockade threats were adding a war-risk premium that pulled in the opposite direction, demonstrating exactly why no single data series provides a complete picture of the oil market in the current environment.
Here are the specific indicators to watch, in order of priority:
- Weekly EIA commercial crude inventories. Track direction and magnitude of draws or builds in each release.
- Cushing levels relative to the 20 million barrel threshold. Any move further below 18.6 million barrels increases logistical risk for WTI delivery and can cause outsized intraday price volatility.
- EIA Short-Term Energy Outlook (STEO) revisions. The STEO has already been trimming inventory projections; watch for further downward revisions that validate the tightening trend.
- Global context: OECD stock trends and oil-on-water data. These complementary measures tell you whether U.S. tightness is part of a broader global squeeze or a domestically concentrated phenomenon.
The conditional test: Four to six weeks of consecutive EIA draws with stocks remaining below the five-year seasonal band confirms a structurally tighter market. A rebuild toward seasonal norms over that same window suggests this week’s 7.2 million barrel figure was a transient dislocation, not a lasting shift.
That monitoring window is the horizon at which you will be able to distinguish a market that is genuinely re-tightening from one where a single week’s shipping and refinery timing created a misleadingly large number.
One data point does not change a thesis, but this one is hard to dismiss
Three signals arrived in the same week: an absolute stock level at a multi-year low, a surprise draw of a magnitude that forced markets to reprice, and a Cushing level below operational comfort thresholds. Each individually would warrant attention. Together, they form a coherent picture of a U.S. crude system with materially less buffer than it carried even a few months ago.
Whether this is the beginning of a sustained tightening period or a sharp one-week anomaly cannot be determined from a single report. Investors who treat it as settled are running ahead of the evidence. The next four to six EIA releases will provide the confirmation or contradiction.
The strongest takeaway is not directional. It is about risk calibration. Thin inventories reduce the system’s tolerance for disruption and warrant closer attention to weekly data regardless of your current portfolio stance. The value of this week’s data is not as a buy or sell signal. It is a prompt to reassess whether your current energy exposure is sized appropriately for a market where the supply buffer has materially thinned.
This article is for informational purposes only and should not be considered financial advice. Investors should conduct their own research and consult with financial professionals before making investment decisions. Past performance does not guarantee future results. Financial projections are subject to market conditions and various risk factors.