For most of the past three decades, US Treasury bonds and crude oil have behaved like strangers who happen to share a market. Sometimes they moved together, more often they did not, and the received wisdom held that Treasuries were the safe haven investors ran toward when oil-driven turmoil hit. That relationship has quietly inverted, and the data now proves it.
According to Commerzbank analysts, the positive correlation between Brent crude and 5-year US Treasury yields has climbed to its strongest reading since 1989, a roughly 35-year high in how tightly these two markets track each other.
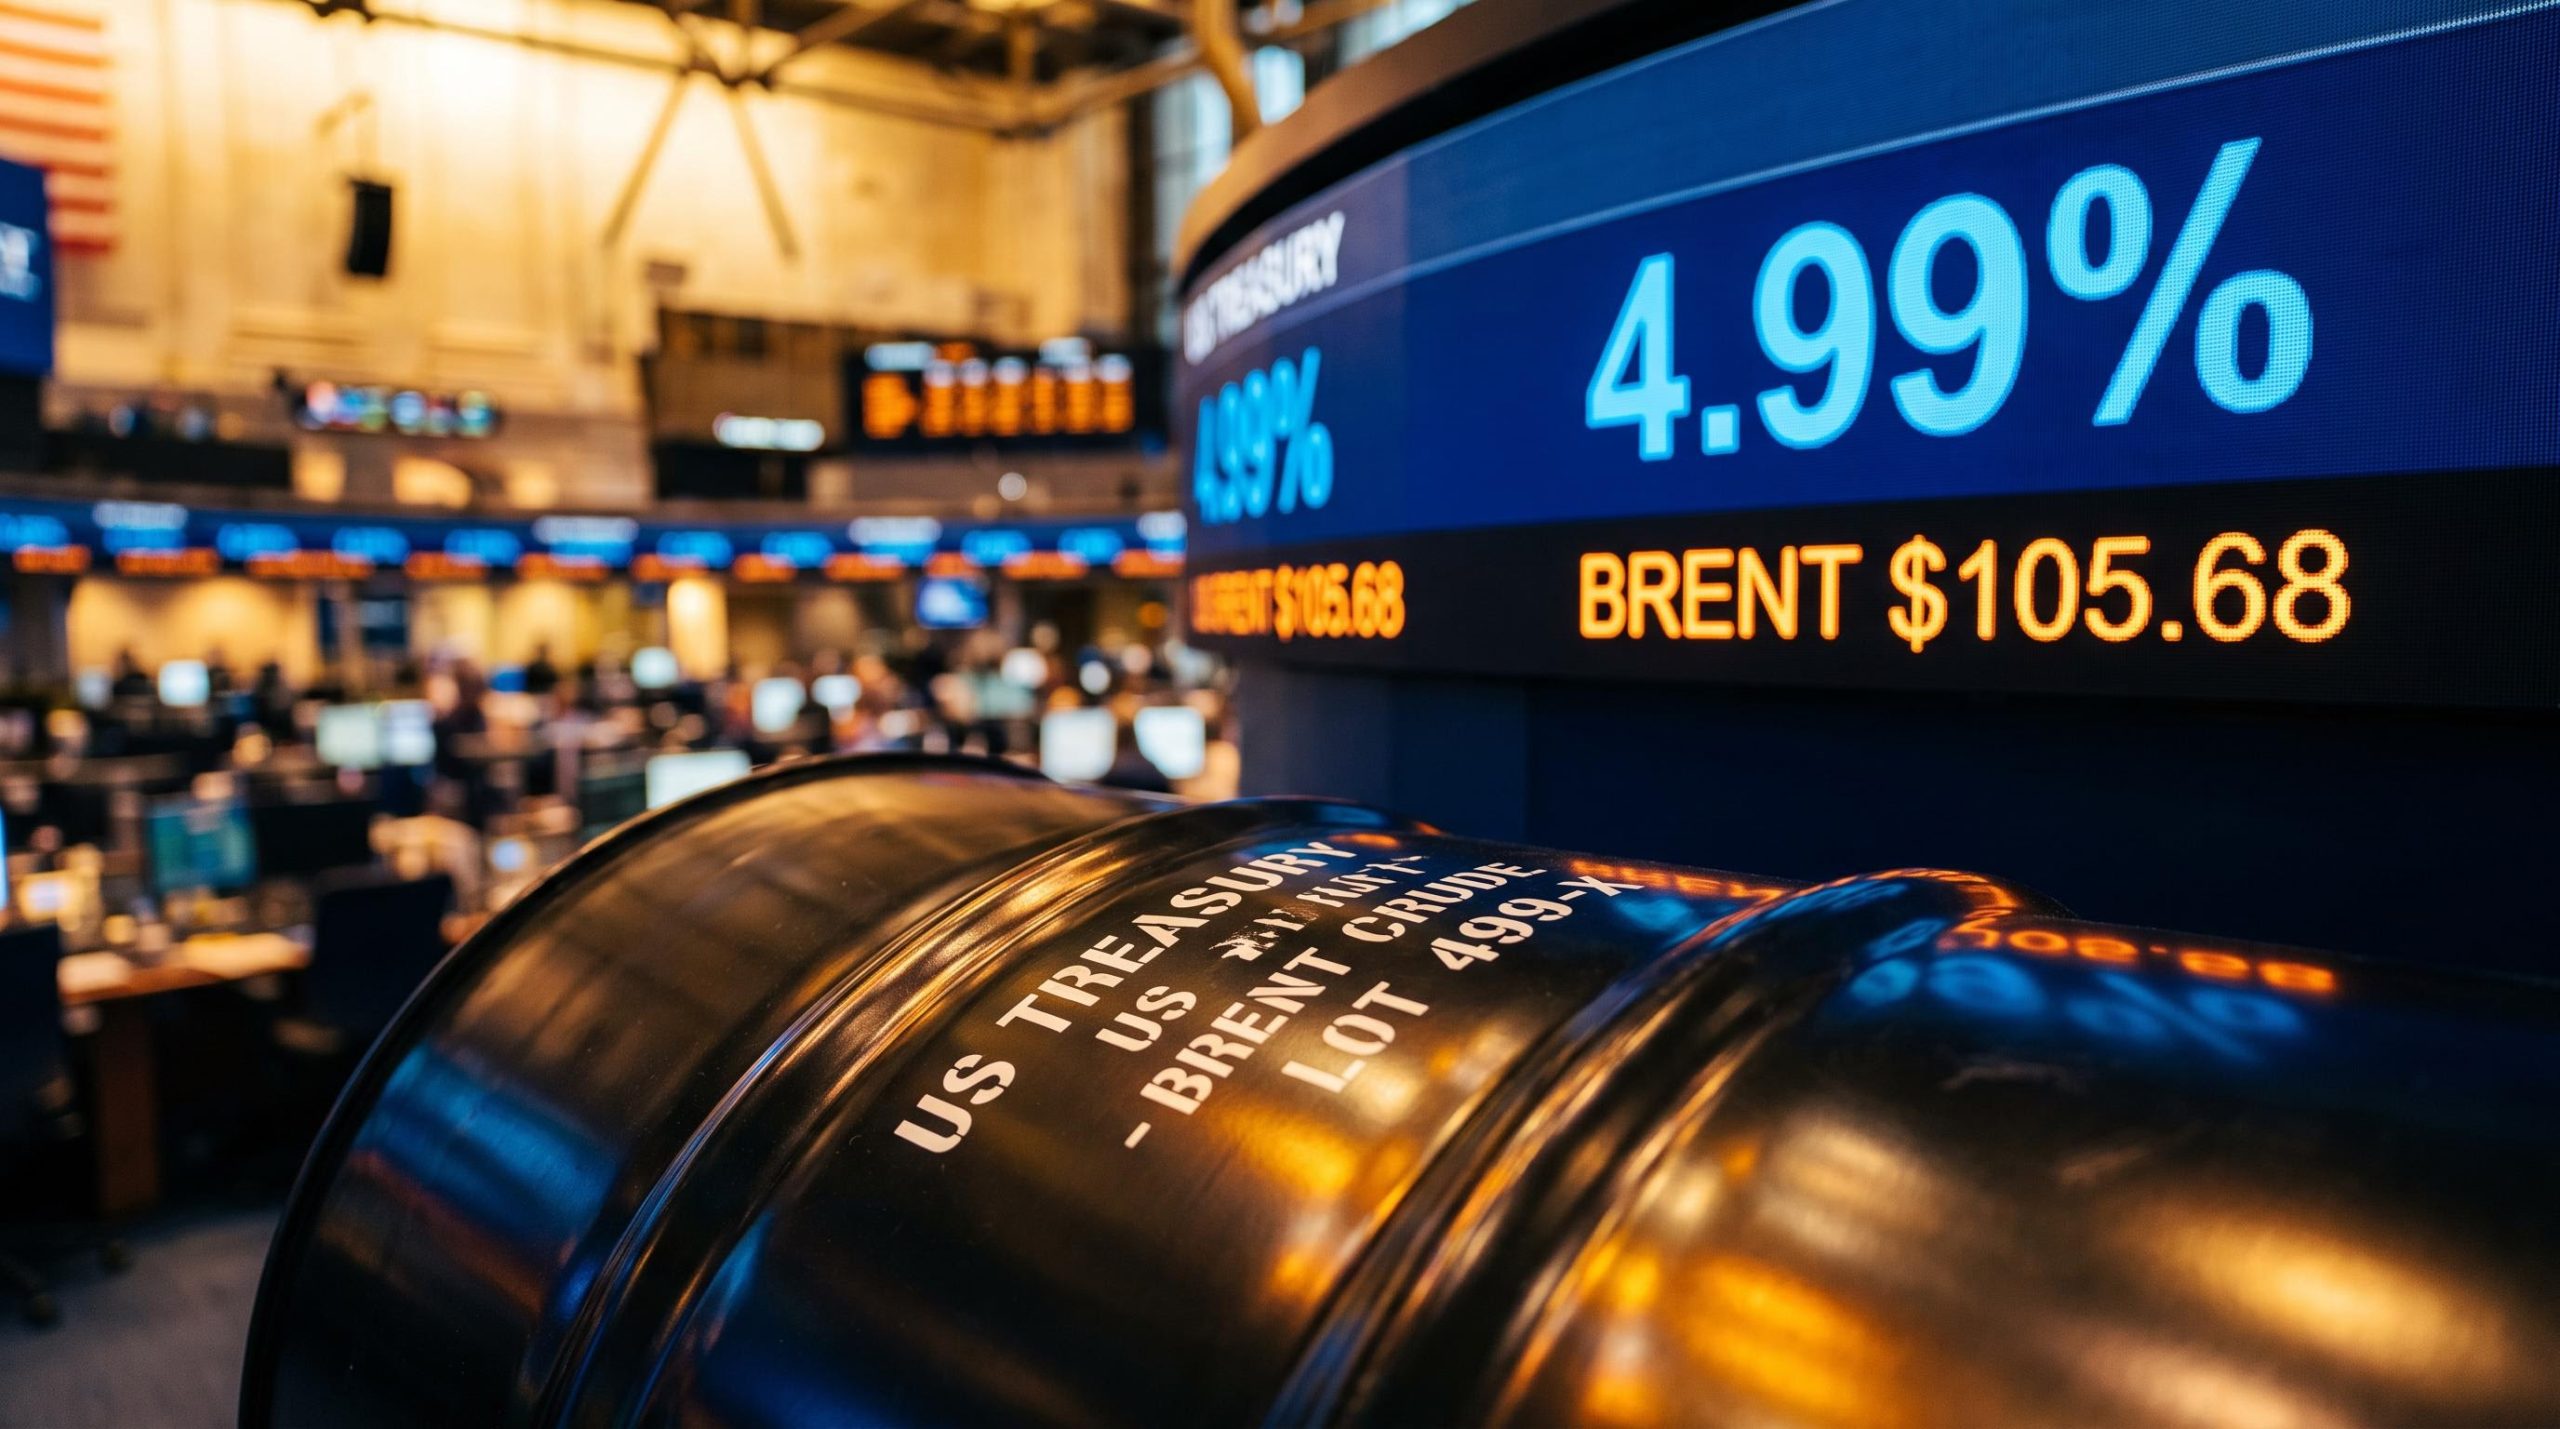
The timing sharpens the point. As of late September 2026, Brent crude is trading above $100 per barrel while the 5-year Treasury yield has pushed toward 5% for the first time in about two decades. Two asset classes that many portfolios hold precisely because they were thought to offset each other are now moving in lockstep.
Here is what that lockstep actually tells you about the inflation regime beneath it, and what it means for any portfolio holding both oil prices and Treasury yields exposure. This is less an academic curiosity than an investor briefing, because the correlation is doing real work on how much room the Federal Reserve has left.
A 35-year anomaly in the bond and oil markets
Start with the rarity, because the rarity is the signal. A correlation last seen in 1989 is not routine market noise. It is a configuration that has surfaced roughly once in a generation, which means the assumptions underpinning many bond-and-commodity portfolios were built during a period when this relationship simply did not hold.
Commerzbank’s characterisation The positive correlation between Brent crude oil prices and 5-year US Treasury yields has climbed to its highest level since 1989, according to Commerzbank analysts, with yields rising 17 basis points in a single session and briefly surpassing 5%.
Not every analyst frames the benchmark the same way. Kathleen Brooks, Research Director at XTB, describes the oil-yield correlation as sitting at a seven-year high rather than a 35-year one. The two characterisations use different historical windows, but they agree on the substance: the relationship is stretched well beyond its normal range. Where the sources differ is the depth of the record, not the direction of the signal.
The market conditions framing this are specific. Brent settled at $105.68 per barrel on 14 September 2026, according to Reuters, after breaching $100 earlier in the month and trading between $100.95 and $101.58 on 9 September 2026. Through mid-to-late September, Brent held a range of roughly $99 to $108.
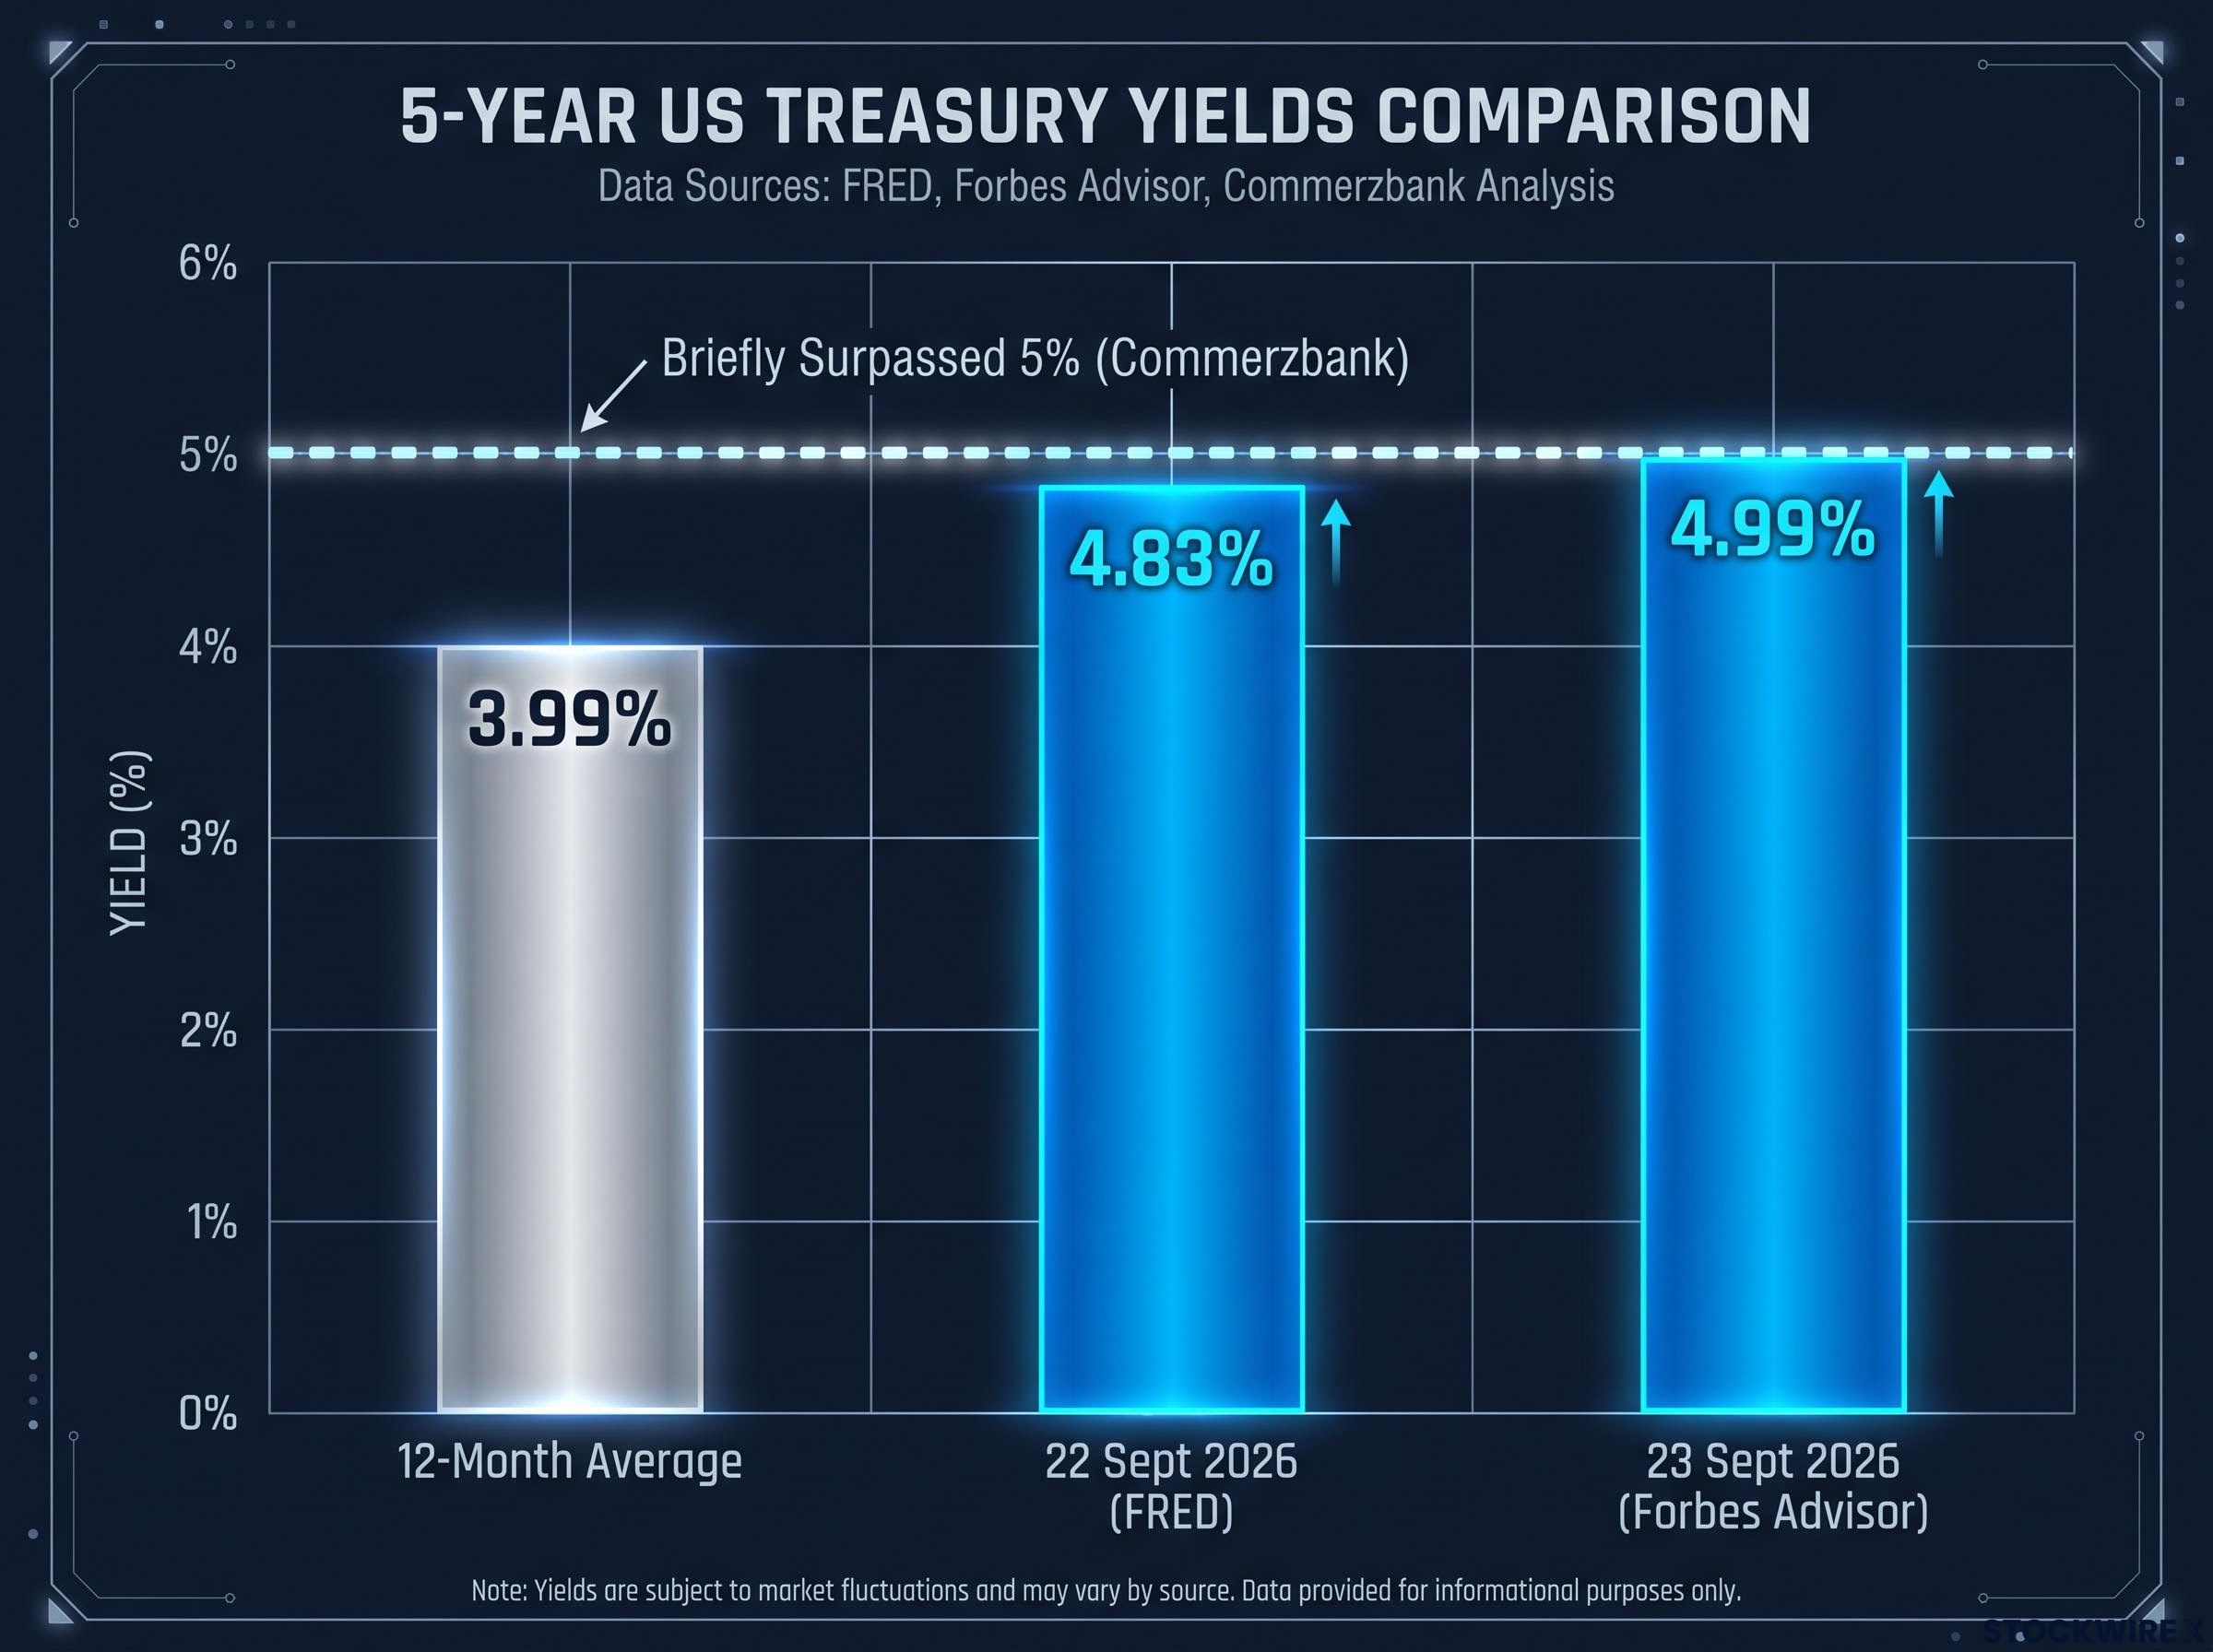
On the Treasury side, readings cluster just below the 5% mark across data providers:
- 4.99% on 23 September 2026 (Forbes Advisor)
- 4.83% on 22 September 2026 (FRED DGS5 and YCharts)
- 4.85% on 22 September 2026 (TradingEconomics)
- 4.855% close with a 4.867% session high on 18 September 2026 (Mortgage News Daily)
One caveat matters here. The 5% breach that Commerzbank flagged appears to have been an intraday move during a single volatile session. Closing levels across the major data providers remained just below 5%, so the level is best understood as a threshold that has been tested and briefly touched rather than one that yields have settled above.
| Date | Brent Crude | 5-Year Yield | Yield Source |
|---|---|---|---|
| 9 September 2026 | $100.95-$101.58 | – | Reuters (Brent) |
| 14 September 2026 | $105.68 | – | Reuters (Brent) |
| 18 September 2026 | – | 4.867% (high) | Mortgage News Daily |
| 22 September 2026 | – | 4.83%-4.85% | FRED / YCharts / TradingEconomics |
| 23 September 2026 | – | 4.99% | Forbes Advisor |
For context, that 4.99% reading sits a full percentage point above the 5-year yield’s 12-month average of 3.99%. What this tells you is that the current regime is not a transient blip to wait out. It is a structural signal, and portfolios built on the older assumption that oil stress sends investors into bonds are exposed in a way their owners may not yet have noticed.
When big ASX news breaks, our subscribers know first
Why oil and yields are moving in the same direction
To understand why the two are marching together, follow the money through inflation expectations. The logic chain is short and it holds up at each step.
- Higher oil prices raise headline inflation and, more importantly, the inflation investors expect to see in the years ahead.
- Markets respond by demanding higher yields to compensate for that inflation risk, and to reflect a Federal Reserve that has less room to cut rates.
- Oil and yields therefore rise together, while oil and bond prices fall together.
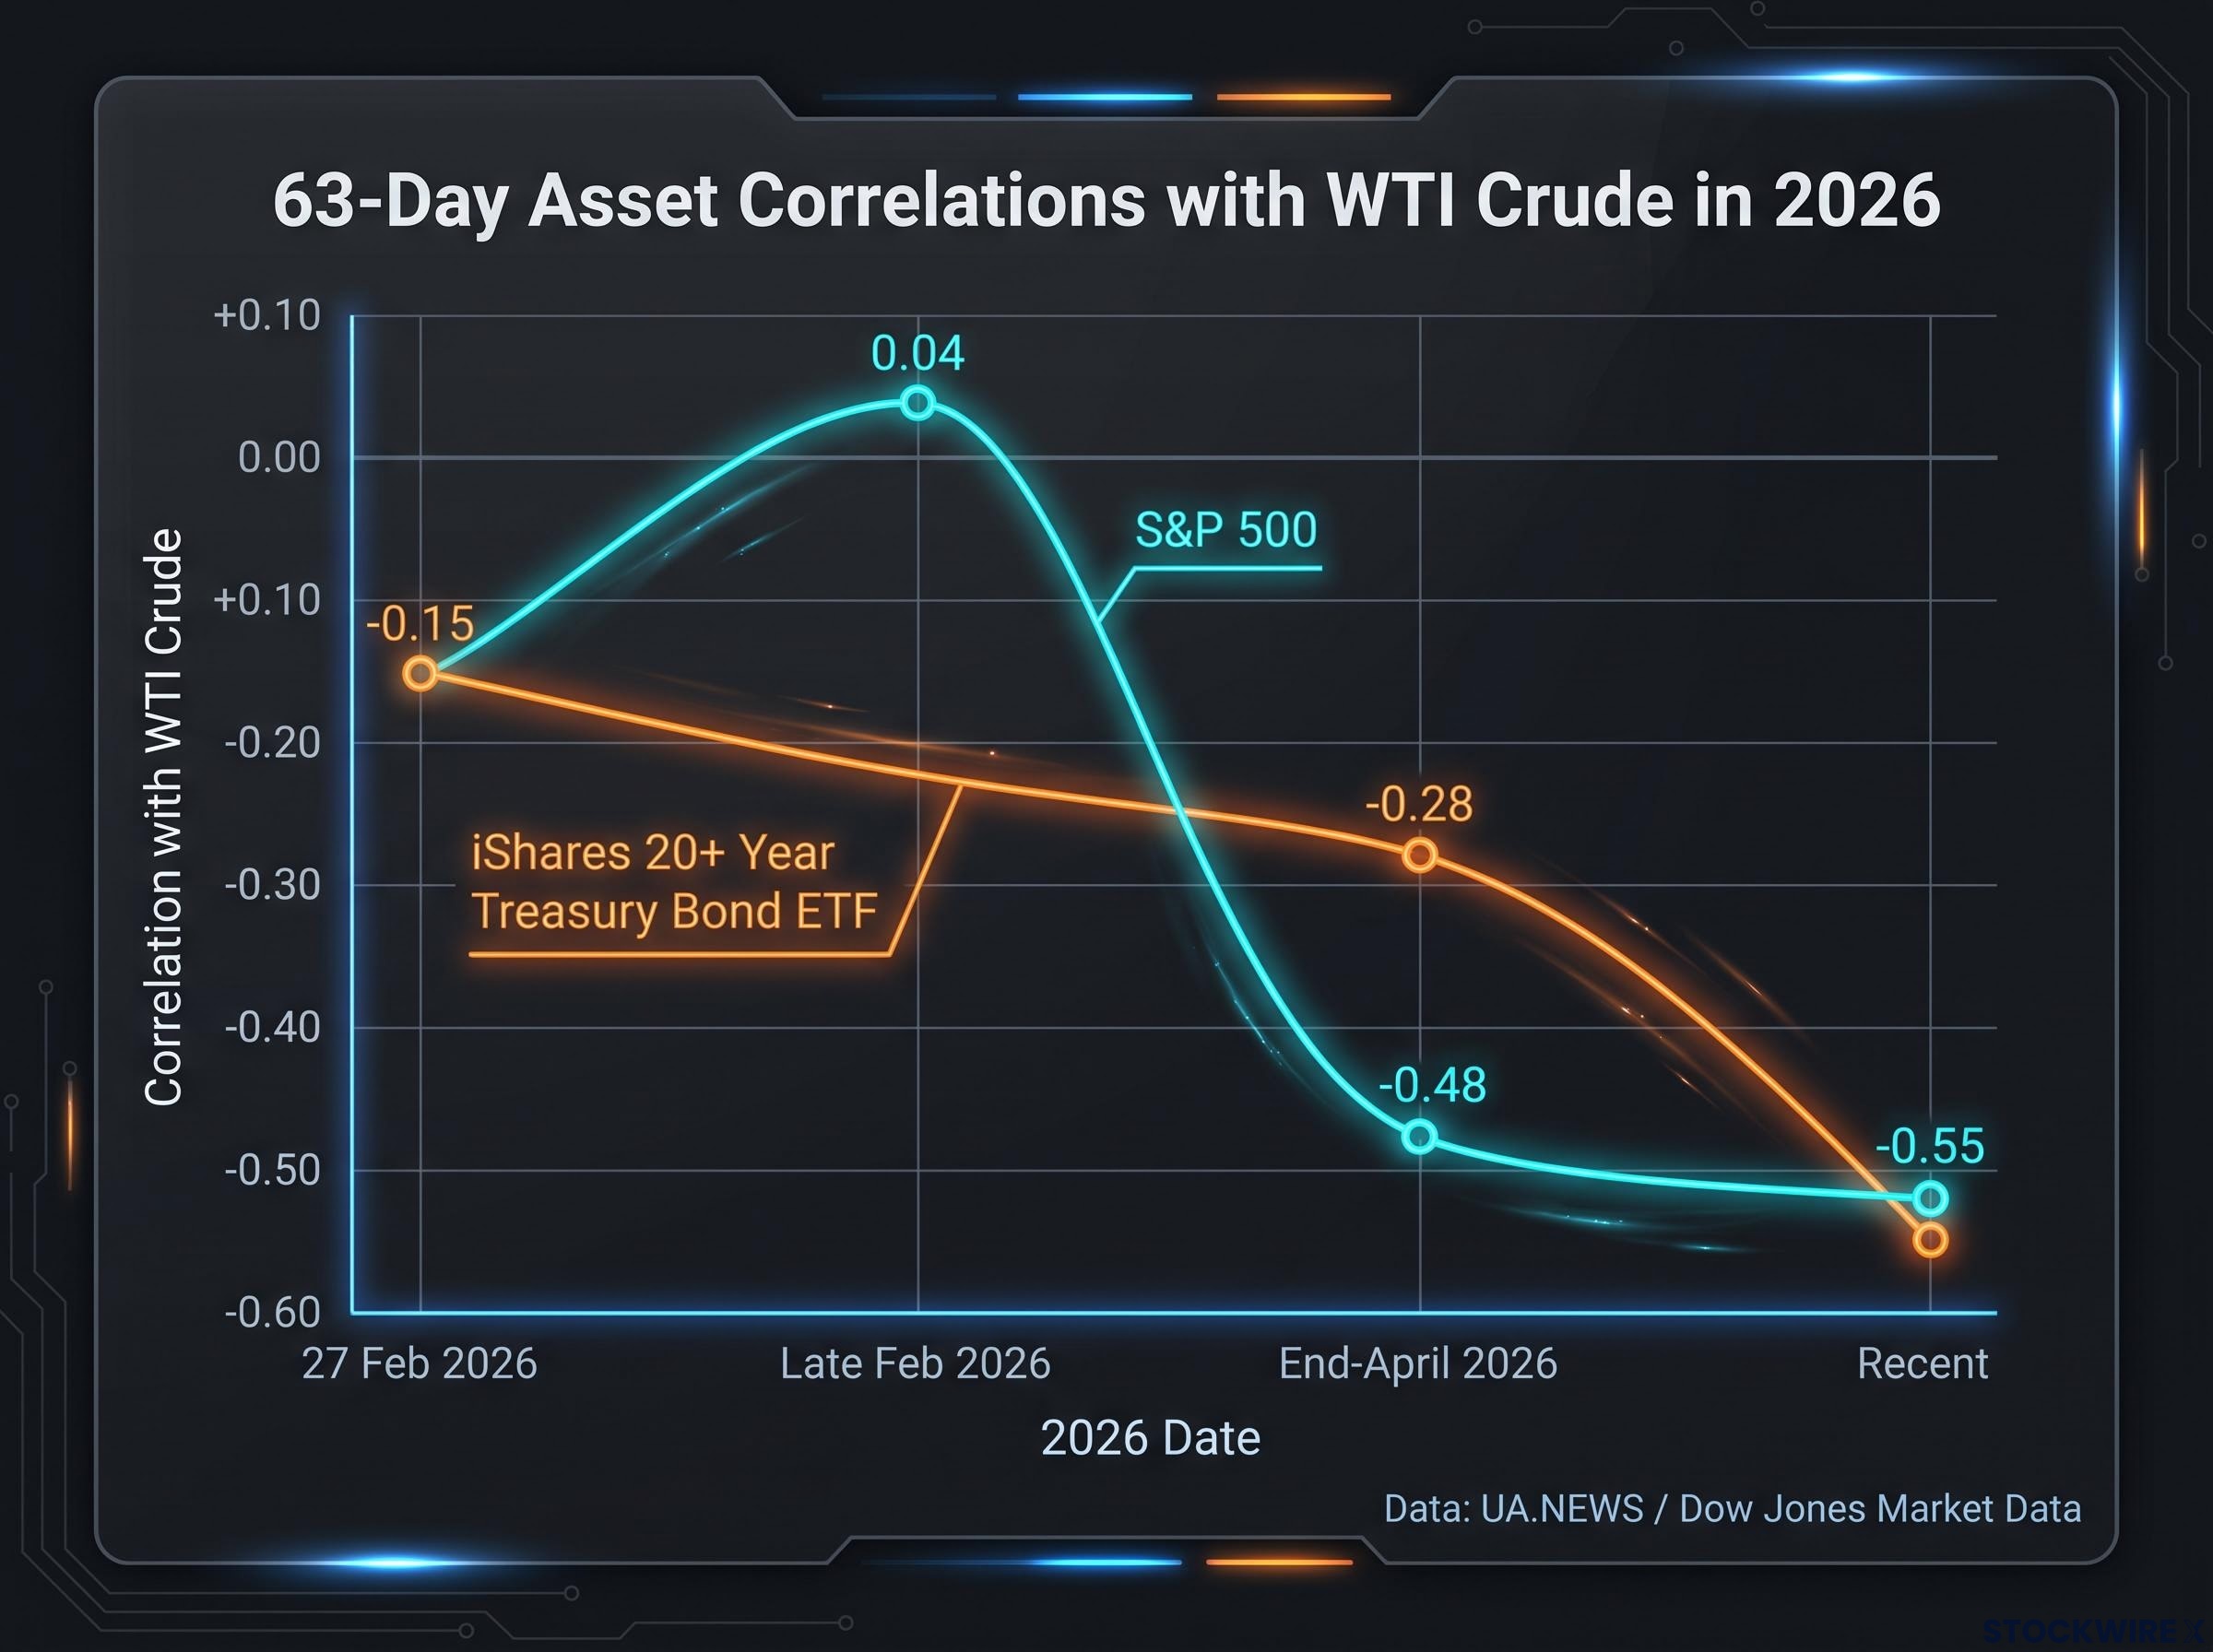
This is the transmission channel, and it explains the mirror-image data. UA.NEWS, citing Dow Jones Market Data, reports that the 63-day correlation between WTI crude and the iShares 20+ Year Treasury Bond ETF moved from -0.15 on 27 February 2026 to -0.28 by end-April, and then to -0.55 in a more recent session. As oil climbed, long-duration bond prices fell harder. The increasingly negative price correlation is simply the yield correlation viewed from the other side.
Kathleen Brooks of XTB argues this reflects a genuine regime shift. Treasury yields, in her reading, are now driven more by inflation dynamics than by safe-haven flows. That is precisely why rising oil stress is pushing yields up rather than pulling them down, as a flight-to-quality bid would have done in earlier decades.
When the cause of the oil move changes the macro signal
The mechanism has a complication worth pausing on, because not all oil rallies mean the same thing. A demand-driven rally, where oil rises because the global economy is running hot, tends to coincide with genuine reflation and healthy real growth. A supply-driven spike is a different animal.
September 2026’s rally is supply-driven. Reuters reported that Saudi strikes on 14 September 2026 stoked supply worries, and the broader Middle East escalation added a geopolitical premium to the price. That origin matters, because a supply shock can be stagflationary: it pushes costs up without delivering the growth benefit that would normally accompany strong demand.
Nomura’s read Charlie McElligott, strategist at Nomura, has described oil and energy as the “defining factor” in the current global macro risk regime, positioning energy prices as a central driver of rates and risk assets rather than a peripheral input.
Several other forces reinforce the picture without replacing it. Term-premium rebuilding, heavy Treasury issuance, and large fiscal deficits can all push yields higher on their own, and in the current environment they are compounding the inflation channel rather than offsetting it. The stagflationary possibility, higher inflation alongside weaker growth, is the scenario the Fed has the least room to navigate, and it is the one worth stress-testing your positioning against.
What the correlation tells you about the Fed’s room to move
When oil and yields rise together, the market is making a statement: it is pricing energy shocks as inflation-sustaining rather than deflationary. That reading directly constrains the Federal Reserve, because cutting rates into an energy-driven inflation backdrop risks unanchoring inflation expectations and undermining the Fed’s credibility on prices.
The constraint is not theoretical. Higher 5-year yields, sitting between 4.83% and 4.99%, tighten financial conditions before the Fed lifts a finger. The intermediate part of the yield curve feeds directly into borrowing costs across the economy through three concrete channels:
- Mortgage rates, which track intermediate Treasury yields closely and shape housing affordability
- Corporate borrowing costs, which reset higher as the yield curve reprices
- Equity valuations, which compress when a higher discount rate is applied to future earnings
The elevation in context At 4.99%, the 5-year Treasury yield is running roughly 100 basis points above its 12-month average of 3.99%, meaning the intermediate curve is already imposing restrictive conditions without any additional Fed action.
The bind is precise. Sustained Brent above $100 gives the Fed less analytical and political cover for easing, even if growth softens, because the energy components of headline CPI and PCE will resist the deceleration that would justify a cut. Any cut delivered into that backdrop risks being read as the Fed tolerating inflation.
The 17-basis-point single-session move that Commerzbank flagged shows how fast the market can reprice Fed expectations when energy data shifts. For anyone holding rate-sensitive assets, long-duration Treasuries, growth stocks, or leveraged real estate, the read is uncomfortable but clear. The rate relief you may be waiting for is being delayed not by Fed inaction but by the market’s own repricing, and that delay carries a measurable cost that is already showing up in asset prices.
How investors holding both asset classes should respond
Here is the core problem, stated plainly. Owning long-dated Treasuries alongside energy exposure no longer guarantees that one offsets the other. In this regime, both are responding to the same inflation signal, which means they can move against you at the same time rather than providing the countervailing balance that traditional diversification assumes.
The correlation data makes this concrete. That 63-day WTI-to-long-Treasury-ETF correlation moving from -0.15 to -0.55 across 2026 is a live stress test of the 60/40 and bonds-plus-commodities models. The broader picture reinforces it: the 63-day WTI-to-S&P-500 correlation shifted from 0.04 in late February to -0.48 by end-April 2026, as risk assets and energy repriced against each other.
Sophisticated managers are making four adjustments in response:
- Shortening duration and rotating toward inflation-linked securities
- Reclassifying energy as macro-beta rather than a diversifier
- Expanding the hedging toolkit beyond Treasuries
- Monitoring the correlation itself as a regime indicator
| Strategy | What It Addresses | Practical Implementation | Who It Applies To |
|---|---|---|---|
| Duration management | Sensitivity to the inflation-expectations channel driving yield volatility | Shift toward shorter maturities and TIPS while keeping fixed-income quality | Bond-heavy portfolios exposed to long duration |
| Energy reclassification | Overestimating energy’s diversification benefit | Size energy as a macro-beta lever, not a hedge, relative to other risk factors | Portfolios holding energy as a supposed offset |
| Hedging toolkit expansion | Loss of the downside buffer Treasuries once provided | Add rate options, equity volatility instruments, and cross-asset hedges | Investors relying on bonds for protection |
| Correlation monitoring | Not knowing when the regime shifts | Track the 63-day WTI-Treasury price correlation as an early signal | Any investor holding both exposures |
TIPS, or Treasury Inflation-Protected Securities, are government bonds whose principal adjusts with inflation, which is why they blunt the inflation-expectations channel that is currently driving yield volatility. Macro-beta simply means an exposure that moves with the broad inflation and growth regime rather than against it.
The one risk management principle that overrides the rest
Strip away the tactics and one principle remains. When oil and Treasury yields rise together, long-duration bonds and energy equities are linked rather than offsetting, and any portfolio treating them as independent is carrying concentrated inflation and duration risk from both sides at once.
That principle holds until the correlation regime demonstrably shifts. The practical early-warning signal is the 63-day WTI-to-Treasury price correlation itself, which is why watching it beats assuming the current configuration is permanent.
What would break this correlation, and what to watch
Having made the case that the correlation is real and consequential, it is worth being honest about why it might not last. The oil-yield relationship is regime-dependent and historically unstable. There have been long stretches when the two moved inversely or barely at all, and the current positive reading reflects a specific macro configuration that can change.
Three conditions would most plausibly weaken it:
- A credible Fed commitment to looking through energy-driven inflation, which would reduce the yield response to oil moves
- A demand-driven growth slowdown that brings oil down alongside yields on recession fears
- A rapid resolution of the geopolitical supply disruption, which would deflate the supply-shock premium
The speed at which correlations can move is the reason for caution. That 63-day WTI-to-S&P-500 correlation swung from a near-neutral 0.04 to a strongly negative -0.48 in roughly two months. What that tells you is that correlation regimes can shift faster than most portfolio rebalancing cycles, which favours building in monitoring checkpoints over assuming stability.
The three signals worth monitoring in real time
Treat the following as a regime-change early-warning system rather than a prediction of when the correlation will snap:
- OPEC+ meeting outcomes and production decisions, which can reprice the oil curve overnight
- Fed communications on energy-driven versus core inflation, particularly language around energy exclusions in core PCE
- The 63-day rolling WTI-to-long-Treasury-price correlation, available through public data providers
Because September 2026’s high follows a specific geopolitical trigger, the Saudi strikes, the correlation is more event-dependent, and therefore more reversible, than one driven by underlying demand. If the regime reverts, the older safe-haven dynamic, oil up and yields down on recession fear, could return.
The regime has shifted, but it may not be permanent
The evidence points to a genuine macro-regime shift. The strongest oil-yield positive correlation in at least 35 years, per Commerzbank, reflects the inflation-expectations channel doing the driving, with the September 2026 supply shock layering a stagflationary overlay on top that leaves the Fed particularly boxed in.
The core finding With Brent above $100 and the 5-year yield between 4.83% and 4.99%, oil and Treasury yields are moving together at a frequency not seen since 1989, and the market is treating energy as inflation-sustaining rather than a signal to seek safe-haven bonds.
The honest caveat sits alongside the finding. This correlation is regime-dependent and partly event-driven, and it has never persisted indefinitely, which is why the sensible response is calibrated adjustment rather than wholesale portfolio restructuring.
The next inflection will most likely come from one of two catalysts: a Fed communications pivot signalling tolerance for energy inflation, or a geopolitical de-escalation that removes the supply-shock premium. The investor who dismisses this as noise and the investor who over-hedges against a permanent shift are making the same error of extrapolation. Active monitoring with incremental adjustment is what the data actually supports.
This article is for informational purposes only and should not be considered financial advice. Investors should conduct their own research and consult with financial professionals before making investment decisions. Past performance does not guarantee future results. Financial projections are subject to market conditions and various risk factors.