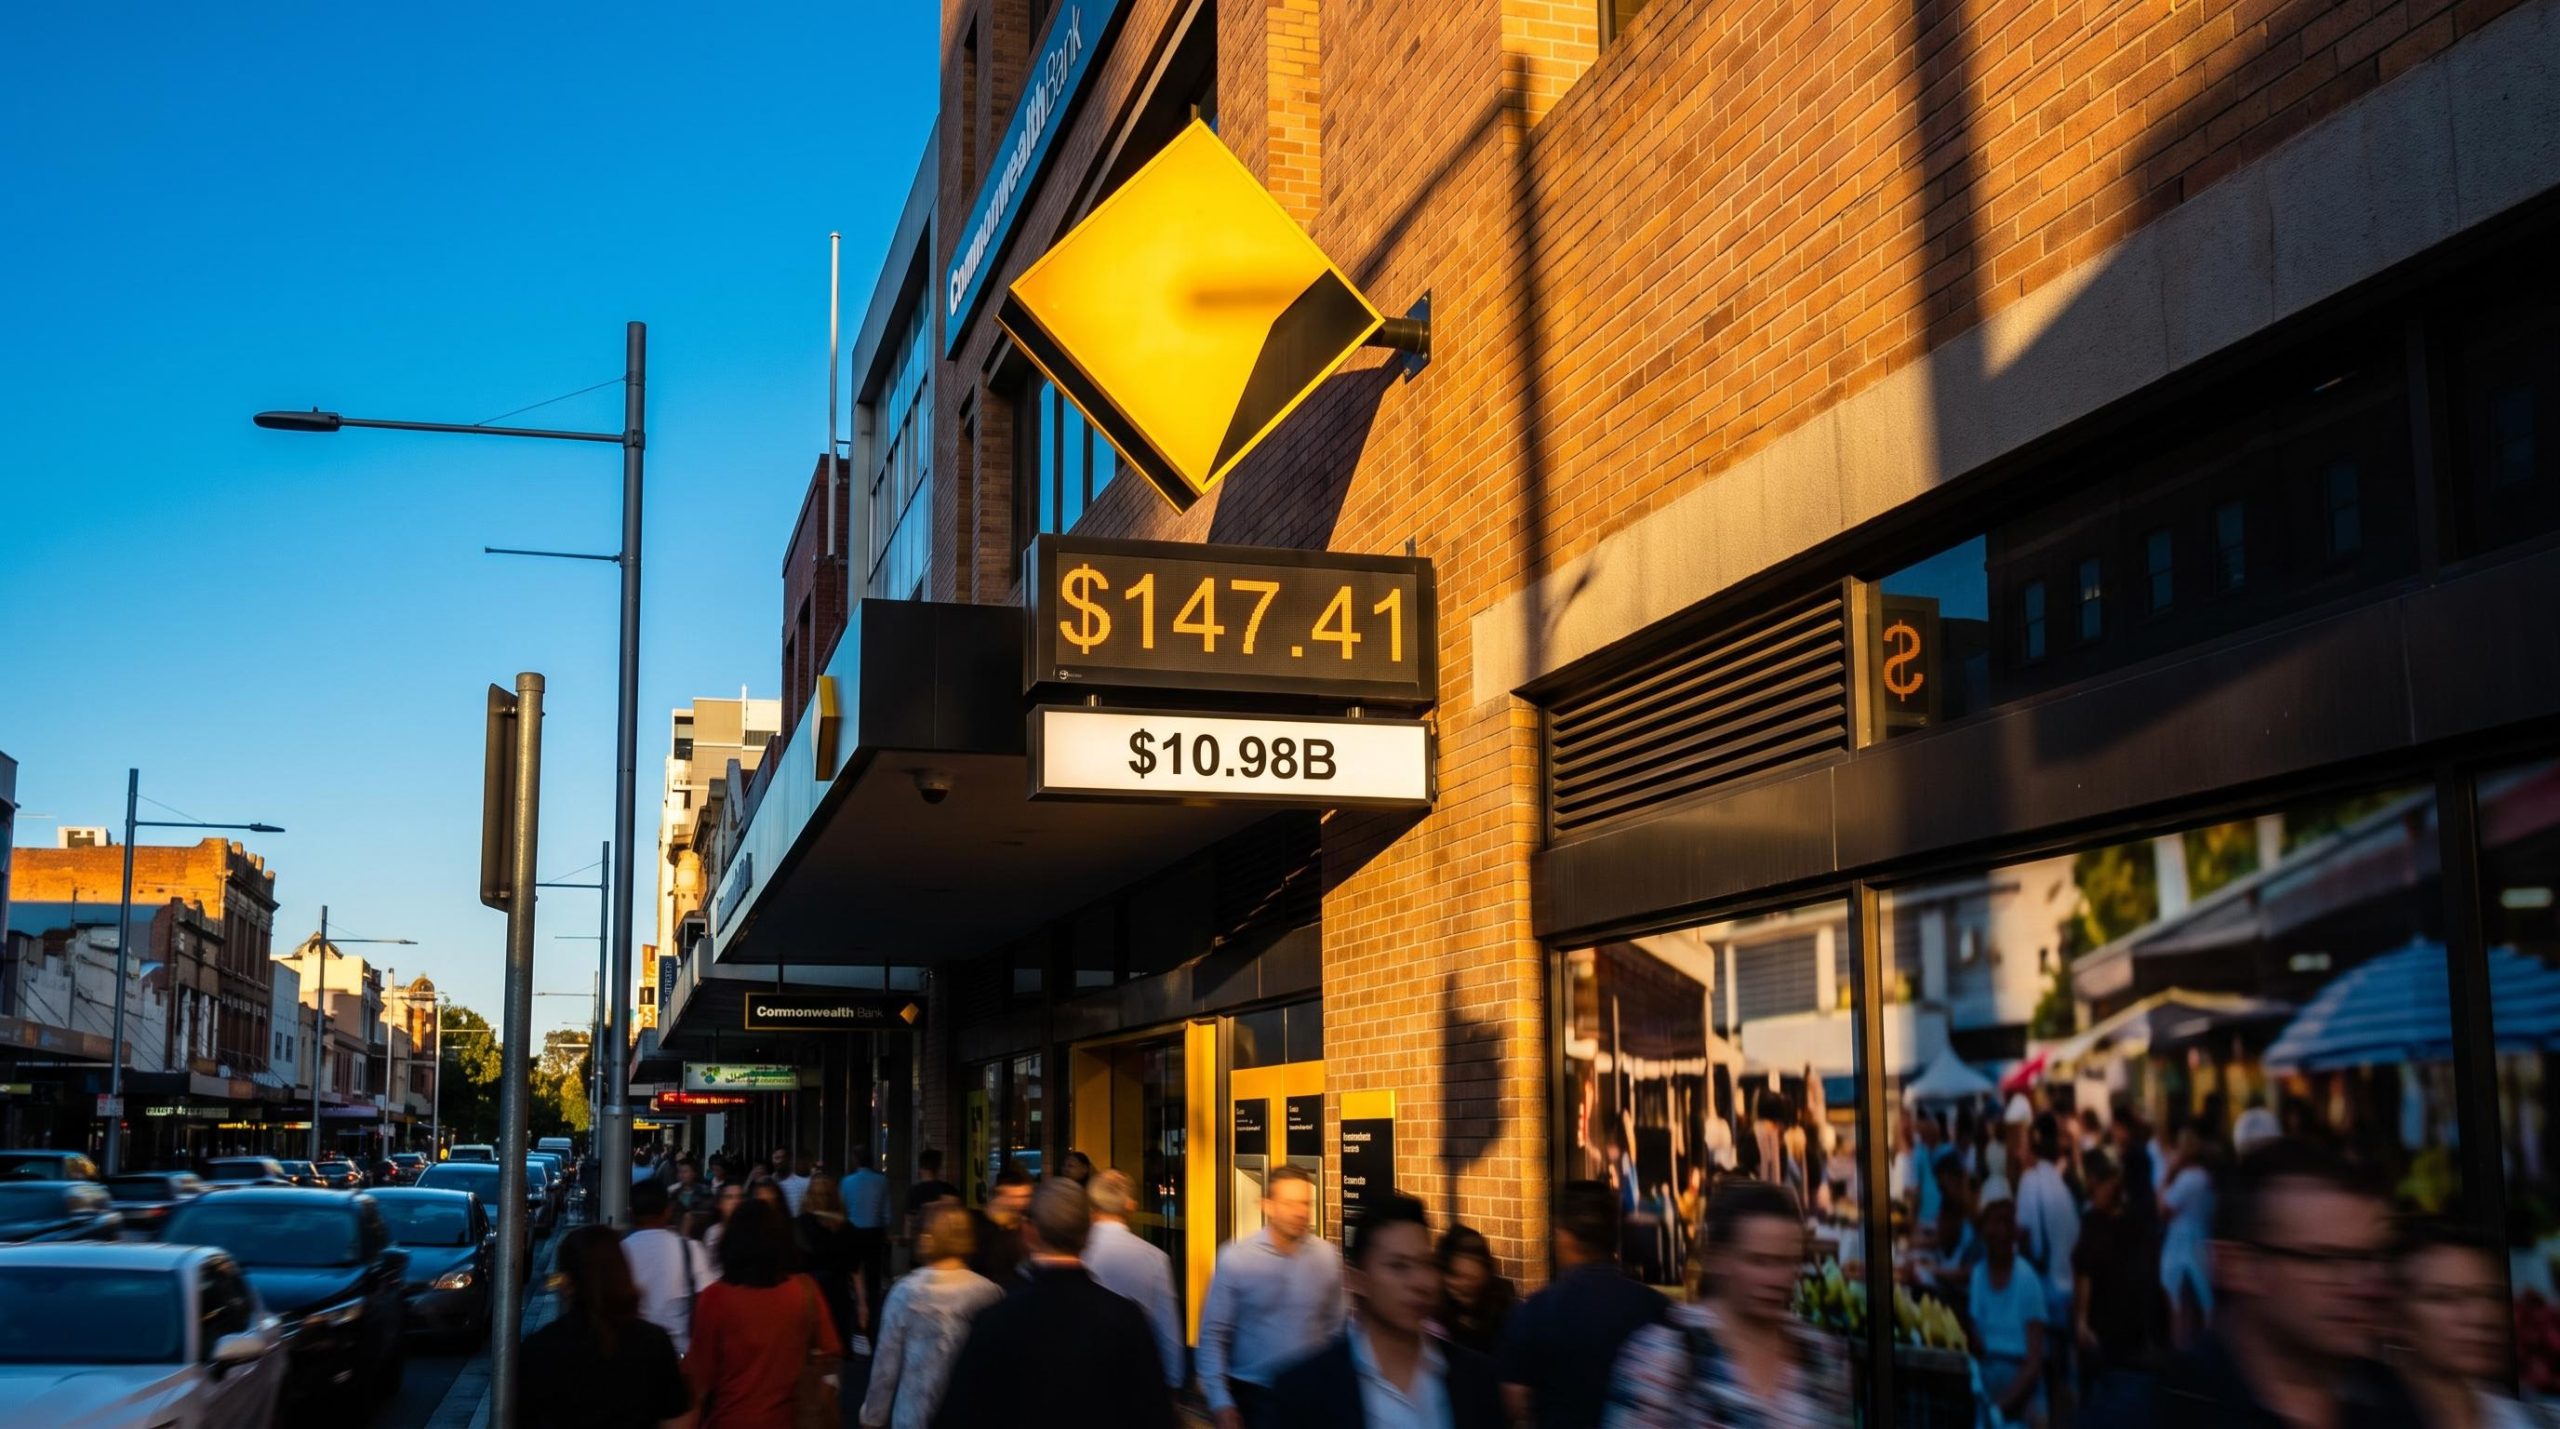
Commonwealth Bank of Australia just posted the biggest annual profit in its history, and its shares are 43 cents away from a 52-week low. On 12 August 2026, the bank reported a cash profit of $10.98 billion. Six weeks later, on 24 September 2026, the stock touched an intraday low of $147.41, hovering just above its 52-week floor of $146.98.
That gap between a record result and a sliding share price is the central question for anyone holding CBA right now. The stock has shed roughly 6% through September 2026. All fourteen sell-side analysts covering it rate it a sell, with a consensus target implying around 18% further downside. Yet shareholders collected a fully franked dividend of $5.05 per share.
The question the price action is really asking is a simple one: buying opportunity, or value trap? This piece lays out the specific numbers, the technical levels, and the competing analyst views so you can weigh CBA shares with your eyes open, not through optimism or panic. Here is what the data actually tells you.
A record profit and a share price heading the wrong way
Start with the result itself. CBA’s FY26 full-year numbers, released to the ASX on 12 August 2026, were the strongest in the bank’s history.
- Cash profit: $10.98 billion, up 7% year-on-year
- Fully franked dividend: $5.05 per share for FY26
- Earnings resilience maintained despite a rising-rate backdrop
Now look at what the market did with that. On 19 August 2026, CBA closed at $160.71. Just over five weeks later, on 24 September 2026, the stock fell to an intraday low of $147.41 before recovering to close near $149.45, down roughly 1.06% on the day. That is a decline of approximately 8% in five weeks, and the low was the weakest level since February 2026.
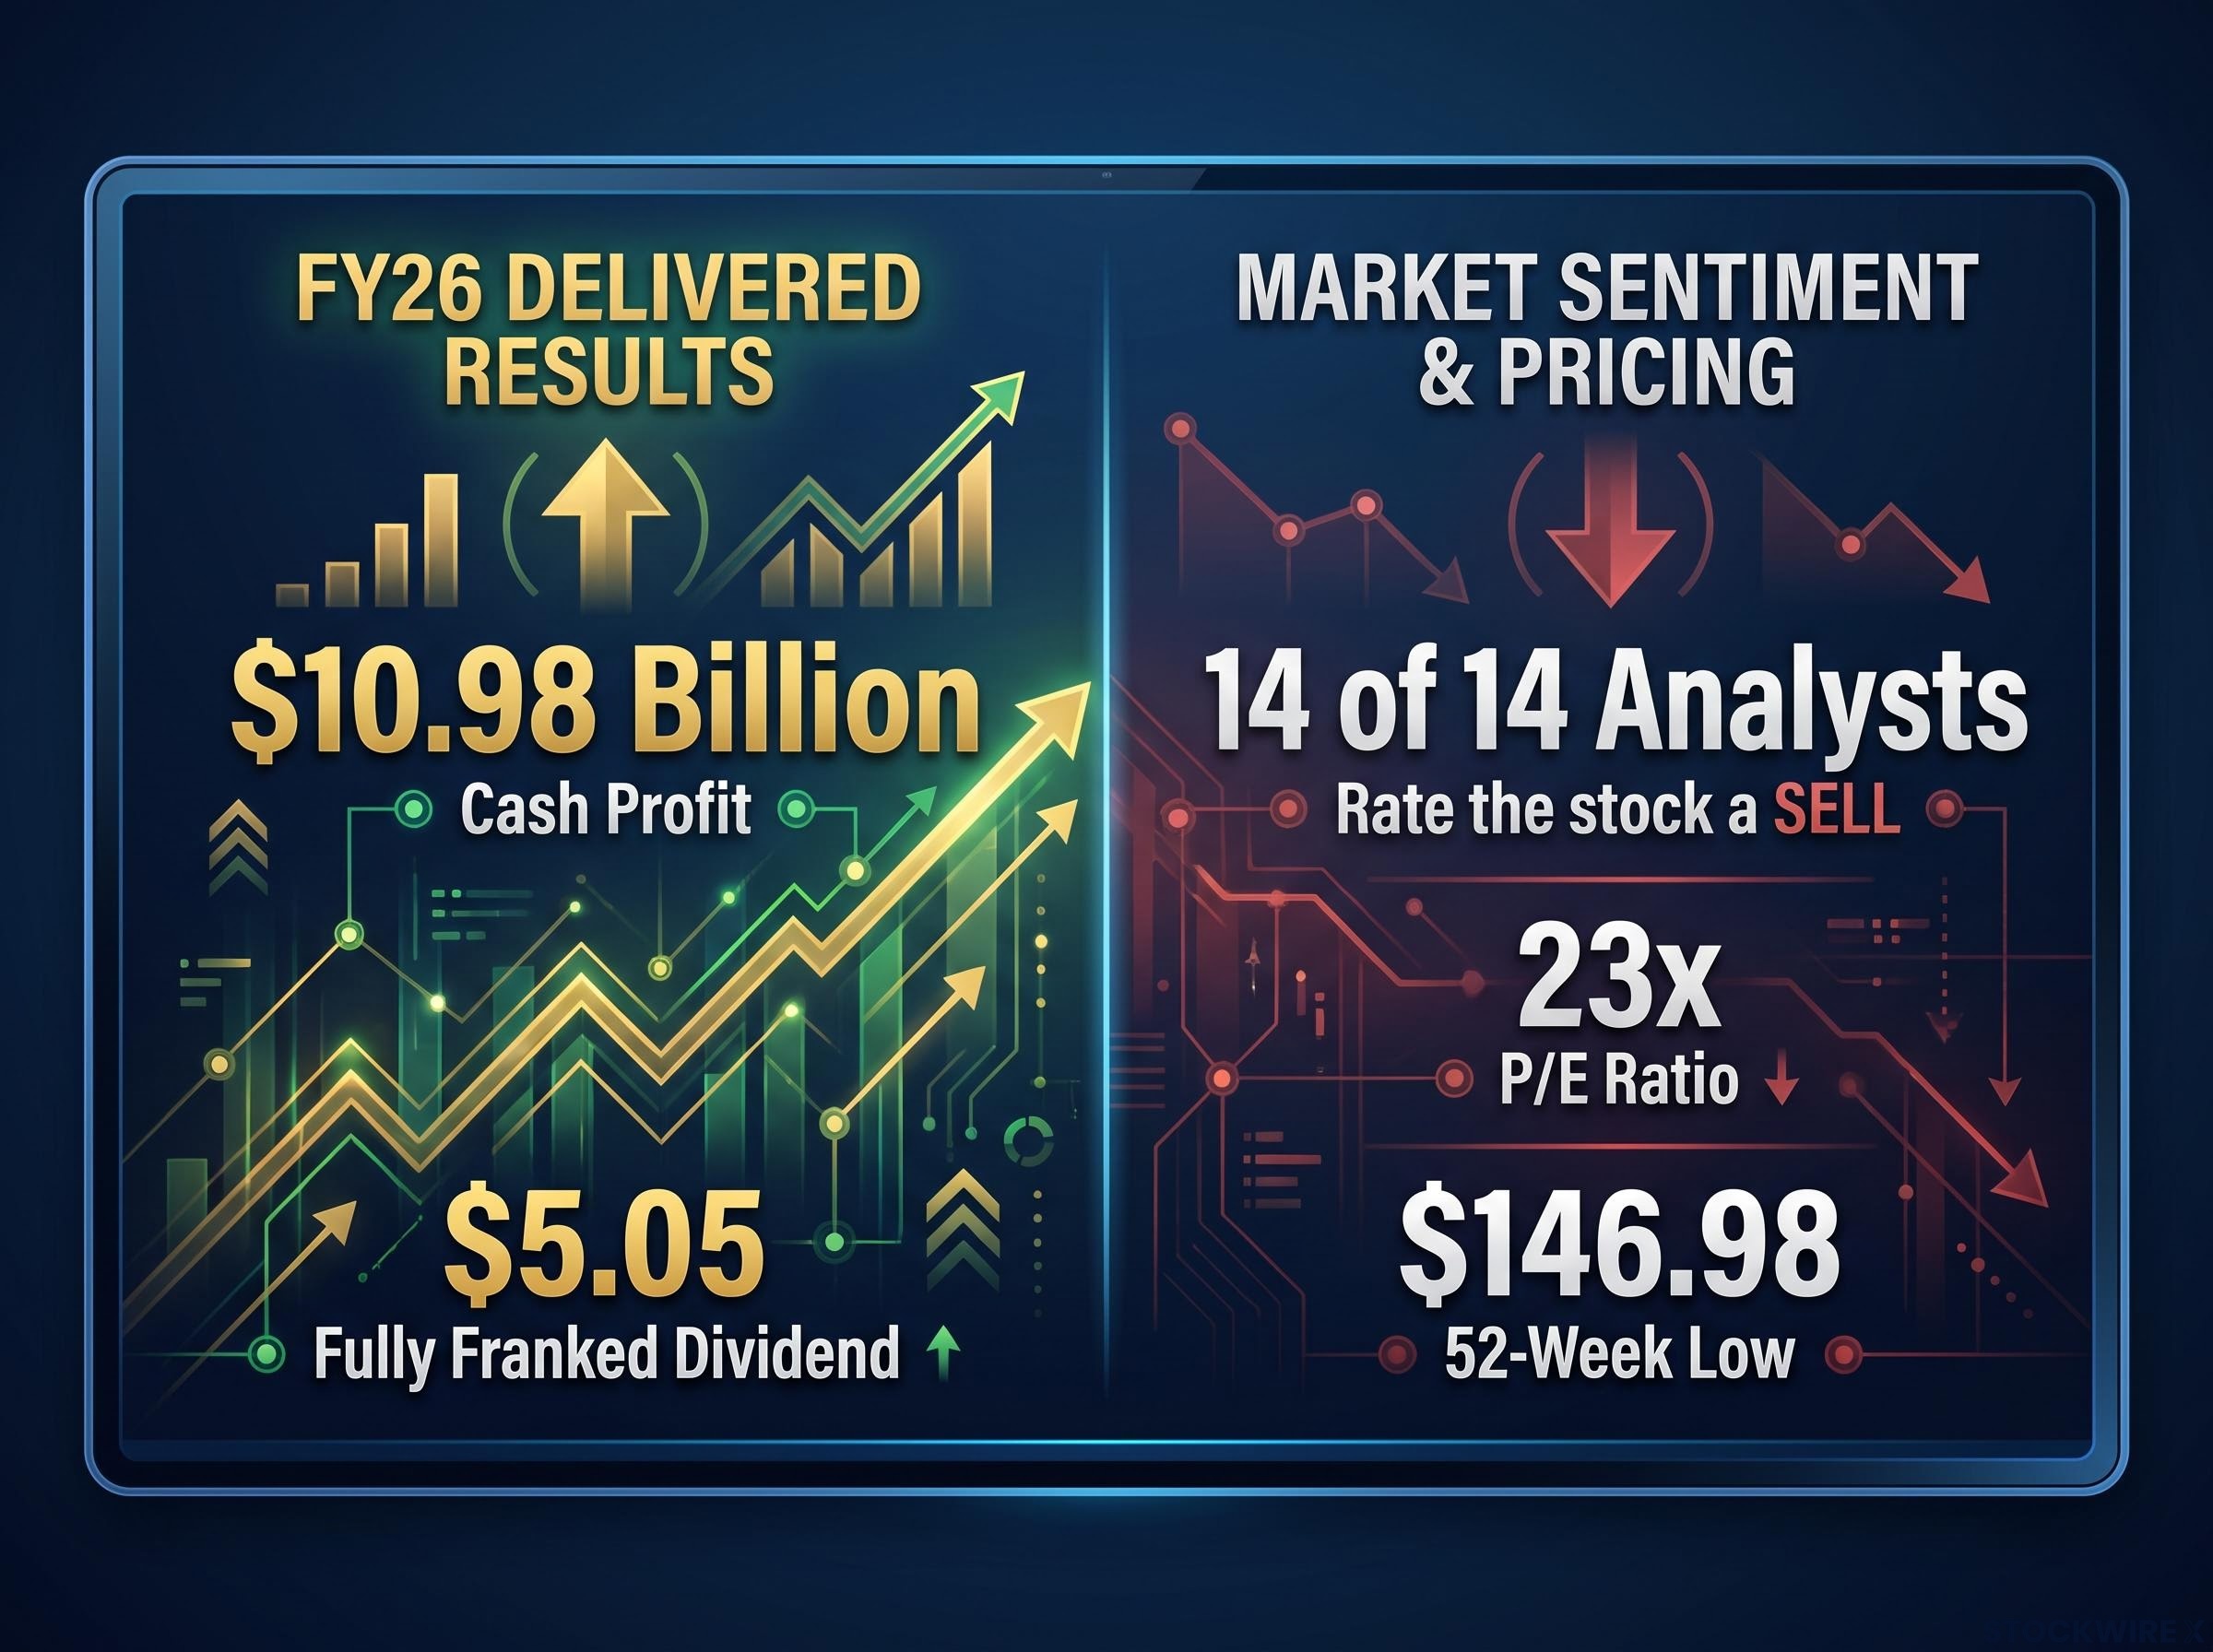
The line the market is now testing is $146.98, the 52-week low. That number matters because it functions as both a psychological anchor and a technical reference point. Traders watch it, algorithms watch it, and a decisive break below it tends to invite more selling rather than less.
A bank posts its largest profit ever, and within weeks its shares trade within 43 cents of their 52-week low. The market is not confused. It is looking somewhere the earnings report cannot.
Here is the read you should take. A record profit is backward-looking evidence. It confirms what CBA earned over the year that just ended. The falling share price is the market repricing what it expects CBA to earn next. The dissonance is not a puzzle to be solved by re-reading the results; it is the market signalling that future earnings, not past ones, are the concern. For anyone holding or watching the stock, the price action is the prompt to investigate, not a reason to react reflexively.
When big ASX news breaks, our subscribers know first
What a 23x earnings multiple actually means in a rising-rate world
The concern shows up first in the valuation. As of late September 2026, CBA traded at a trailing price-to-earnings (P/E) ratio of approximately 23x, down from 25.42x in mid-August before the share price fell. A P/E ratio measures how much investors pay for each dollar of a company’s annual earnings. At 23x, CBA sits at roughly a 34% premium to Australia’s other major banks.
A premium multiple is not automatically a problem. It becomes one when the people who model the earnings closest disagree that it is deserved. And on CBA, that disagreement is total. According to an S&P Global poll from August 2026, all 14 analysts covering the stock rate it a sell. Zero buys. Zero holds.
The ASX bank valuation premium is not unique to CBA: the sector as a whole trades at the most expensive forward P/E in the developed world, with European and UK peers delivering roughly three times the 2026 price return despite starting the year on materially cheaper multiples.
The price targets tell the same story from different polling dates.
| Source | Analysts | Average 12-Month Target | Implied Downside |
|---|---|---|---|
| TipRanks (approx. 24 Sep 2026) | 8 | $123.08 | ~18% |
| Investing.com (21 Sep 2026) | 14 | $125.64 | ~17.9% |
| S&P Global (20-22 Aug 2026) | 14 | ~$125.21 | ~20-22% |
Across every poll, individual targets range from a low of $90 to a high of $144.99. Even the most optimistic sell-side forecast still sits below the prevailing share price. The named analysts carrying sell recommendations include some of the most-followed banking desks in the country:
- Andrew Lyons, Jefferies
- John Storey, UBS
- Richard Wiles, Morgan Stanley
- Ord Minnett
- Jarden
When every analyst who covers a stock rates it a sell, and the price is still around 18% above their average target, you are left with a genuine question. Does the premium reflect a franchise quality the models cannot fully capture, or has retail enthusiasm simply outrun the institutional consensus? The valuation itself cannot answer that. What it can tell you is how much room there is to fall. At 23x, CBA carries limited cushion against a negative earnings revision. If the earnings story softens, a stretched multiple compresses fast, and that is precisely the scenario the next section examines.
Three RBA rate hikes, falling loan applications, and what comes next for CBA’s earnings engine
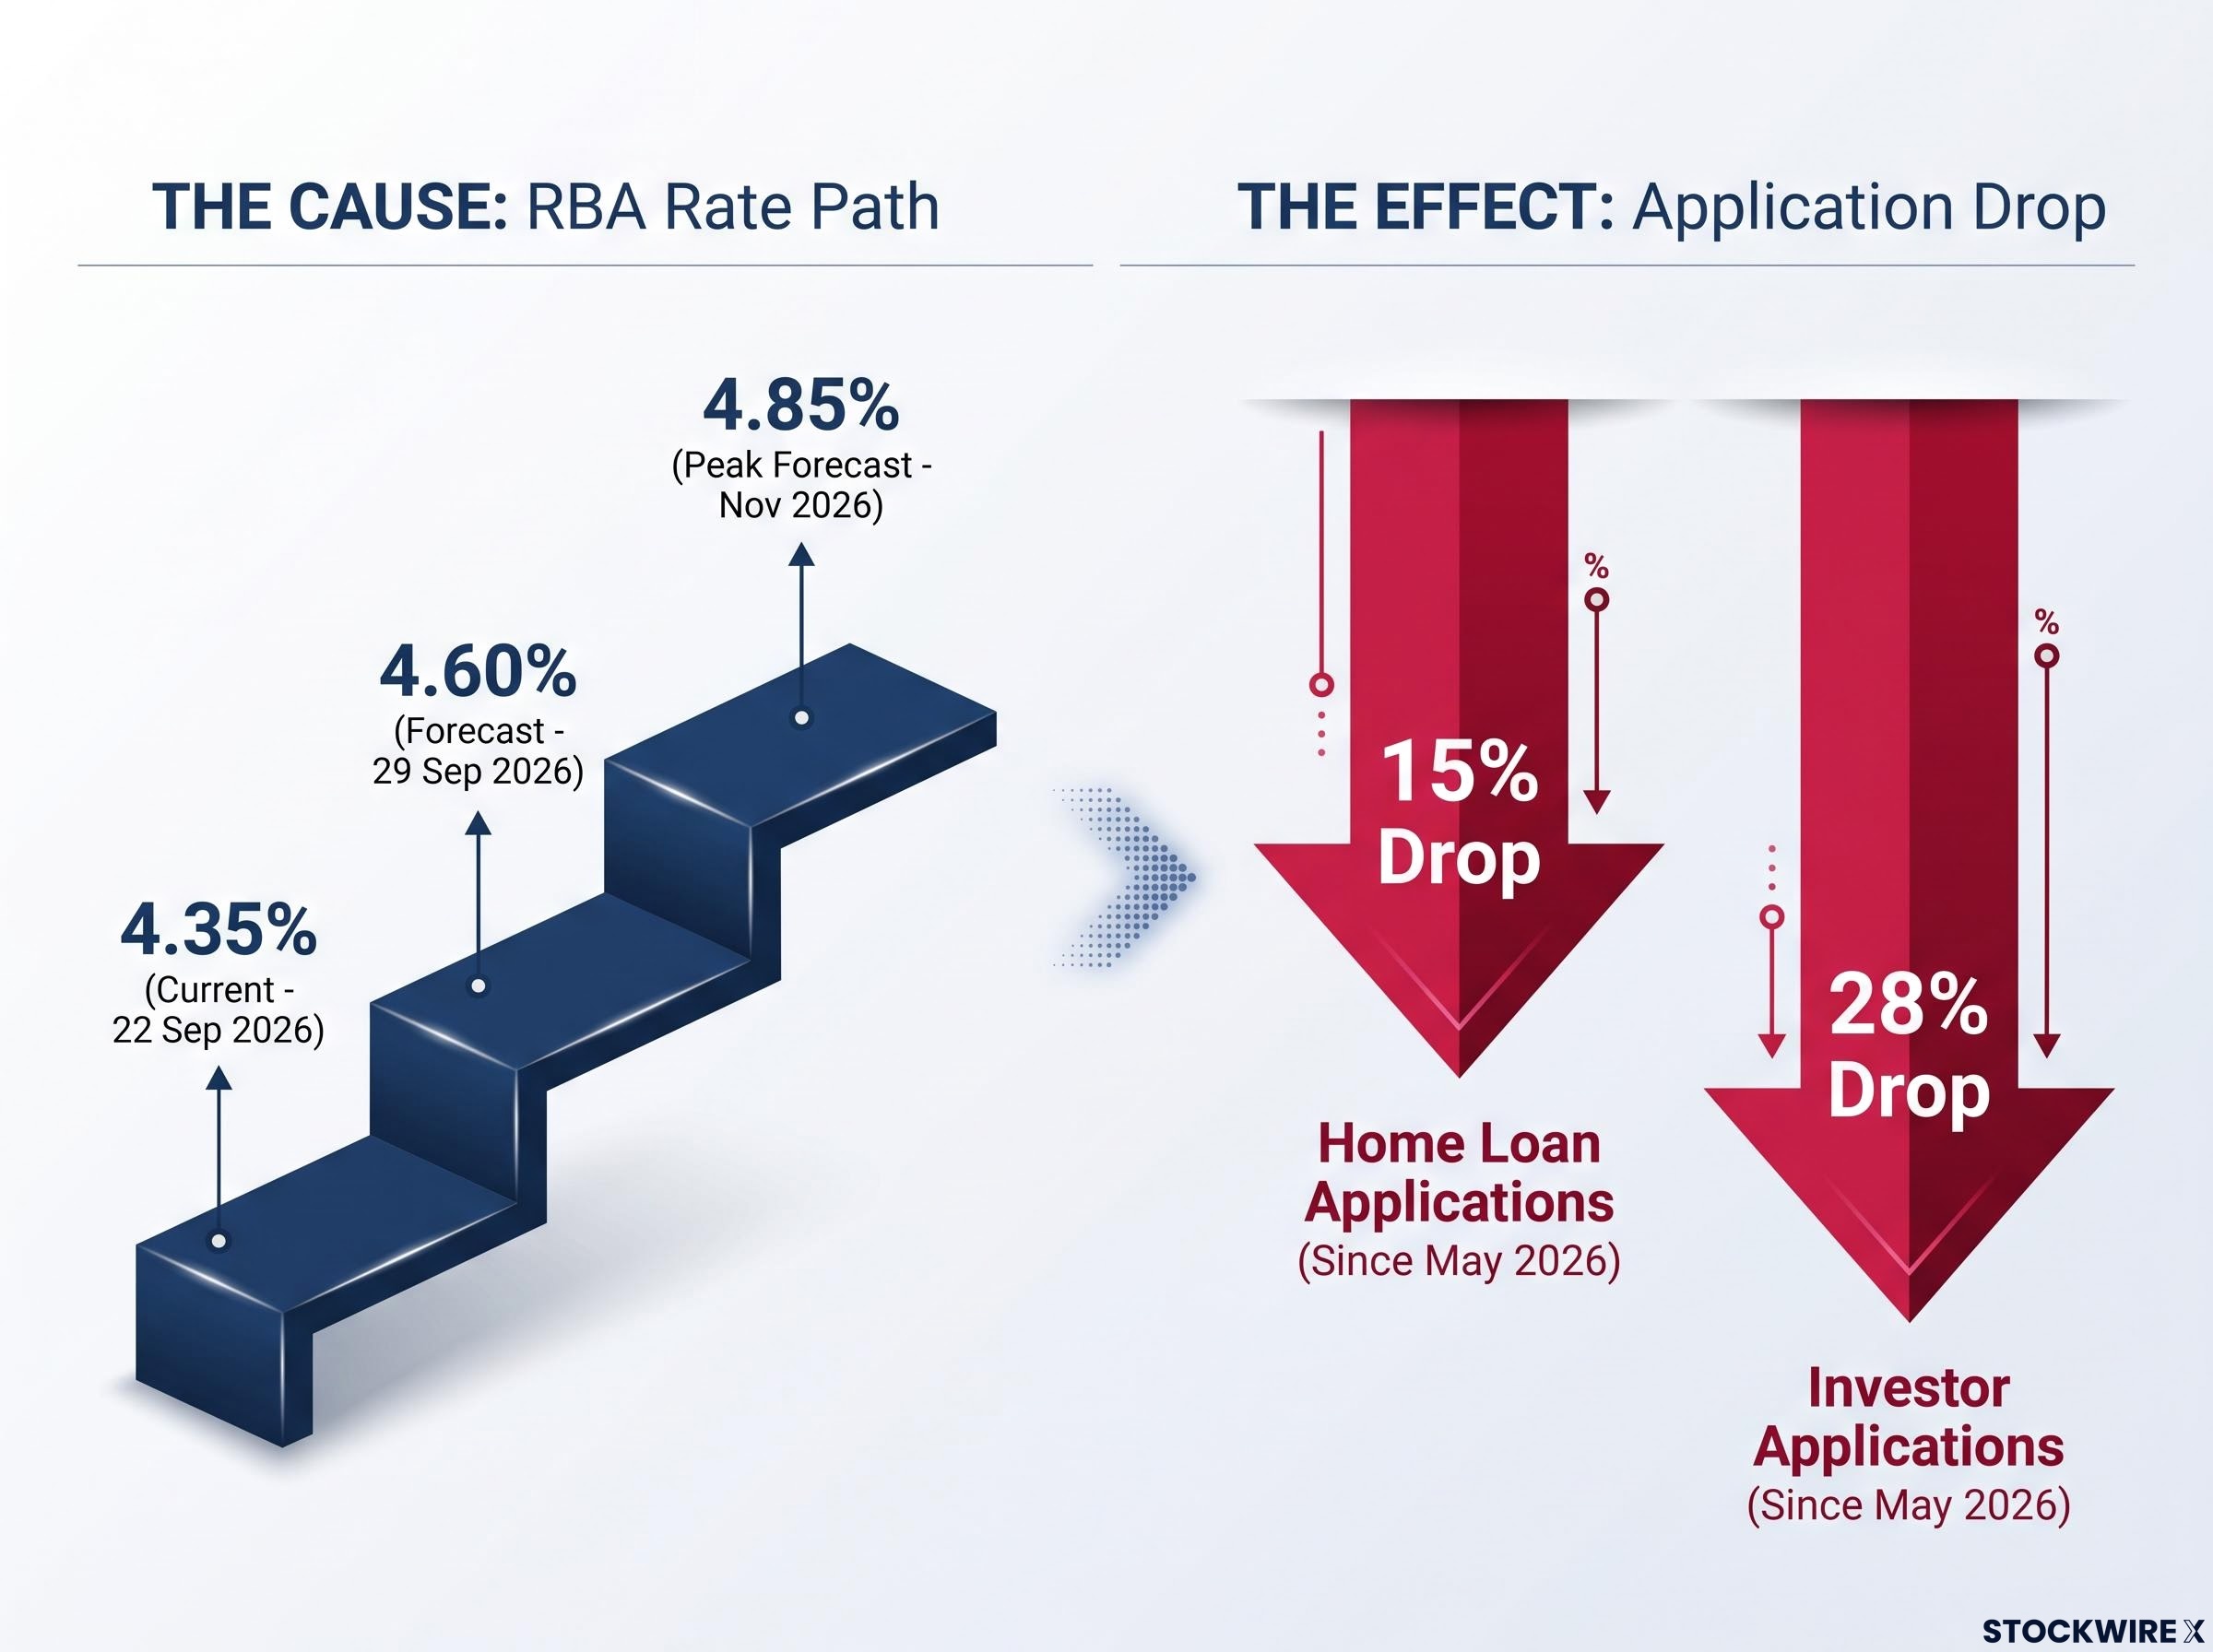
The earnings concern is not abstract. It traces directly to interest rates and the mortgages they price. The Reserve Bank of Australia (RBA) raised the cash rate three times during 2026 to reach 4.35%, confirmed as of 22 September 2026.
More tightening is expected. All four major banks forecast a further 25 basis-point increase to 4.60% at the 29 September 2026 meeting. RBC’s head of economics and rates strategy, Robert Thompson, has forecast an eventual peak near 4.85%, a level ANZ also projects by November 2026.
| Stage | Cash Rate | Timing |
|---|---|---|
| Confirmed current | 4.35% | 22 September 2026 |
| Consensus forecast | 4.60% | 29 September 2026 (pending) |
| Peak forecast | 4.85% | November 2026 (ANZ/RBC view) |
Rate rises reach CBA’s earnings through two channels that pull in opposite directions:
- Net interest margin (NIM) expansion. Rate rises pass through quickly to variable home-loan rates, initially widening the gap between what CBA earns on loans and pays on deposits. This is a short-term positive.
- Volume compression. Higher borrowing costs cool demand for new loans and slow housing-credit growth. This is a medium-term negative that increasingly overwhelms the margin benefit as the cycle matures.
What the application data tells us
CBA’s own FY26 results show the second channel is already biting. Following the May 2026 rate changes, home loan applications fell 15%, and investor loan applications fell a steeper 28%. Monthly housing-credit growth has settled at 0.5% in both July and August 2026, down from the pace that drove FY26 total housing-credit growth of 6.8%.
The forecasts point lower still. CBA guides to FY27 housing-credit growth of 4-5%, while Westpac forecasts 4.7% for 2027, according to Reuters coverage from 10 August 2026.
The RBA rate plateau scenario, in which the cash rate holds at or near its peak through mid-2027 rather than turning quickly, is the credit-volume headwind that most directly pressures CBA’s loan origination pipeline, because borrowers do not return to the market in volume while repayment costs remain elevated for an extended period.
A 28% drop in investor applications is not a soft month. It is a structural narrowing of the loan pipeline that feeds CBA’s earnings, and it will take several quarters to work through to the income statement. That is the crux of what you are evaluating: a headwind that is clearly forming in the origination data but has not yet fully landed in reported profit. The market is pricing the risk before the numbers confirm it.
The case for holding: franchise strength, franking credits, and CBA’s own housing outlook
None of that erases the reasons sophisticated investors keep holding CBA at an elevated multiple. The bull case deserves the same rigour as the bear case, because it rests on real data too.
- Earnings resilience. The $10.98 billion FY26 cash profit and the fully franked $5.05 dividend are not projections. They are delivered results that held up through a tightening cycle.
- Franchise premium. As Australia’s largest mortgage lender with a broad retail deposit base, CBA has historically commanded a valuation premium over peers, and that premium has not eroded simply because analysts disputed it.
- Franking credit value. For eligible Australian investors, the fully franked dividend carries attached tax credits that lift its effective yield.
That last point matters more than the headline number suggests. Franking credits represent company tax CBA has already paid, passed to shareholders to offset their own tax. For a self-managed super fund on a low or zero tax rate, that can materially increase the effective return on the $5.05 dividend beyond its face value. Any honest total-return comparison against lower-yielding alternatives has to factor that in.
Franking credit mechanics determine how much of the $5.05 dividend actually flows to each shareholder after tax, and the outcome varies substantially across investor types: a pension-phase SMSF member converts every credit into a direct ATO cash refund, while an investor on the 45% marginal rate uses the credit as a partial offset against income tax.
Then there is CBA’s own read on the market that drives its earnings. In its 20 August 2026 newsroom note, the bank forecast FY27 housing-credit growth of 4-5%, a more constructive view than some peers.
CBA characterises the current housing market as fundamentally sound and orderly, not distressed, arguing that expected credit growth of 4-5% should continue to underpin earnings over the next 12 months.
If that assessment proves accurate, the severe earnings-deterioration scenario baked into the sell ratings looks too pessimistic. The bull case, put plainly, is that CBA’s franchise can grow credit faster than the market fears even as rates peak, and that the premium the multiple carries is the price of that resilience rather than a mispricing waiting to correct.
What the $146.98 level tells you, and where the decision point sits
So where does that leave the actual decision? The most immediate reference is the chart. $146.98 is the 52-week low, and the 24 September intraday low of $147.41 came within 43 cents of it.
The meaningful signal is a close below $146.98, not an intraday test. Intraday spikes get bought back; a decisive closing break tends to invite further selling. If that happens, $140, roughly 5% below the recent intraday low, is the next plausible support level.
The rate calendar as a near-term catalyst
The 29 September 2026 RBA board meeting is the first live test. If the widely expected hike to 4.60% is delivered, the question becomes whether it is already in the price. Markets often move on the surprise, not the event. If the RBA holds instead, that could offer CBA temporary relief.
The valuation gives you a way to picture what normalisation looks like in numbers. At approximately 23x earnings today, a move toward the analyst consensus target of around $124 would compress the multiple to roughly 19x. That is a concrete reference for the scale of repricing the sell-side is forecasting.
For anyone weighing a position, these are the variables worth watching over the coming weeks:
- The $146.98 support level, and whether it holds on a closing basis
- The outcome of the 29 September RBA decision and the forward rate path it signals
- The $140 secondary support if the 52-week low breaks
- The analyst consensus target range of $123-$125
The $146.98 line is where the two narratives meet. Below it sits the analyst consensus that CBA is overvalued; above it sits the franchise-premium story that has defended this stock for years. The RBA decision is the first near-term test of which one has more traction.
For investors who want to apply a more structured framework to the $146.98 support analysis, our dedicated guide to reading technical levels covers the specific criteria professionals use to validate a support zone before treating it as a trade entry or exit signal, including the multi-factor confirmation logic that separates a meaningful level from a coincidental one.
Weighing the evidence with the 52-week low in focus
The tension does not resolve neatly, and it should not be forced to. CBA’s record $10.98 billion profit and its franked $5.05 dividend are real. So are the unanimous sell ratings, the ~$124 consensus target, and the rate-driven slowdown showing up in loan applications. Both sets of facts can be true at once, and they are.
Three variables will most likely determine whether CBA shares stabilise or keep falling:
- The 29 September RBA decision and the forward rate path it implies
- The trajectory of housing-credit growth through the first half of FY27
- Whether the $146.98 support holds on a closing basis
What that means for you depends on your horizon. A long-term holder faces a different calculation than someone trading the range, and the franking credit advantage shifts the effective yield maths specifically for self-managed super fund holders and other eligible Australian investors. You now hold the inputs a serious investor needs: the earnings, the multiple, the rate path, the technical levels, and both sides of the argument. The next move is a deliberate evaluation, not a reaction to the day’s price.
This article is for informational purposes only and should not be considered financial advice. Investors should conduct their own research and consult with financial professionals before making investment decisions. Past performance does not guarantee future results. Financial projections are subject to market conditions and various risk factors.