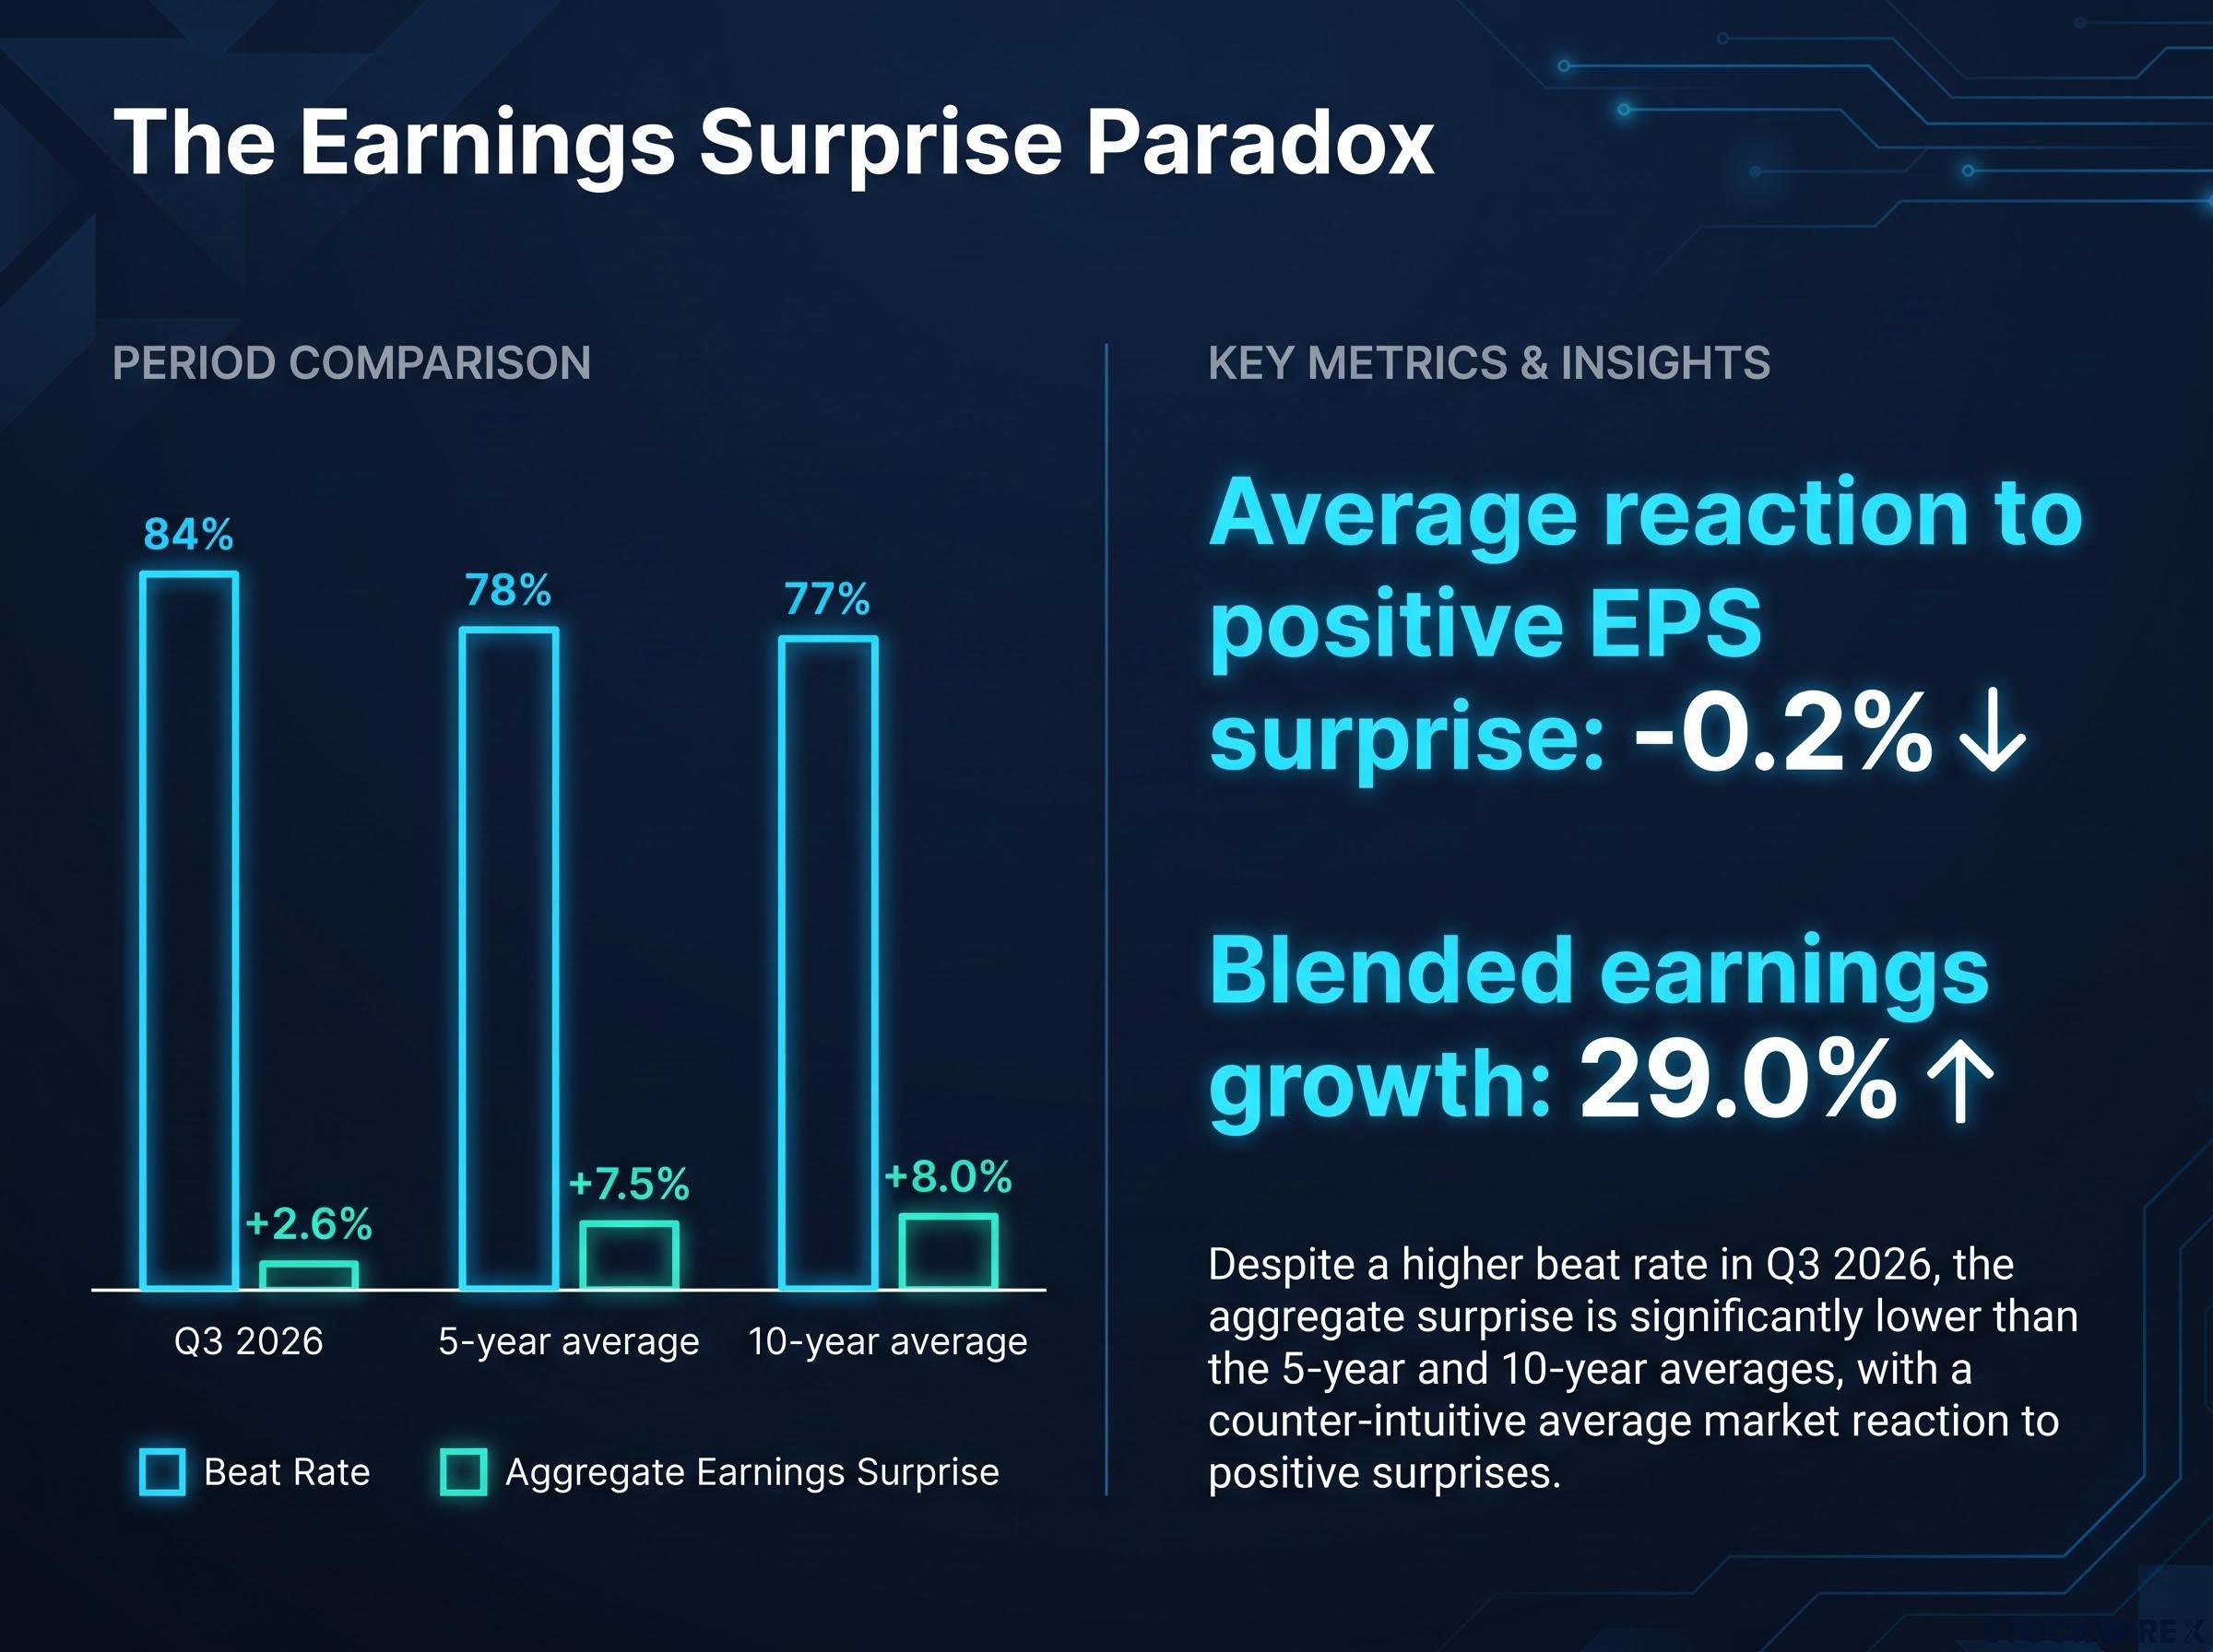
Roughly 84% of S&P 500 companies that have reported third-quarter results are beating earnings estimates. Yet according to FactSet, the average share price reaction to a positive earnings surprise is -0.2%. If you assumed earnings beats and stock reactions move together, this season is showing you otherwise.
The point landed hard on 21 October 2026, when seven large companies reported after the close: Meta Platforms, Tesla, Texas Instruments, SAP, IBM, Kinder Morgan and Lam Research. The reports came about two weeks before the midterm elections, into a market enjoying its third straight day of gains on lower bond yields and calmer volatility.
There is a caveat. FactSet’s reading covers only about 9% of the S&P 500, so this is an early snapshot, not a verdict on the season.
Here is how to read a beat properly: which numbers matter more than headline earnings per share, and what to check before you assume good results mean a rising stock.
Why is an 84% beat rate not lifting stocks?
Start with the headline figure. An 84% beat rate sits comfortably above the five-year average of 78% and the ten-year average of 77%. Blended earnings growth is running at 29.0% year over year.
By that measure, this is a strong season. The share prices have not followed.
Why magnitude matters more than direction
The beat rate only counts how many companies cleared the bar. It says nothing about how far they cleared it, and that margin is where the signal lives.
| Measure | Q3 2026 | 5-year average | 10-year average |
|---|---|---|---|
| Companies beating EPS estimates | 84% | 78% | 77% |
| Aggregate earnings surprise | +2.6% | +7.5% | +8.0% |
The aggregate surprise, which measures by how much companies beat in total, is running at roughly a third of its usual size. More companies are clearing the bar, but only just. The bar was already set high, so clearing it earns very little.
Key statistic: FactSet data shows the average reaction to a positive EPS surprise this season is -0.2%, with the average return from two days before to two days after earnings sitting between -0.5% and 0%.
Bank of America, cited by Investors’ Chronicle, found the same pattern from another angle. Companies beating on both earnings and revenue saw an average next-day move of 3.4%, down from 5.3% in the prior quarter.
The problem is not companies failing to beat. It is the size of the beats. A high beat rate with a thin margin tells you the market is getting confirmation of what it expected, not news, so a “beat” headline on its own should not be read as a buy signal.
How early is this sample?
Very early. With only about 9% of the index reported, the pattern could shift as banks, mega-cap tech and cyclicals report. The negative-surprise group is smaller still, around seven companies averaging roughly -2.2%, too few to draw anything meaningful from.
If the 9% sample feels thin, it helps to know how earnings season works: reporting is staggered over several weeks, so early readings come from a small and unrepresentative slice of the index.
When big ASX news breaks, our subscribers know first
How does “priced in” turn a beat into a shrug?
If thin margins explain the season, “priced in” explains the individual stocks. A share price reflects what investors expect, not just what has happened. When results arrive, the price only moves on the difference between the outcome and those expectations.
Published consensus, the average of analyst forecasts, is often conservative. Many investors carry a higher unofficial target, known as a whisper number. A company can beat consensus and still fall short of the whisper.
Saxo Bank’s Q3 preview on 5 October 2026 named the key risk directly: beating current-quarter earnings without raising future estimates or guidance. Guidance is a company’s own forecast for upcoming periods. A small beat can still produce a fall when:
- Published consensus was set conservatively
- Investors were already positioned for a beat
- The price reflected a higher whisper expectation
- Guidance, margins, backlog or next-quarter revenue mattered more than the EPS difference
The after-hours figures below come from multiple sources that often disagree, so treat any single number with caution.
| Company | EPS result vs estimate | Revenue vs estimate | After-hours reaction |
|---|---|---|---|
| Lam Research | $2.20, minor beat | $8.22B | Down about 6% |
| Tesla | $0.48 adjusted vs about $0.44-$0.45 | $28.05B, in line or slightly below | Conflicting: about -2% to +1.7% |
| IBM | $2.95 adjusted vs about $2.86-$2.88 | $17.10B vs about $16.8B | Conflicting: gains and declines reported |
| Texas Instruments | $2.62 vs $2.40 | About $6.1B, up 28% | Higher |
| Kinder Morgan | $0.35 adjusted vs $0.32-$0.33 | $4.53B vs $4.37B | Up modestly; magnitude varies by source |
Where the beats did get rewarded
Texas Instruments delivered a clear EPS beat alongside 28% revenue growth, and its shares rose. SAP grew revenue about 13% to €10.27 billion, and its ADRs (US-traded certificates representing foreign shares) moved higher. Both paired a beat with strong top-line growth.
Where they did not
Lam Research posted a minor beat and guided to about $8.6 billion next quarter, plus or minus $400 million. The stock still fell roughly 6% to about $245, though that stayed within the options-implied expected move, with a floor near $237.5. Tesla’s EPS beat came with flat-to-soft revenue, and IBM’s double beat drew mixed reports. When a stock falls on a beat, it is usually telling you the market wanted a better outlook, so check guidance and revenue before judging the quarter.
What does Meta’s miss reveal about GAAP versus adjusted EPS?
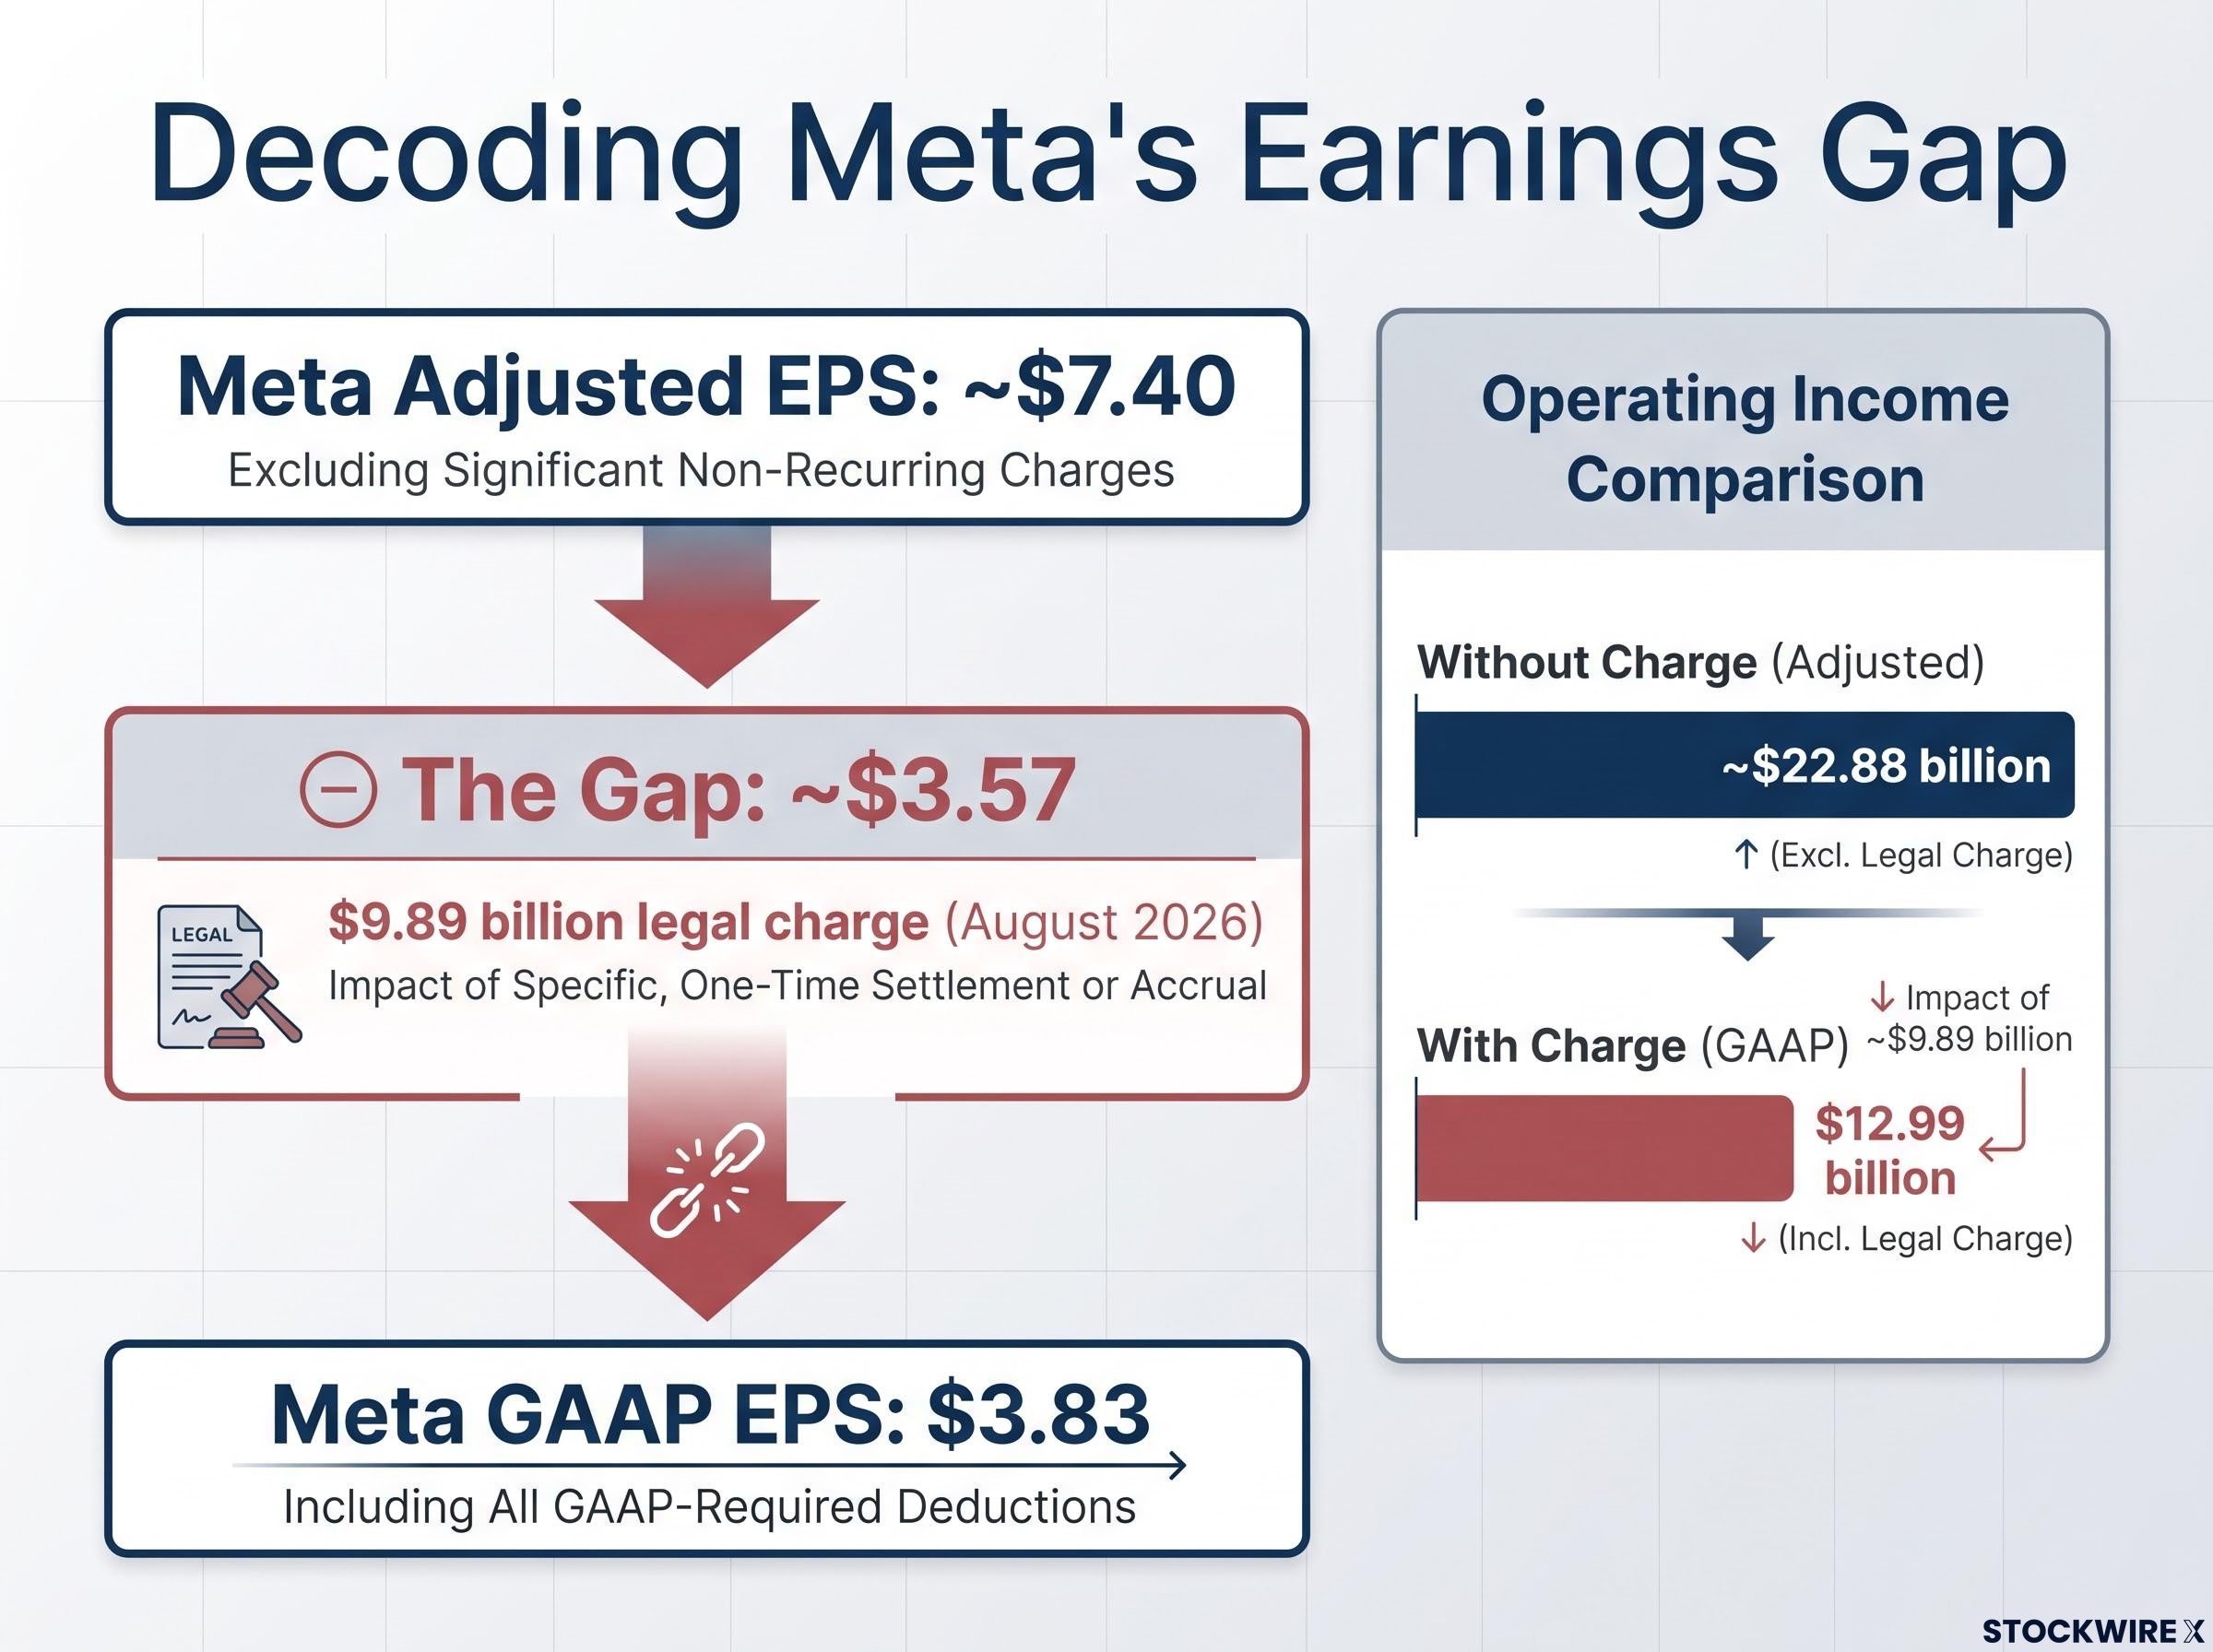
On paper, Meta missed badly. GAAP diluted EPS came in at $3.83, against consensus of roughly $5.46-$5.90. Yet revenue grew 26% to $64.60 billion, ahead of the roughly $63.3-$63.4 billion expected.
Both things are true. Which one matters depends on the line you read.
GAAP EPS follows Generally Accepted Accounting Principles, the standard US reporting rules, and includes every cost. Adjusted (non-GAAP) EPS removes items management considers unusual. Companies report both so you can see the full result and their view of the ongoing business.
| Company | GAAP EPS | Adjusted EPS | Gap | What was excluded |
|---|---|---|---|---|
| Meta | $3.83 | About $7.40 | About $3.57 | $9.89B legal charge and related tax effects |
| IBM | About $2.30-$2.31 | $2.95 | About $0.64-$0.65 | Acquisition-related items |
Why excluding the charge is defensible
Meta’s $9.89 billion charge stems from an August 2026 agreement with US state attorneys general over teen mental health and social media litigation. It is large and plausibly one-off. Strip it out and operating income rises from $12.99 billion (down 37%) to about $22.88 billion.
Why it is still a real cost
That money still leaves the company, and it flows from Meta’s own business and regulatory exposure. Meta’s after-hours direction was conflicting across sources, roughly -1.0% in one account and gains in another, a sign investors were weighing both readings. IBM’s smaller gap shows the same tension in milder form.
A widening spread between adjusted and GAAP EPS over consecutive quarters signals growing reliance on exclusions, so a single large gap like Meta’s matters less than whether the gap keeps recurring.
Definitions also vary. SAP reports non-IFRS EPS of €1.89 under international rules, so adjusted figures are not always comparable across companies. Before accepting any adjusted number:
- Identify what was excluded
- Ask whether it recurs in practice
- Check whether it is a cash cost
- Measure how large the gap is
The gap tells you what management wants you to look past. Ask whether the cost is truly one-off before trusting the adjusted figure.
Can early reporting and one strong quarter flatter the picture?
One more wrinkle surfaced on the night. Jim Carson of Kai Volatility observed that Meta, SpaceX and Tesla moved their reporting dates forward by about one to two weeks and delivered strong results. He noted these leaders are close to the administration and linked this to Mark Zuckerberg’s earlier $600 billion capex pledge, but he drew no firm conclusions and said the beats did not surprise him.
A commentator’s caution: Carson suggested that a single quarter’s numbers can look better in the short term when a company is not worried about the quarter that follows.
What the early-reporting claim does and does not show
Coverage confirms Meta and Tesla reported in the week of 19 October. The one-to-two-week figure, however, comes only from Carson’s remarks; no company-by-company data has independently confirmed how much earlier they reported than in prior years. No well-documented comparable season was found either.
The more durable point is simpler. A headline quarter and a genuine trend can look identical.
| View | Evidence | Interpretation |
|---|---|---|
| Bullish | 84% beat rate; 29.0% growth; SAP cloud strength; IBM software growth | Growth is intact; the bar is simply high |
| Sceptical | Only a +2.6% aggregate surprise; guidance is the real test | Beats are technically positive but unimpressive |
| Caveat | About 9% of the index reported | The pattern could change |
None of these views wins yet. Wait for guidance, and for banks, mega-cap tech and cyclicals to report, before drawing conclusions about the season.
What to weigh before trusting the next earnings headline
Carry four questions into the rest of the season:
- Size: Was the beat large, or barely over the line?
- Guidance: Did the outlook improve?
- Revenue quality: Did sales grow alongside earnings?
- GAAP gap: What did the adjusted figure leave out?
The open question is whether thin surprises and flat reactions hold as the remaining 91% of the index reports. The after-hours figures cited here were conflicting at the time of writing and may settle differently once regular trading resumes.
For readers wanting a fuller process than four questions, our detailed coverage of the seven-step earnings report checklist adds free cash flow alignment and multi-quarter consistency tests.
This article is for informational purposes only and should not be considered financial advice. Investors should conduct their own research and consult with financial professionals before making investment decisions. Past performance does not guarantee future results.