
How Many Westpac Shares You Need for $10,000 in Income
2 hrs ago

Most retail investors check whether a company beat earnings per share estimates, then move on. That single data point reveals almost nothing about whether the business is actually healthy. Earnings releases are simultaneously financial disclosures and carefully managed narratives. Companies lead with favourable metrics, bury weaker data, and present adjusted figures that no auditor has approved. The structure of these documents is not neutral, and investors who read them at face value are reading them exactly the way the investor relations team intended. What follows is a step-by-step framework for analysing earnings reports with precision: where to look, what to cross-reference, which disappearances to flag, and how to build a repeatable process that works across any company or sector.
The consensus EPS figure most investors track is a non-GAAP, analyst-constructed number. It is not a standardised accounting output. It is an average of estimates from sell-side analysts who each apply their own adjustments, and it shifts throughout the quarter as those analysts revise their models. A “beat” against this moving target can reflect genuine outperformance, or it can reflect analysts quietly cutting their estimates in the weeks before the report so the company clears a lower bar.
The consensus EPS figure most investors track is a non-GAAP, analyst-constructed number, and its limitations only become fully visible when you understand the broader earnings season mechanics: the sequencing of reporting windows, how beat rates are calculated across the index, and why a stock priced for perfection can fall even on a genuine beat.
A company can beat non-GAAP EPS while simultaneously missing GAAP EPS by a material margin. Both facts appear in the same release. FactSet’s Earnings Insight reports (available at insight.factset.com) track current-season beat rates and blended EPS growth by sector; consulting the latest edition provides a real-time picture rather than a static historical figure.
Three reasons a beat can be misleading:
The GAAP delta: Track the spread between non-GAAP EPS and GAAP EPS each quarter. When this gap widens over consecutive periods, the company is increasing its reliance on exclusions to maintain its adjusted earnings trajectory. A widening GAAP delta is a named, trackable signal worth monitoring for every company on a watchlist.
The useful question is not whether a company beat. It is: beat relative to what, and by whose maths?
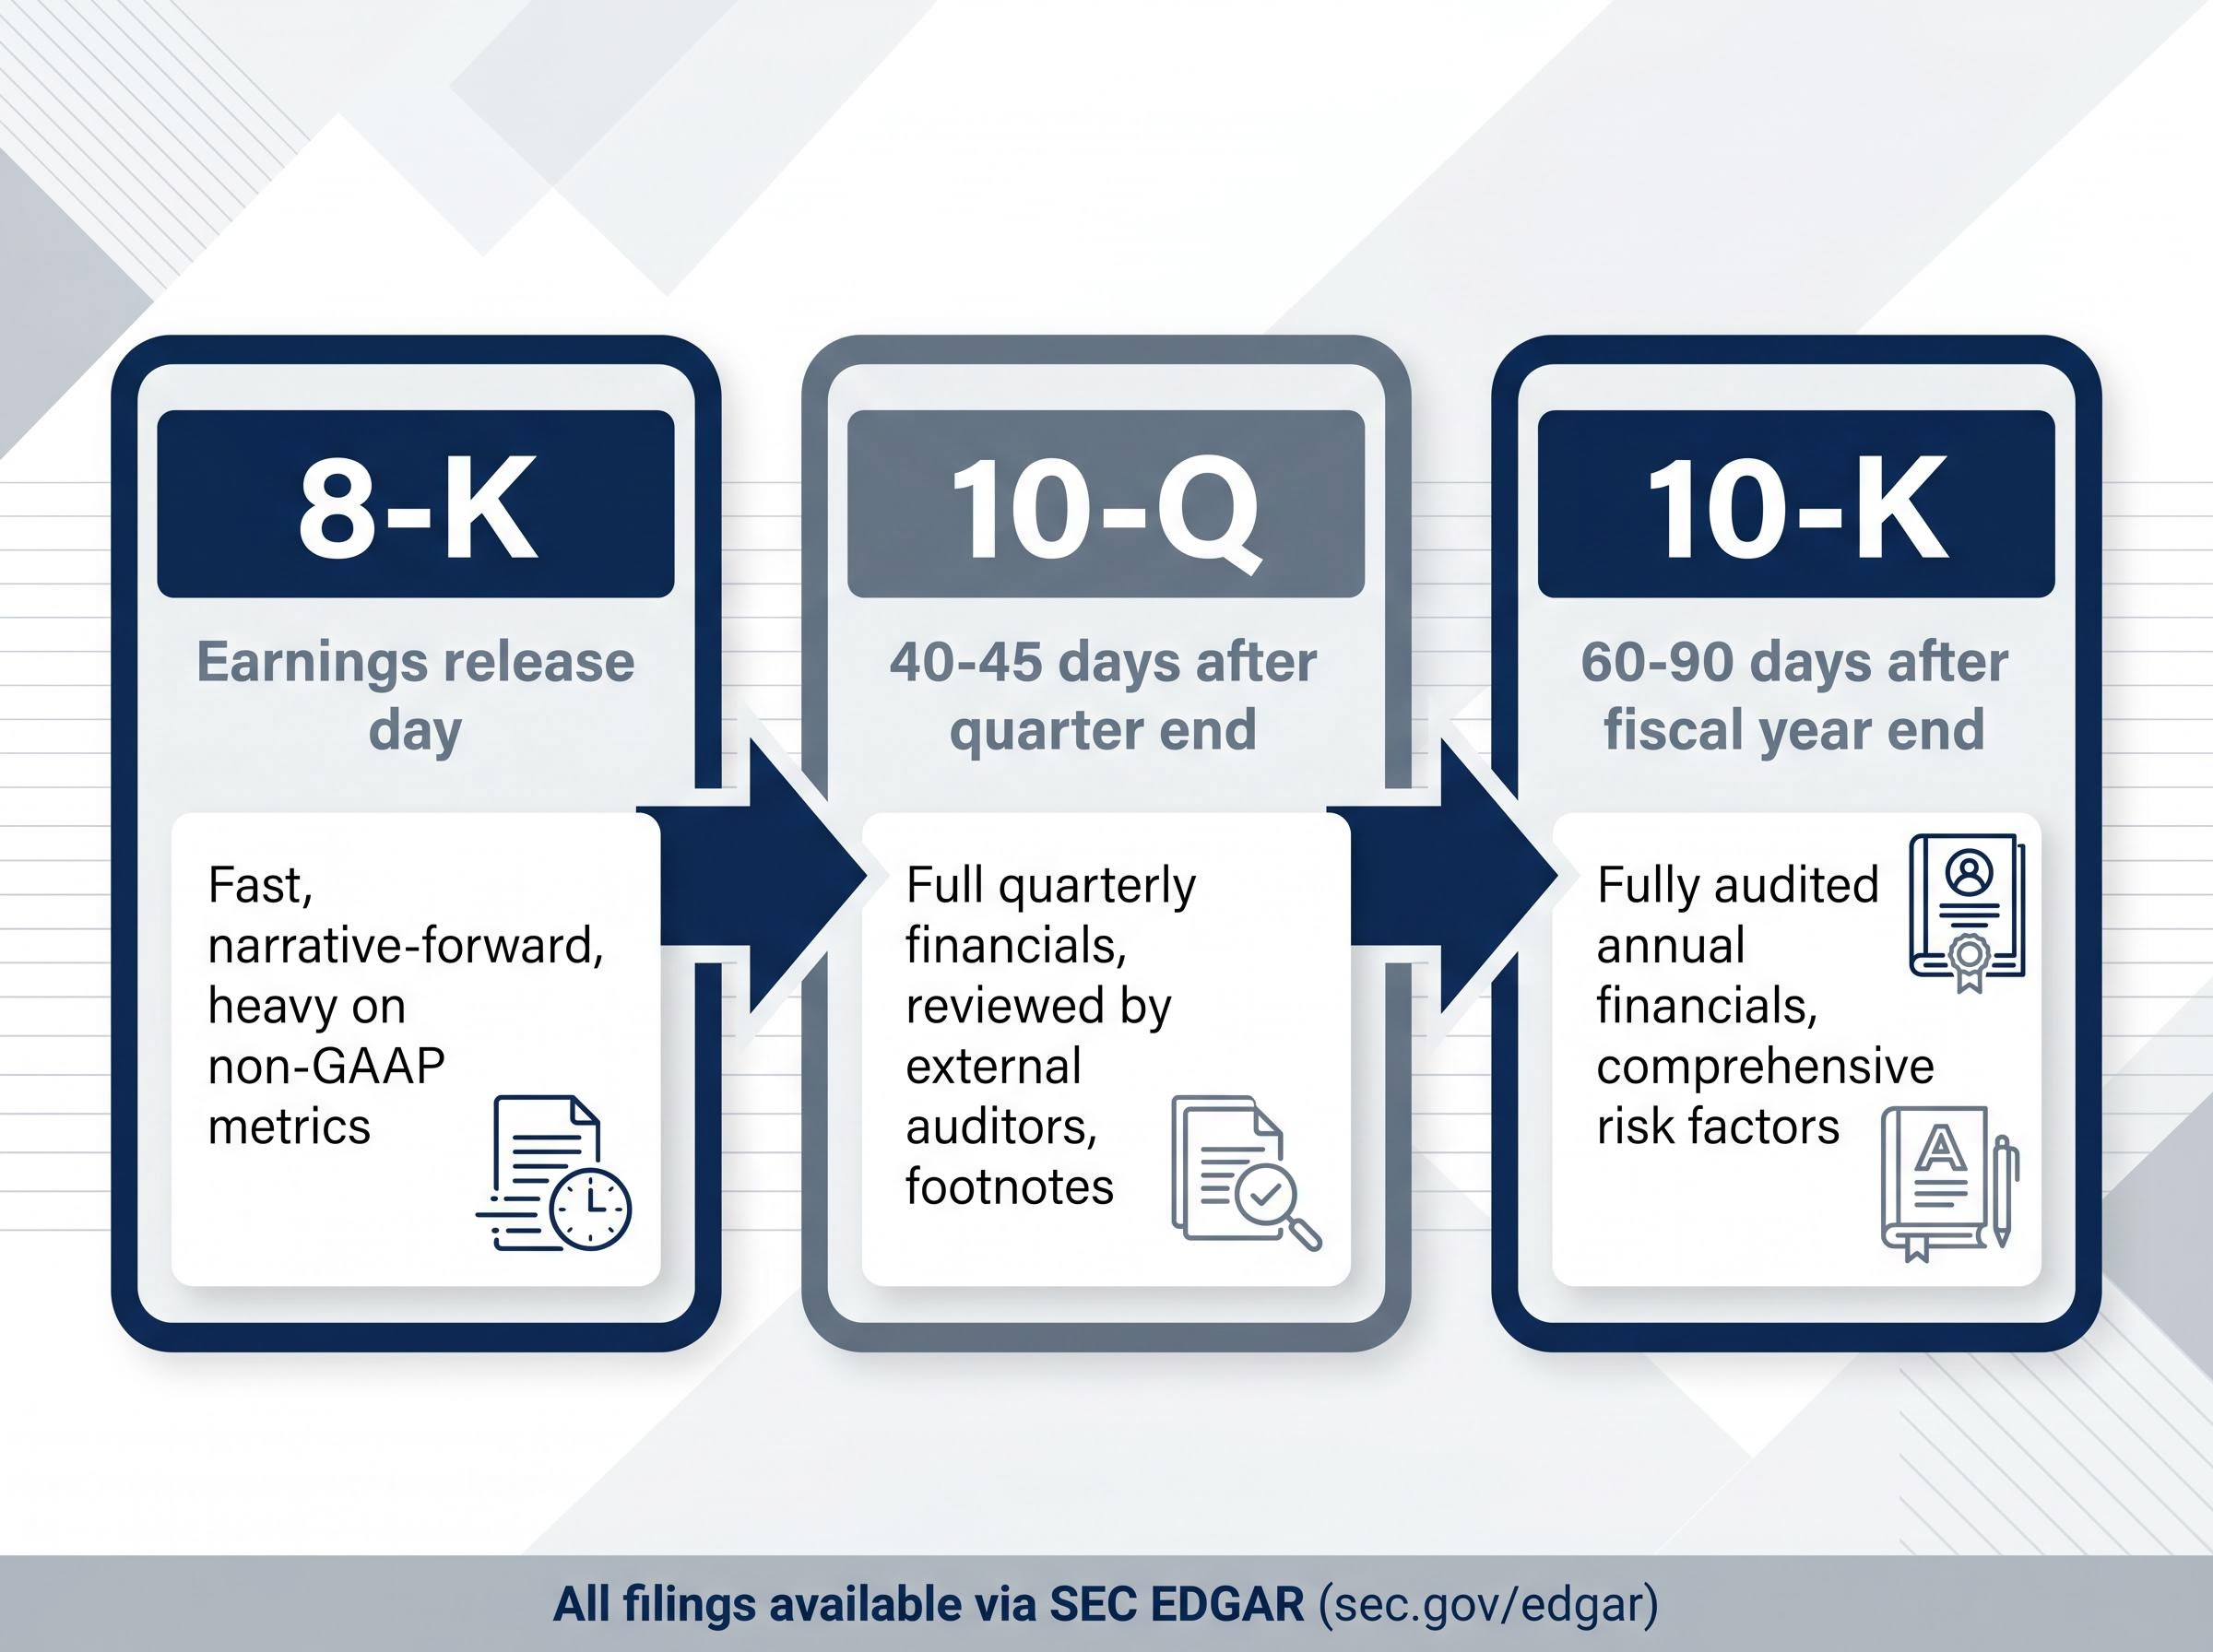
Not all earnings documents carry the same weight. The three filings that matter form a progression from least to most reliable, and understanding that hierarchy changes where an investor spends their time.
The 8-K arrives first. It is the earnings press release, filed the day results are announced. It is fast, narrative-forward, and heavy on non-GAAP metrics. The headline figures that move after-hours trading come from this document. The first place to look inside it is not the summary paragraph; it is the non-GAAP reconciliation table, which shows exactly which costs the company stripped out to arrive at its adjusted number.
The 10-Q follows within 40-45 days of quarter end for most companies. It contains full quarterly financial statements reviewed by external auditors, Management Discussion and Analysis (MD&A), and footnotes. Those footnotes are where accounting policy changes, revenue recognition shifts, and segment redefinitions are disclosed, often without management drawing attention to them in commentary.
The 10-K arrives within 60-90 days of fiscal year end. It is fully audited, contains comprehensive risk factors, and provides the most detailed accounting policy disclosures of any filing. It is the annual anchor for any company-level analysis.
For investors who rely on quarterly 10-Q filings as the structured anchor for this framework, our full explainer on the SEC quarterly reporting proposal covers what a shift to semiannual reporting would mean for information timing, insider trading risk, and the practical implications for retail investors who currently rely on the 40-45 day disclosure cadence.
| Filing Type | When Filed | What It Contains | What to Look For |
|---|---|---|---|
| 8-K | Earnings release day | Press release, headline figures, non-GAAP metrics | Non-GAAP reconciliation table, metric omissions vs. prior quarter |
| 10-Q | 40-45 days after quarter end | Full quarterly financials (reviewed), MD&A, footnotes | Cash flow cross-reference, accounting policy changes, segment disclosures |
| 10-K | 60-90 days after fiscal year end | Fully audited annual financials, risk factors, detailed policies | Year-over-year risk factor changes, full-year accounting policy disclosures |
All three filing types are freely available through SEC EDGAR (sec.gov/edgar), which also serves a less well-known investigative function.
When SEC staff identifies a concern with a company’s non-GAAP presentation, they issue a comment letter. The company’s response is publicly searchable on EDGAR. To find them, search the company name and filter by “comment letters” in the filing search.
Receiving a non-GAAP comment letter is not an enforcement action. It is, however, a documented signal that the SEC has questioned a company’s presentation choices. For investors analysing a company’s adjusted figures, that context matters.
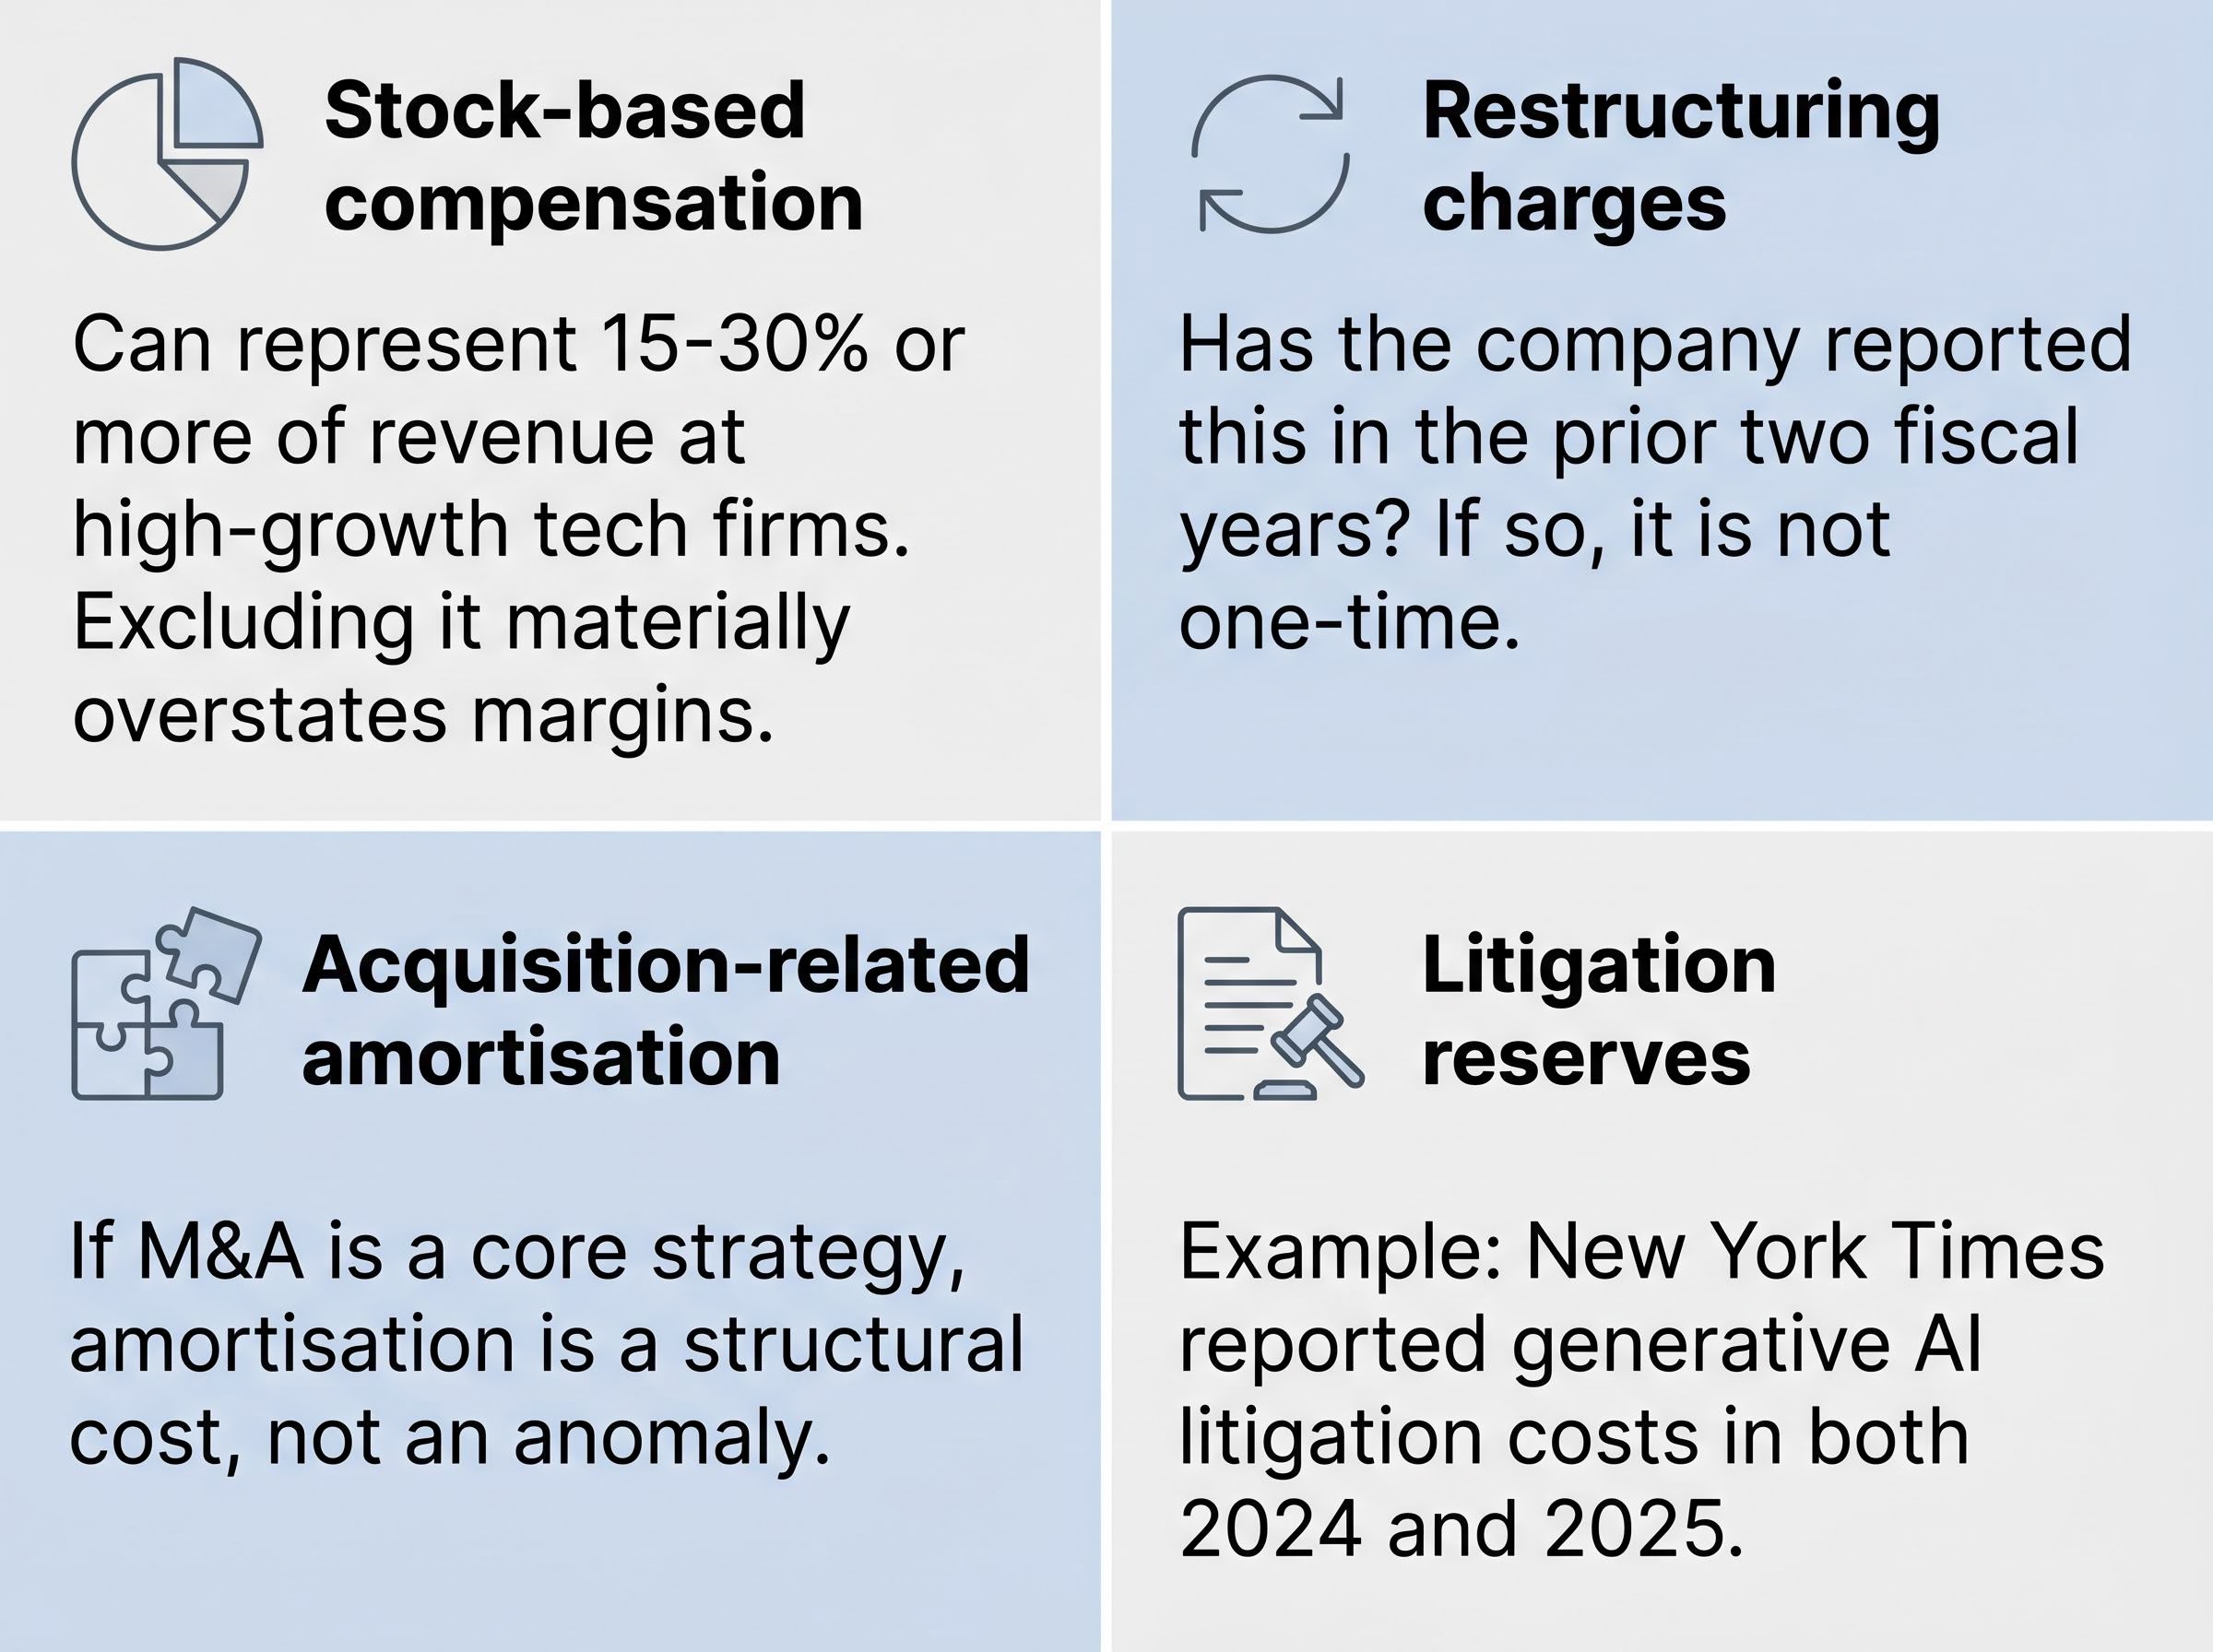
Four categories of costs account for the majority of non-GAAP exclusions. Recognising them on sight turns a reconciliation table from an opaque spreadsheet into a readable diagnostic.
| Excluded Item | Stated Justification | What to Actually Ask |
|---|---|---|
| Stock-based compensation | “Non-cash expense, does not reflect operating performance” | Does this cost dilute shareholders? At high-growth tech firms, SBC can represent 15-30% or more of revenue. Excluding it materially overstates margins. |
| Restructuring charges | “One-time cost related to organisational realignment” | Has this company reported a restructuring charge in the prior two fiscal years? If so, it is not one-time by any reasonable standard. |
| Acquisition-related amortisation | “Non-cash amortisation of intangibles from prior M&A” | Is the company an active acquirer? If M&A is a core strategy, amortisation from those deals is a structural cost, not an anomaly. |
| Litigation reserves | “Non-operational legal expense” | Does the company face ongoing or recurring legal exposure? Litigation costs that appear across multiple years are operating costs in practice. |
The SEC’s two-year lookback standard: SEC rules prohibit labelling a charge as non-recurring if a comparable item appeared in either of the two prior fiscal years, or is reasonably expected to recur within the following two fiscal years. This is the regulatory test investors can apply to any “one-time” exclusion they encounter.
The SEC non-GAAP compliance interpretations published by the Division of Corporation Finance define a recurring expense as any cost that occurs repeatedly or occasionally, including at irregular intervals, establishing the precise regulatory standard investors can apply when evaluating a company’s exclusion choices.
The New York Times provides a real-world example. The company reported generative AI litigation costs as separately identified items in both fiscal year 2024 and fiscal year 2025 annual releases, illustrating exactly the kind of recurring charge the SEC’s non-recurring rules are designed to address.
The most direct check on whether reported earnings are backed by actual cash sits in the cash flow statement. Free cash flow equals operating cash flow minus capital expenditures. Some companies compute “adjusted FCF” in ways that diverge from this standard formula. When net income consistently exceeds operating cash flow over multiple quarters, that sustained divergence may indicate aggressive revenue recognition or accounts receivable buildup. The income statement tells investors what a company earned on paper; the cash flow statement tells them what arrived in the bank.
Accounts receivable trends that diverge from revenue growth across multiple quarters are one of the earliest signals of revenue recognition pressure, often appearing in the balance sheet before the income statement or cash flow statement reflects the underlying deterioration.
Companies have discretion over which operational metrics they highlight. That discretion becomes informative when a metric that was previously featured quietly loses prominence before it shows up as a formal miss.
CrowdStrike excluded approximately $150 million in stock-based compensation from its non-GAAP figures while its Annual Recurring Revenue (ARR) growth decelerated. The ARR slowdown was not prominently flagged in forward guidance. A subsequent disclosure related to a major service outage triggered a roughly 20% stock decline.
Tesla offers a parallel pattern. “Automotive Regulatory Credit Revenue” received reduced emphasis in earnings commentary as the business faced headwinds through 2024-2025. The metric did not vanish entirely, but its de-emphasis preceded a period of deteriorating results.
The sequence to watch for:
Metrics most commonly subject to de-emphasis include:
This is arguably the highest-return investigative habit a retail investor can develop, because it captures information that headline watchers systematically miss until it is priced in.
Record, for each company followed: every metric reported, the specific figure, and the quarter. A spreadsheet or simple note document is sufficient.
Each quarter, compare the current metric list against prior quarters. The comparison is not just about whether the figures improved or declined; it is about whether every metric that was present last quarter is still present this quarter.
When a company stops reporting a metric without explanation, that absence warrants either a direct question in the earnings call Q&A or, at minimum, heightened scrutiny of the related business line.
An earnings call has two structurally different halves. The prepared remarks are pre-vetted, legally reviewed, and strategically constructed. The Q&A section is less controlled.
The prepared remarks vs. Q&A framework: Treat the prepared remarks as the company’s chosen narrative. Treat the Q&A as the test of that narrative. Information that appears only in the Q&A, or information the prepared remarks avoided, is where unscripted signals emerge.
Transcript keyword searching converts a passive listening exercise into an active investigative tool. Search consecutive quarterly transcripts for terms such as:
When the frequency of hedging language increases across quarters, that trajectory carries information regardless of whether the headline numbers have deteriorated yet. Research published by Ning, Zhang, Mi, Yang, and Tao in Accounting Forum (vol. 49, no. 4, May 2024) documents that executives anticipating weaker results adopt measurably more subdued or hedged language.
FinChat.io provides searchable earnings transcripts at no cost, giving retail investors access to the same qualitative signals that professional analysts extract from these calls.
Watch also for evasive or unusually brief executive responses to analyst questions, and for the same question appearing across multiple analysts on the same call. When several analysts independently push on the same point, the market’s information gap on that topic is likely meaningful.
Management guidance tends to become less specific as business visibility decreases. The progression runs from specific numeric targets, to ranges, to qualitative commentary. Compare the specificity of current guidance against prior quarters for the same company, not just the direction of the numbers.
Unusually wide guidance ranges, or guidance accompanied by a significant increase in hedging language, warrant the same scrutiny as an outright miss.
Principles are useful. A sequenced process is better. The following five steps map to the natural timing of earnings materials, from the day before a report through the weeks that follow.
| Step | Timing | Free Tool |
|---|---|---|
| 1. Pre-release review | Day before earnings | SEC EDGAR, FinChat |
| 2. 8-K analysis | Earnings release day | SEC EDGAR |
| 3. Earnings call review | Same day or next day | FinChat |
| 4. 10-Q follow-up | 40-45 days post quarter | SEC EDGAR |
| 5. Peer comparison | Same earnings window | FactSet Earnings Insight |
The most commonly skipped step is peer comparison. A company’s results in isolation tell an incomplete story. A 12% revenue growth quarter looks strong until three peers in the same sector report 18-22%. Conversely, a slight miss looks different when the entire sector is guiding lower. Peer context is where isolated numbers become actionable assessments.
Sector-specific earnings metrics, such as net revenue retention for SaaS companies, book-to-bill ratios for industrials, and loan loss provisions for banks, reveal trajectory signals that no universal five-step process can fully capture, which is why the peer comparison step benefits from a working knowledge of which KPIs are operationally decisive in each industry.
For investors who read filings regularly and want parsing efficiency, BamSEC ($69/month billed annually) adds non-GAAP flags and comparison tools. For most readers, however, SEC EDGAR and FinChat cover the majority of earnings analysis needs at no cost.
Every tool referenced in this framework is free. Every filing is public. The structural information advantage does not come from access; it comes from attention. Most retail investors stop at the 8-K headline. The framework outlined here moves past that headline into the reconciliation table, the footnotes, the transcript’s hedging language, and the metric that quietly disappeared.
The earnings release is designed to be read a certain way. Investors who follow this process are choosing to read it differently, and that choice compounds. Applied across dozens of earnings cycles, the pattern recognition it builds is something that headline-focused analysis cannot replicate.
The next earnings report on a watchlist is the opportunity to run step one. Pull up the prior 10-Q, note the metrics, and start the log.
This article is for informational purposes only and should not be considered financial advice. Investors should conduct their own research and consult with financial professionals before making investment decisions.
—
GAAP earnings follow standardised accounting rules and include all costs such as stock-based compensation, restructuring charges, and litigation reserves, while non-GAAP earnings are adjusted figures companies construct by excluding certain costs, meaning they have not been approved by any auditor and can vary significantly from the official reported number.
A reliable process starts with reviewing the prior 10-Q before results drop, then on earnings day reading the non-GAAP reconciliation table in the 8-K and calculating the gap between GAAP and non-GAAP EPS, followed by searching the transcript for hedging language, cross-referencing the cash flow statement against net income in the subsequent 10-Q, and finally comparing results against sector peers using tools like FactSet Earnings Insight.
Non-GAAP adjustments are costs a company strips out of its reported earnings to present a higher adjusted profit figure, with the four most common categories being stock-based compensation, restructuring charges, acquisition-related amortisation, and litigation reserves; they matter because these are real economic costs that affect shareholder value even though the company labels them as non-operational.
One of the most reliable signals is tracking which operational metrics a company reported in prior quarters and checking whether any have quietly disappeared from the current release, since companies tend to de-emphasise metrics before they show up as formal misses; widening GAAP-to-non-GAAP gaps, increased hedging language in earnings call transcripts, and net income consistently exceeding operating cash flow are additional warning signs.
All SEC filings including 8-Ks, 10-Qs, and 10-Ks are freely available on SEC EDGAR at sec.gov/edgar, and FinChat.io provides searchable earnings call transcripts at no cost, giving retail investors access to the same primary source materials used by professional analysts.