
The $32 trillion US Treasury market is still selling debt, but it now clears only at yields last seen around 2002. In October alone, more than $5 billion of corporate bond and loan sales were pulled. For investors focused on equities, that pairing is a signal worth reading closely.
The strain in bond market yields comes from several forces meeting at once: inflation, heavy borrowing by governments and AI-focused companies, and an open disagreement between Citadel’s Ken Griffin and Deutsche Bank’s Christian Sewing over whether AI valuations amount to a bubble.
This is not a niche fixed-income story. Bond markets set the borrowing costs that governments, companies and households end up paying.
Here is a way to connect rising yields, inflation and AI sentiment into one picture, along with a short set of indicators that tell you whether the pressure is building or fading.
What the data says about the strain in bond market yields
Yields and postponed deals
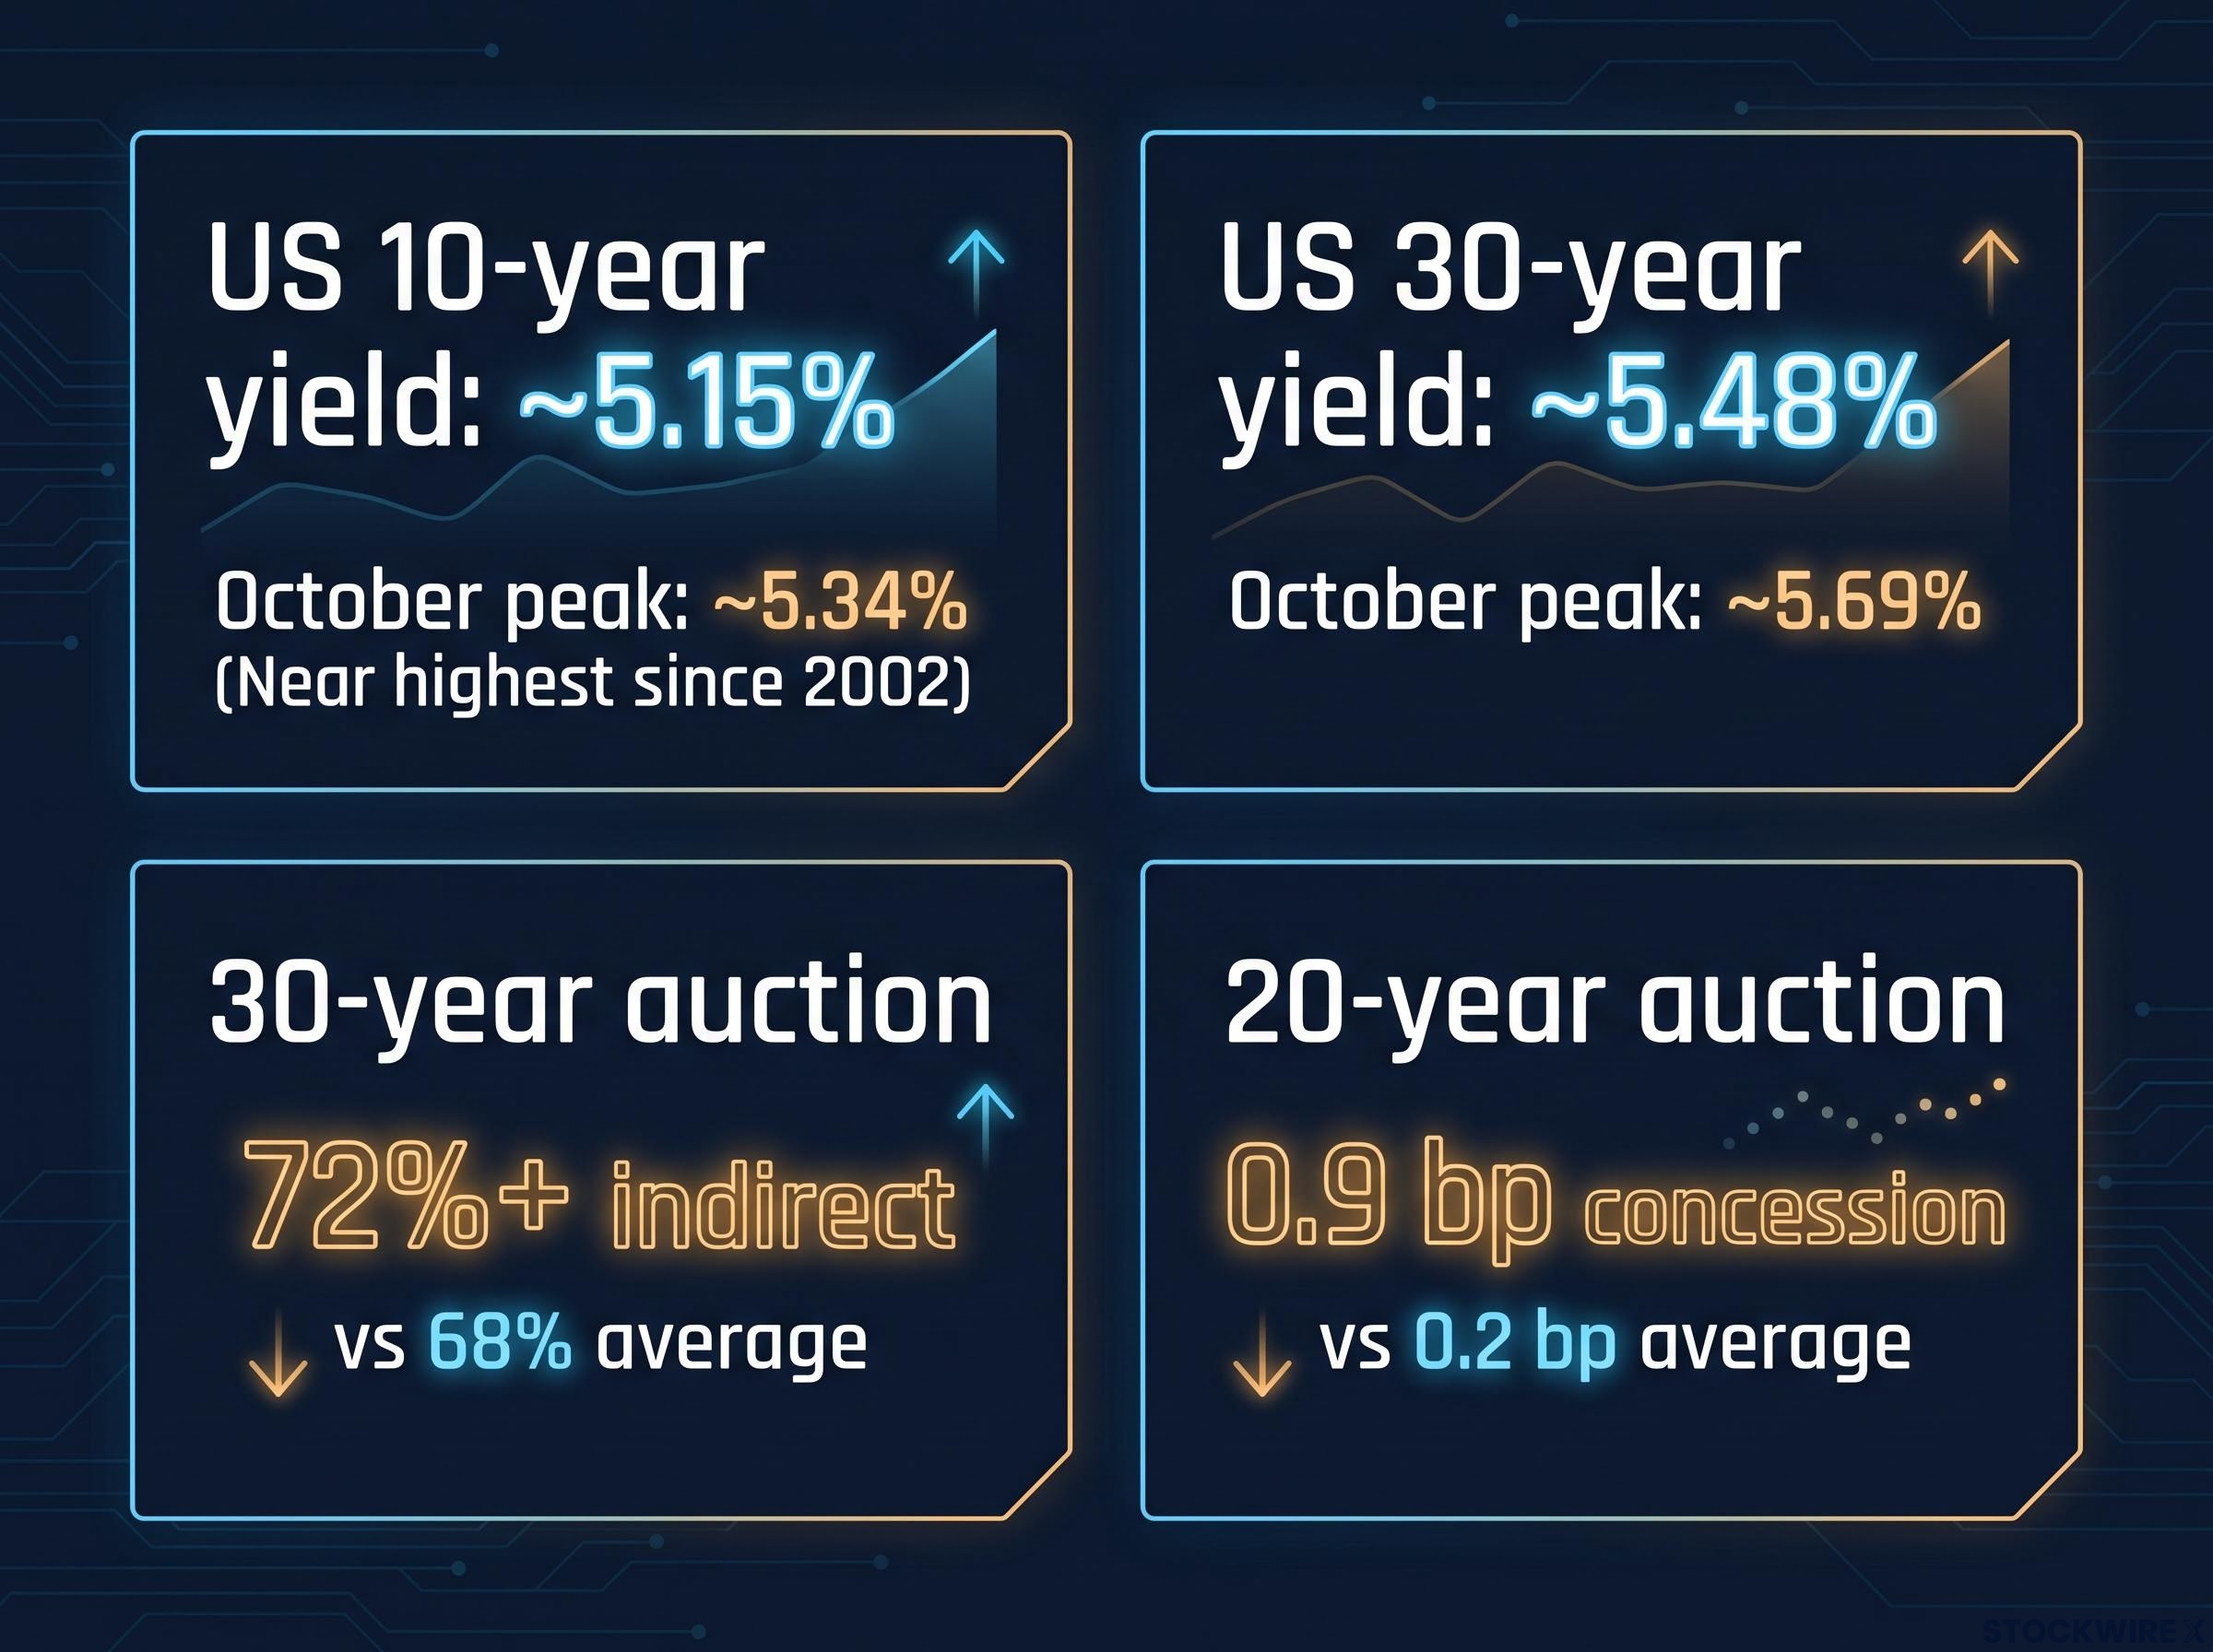
Start with the benchmark. The US 10-year Treasury yield sat near 5.15% on 19 October, according to CNBC. Earlier in the month it touched roughly 5.34%, its highest level since 2002. The 30-year yield followed the same pattern, ending near 5.48% after peaking around 5.69%.
The climb was steep. Reuters calculated on 9 October that the 10-year yield had risen about 135 basis points from February to 5.23%, while the 30-year had gained roughly 110 basis points from its March low. A basis point is one hundredth of a percentage point, so 100 basis points equals 1%.
Companies felt the change first. Bloomberg reported on 21 October that at least seven companies postponed US and European debt deals this month, the largest run of delays in 2026. A full list of those issuers has not been made public.
Riskier borrowers face the steepest costs. B-rated junk bonds now yield 8.39%, and the weakest CCC-rated issuers pay 15.7%.
What recent auctions reveal
Treasury auctions show who is still buying. Indirect bidders are typically overseas institutions and central banks that buy through intermediaries. Direct bidders purchase for their own accounts.
At the $22bn 30-year sale, indirect bidders took more than 72%, above their 68% average. The $13bn 20-year auction was weaker. Indirect take fell to 58.2% against a 65.2% average, and the Treasury had to offer a 0.9 basis point concession, meaning it sold the bonds at a higher yield than the market expected. The usual concession is 0.2 basis points.
Key statistic: A $22bn 30-year auction cleared at about 5.308%, the highest auction yield reported since August 2001.
| Instrument or auction | Latest figure | Comparison point | What it signals |
|---|---|---|---|
| US 10-year yield | ~5.15% | ~5.34% October peak | Near the highest level since 2002 |
| US 30-year yield | ~5.48% | ~5.69% October peak | Long-term borrowing costs remain elevated |
| 30-year auction | 72%+ indirect | 68% average | Strong demand, but only at a high price |
| 20-year auction | 0.9 bp concession | 0.2 bp average | Buyers are more price-sensitive |
The auction results point in one direction. Demand still exists, but buyers are demanding more compensation. Mortgages, corporate credit and property finance are all priced off Treasuries, so those demands flow into your borrowing costs and into the value of what you own.
Weak Treasury auctions carry consequences beyond the sale itself: when indirect bidders retreat and primary dealers absorb the leftovers, the pressure passes into mortgage rates, auto loans and bond fund returns.
When big ASX news breaks, our subscribers know first
Why are yields rising? Inflation, term premium and supply explained
A bond’s yield is the annual return you earn for lending money, expressed as a percentage of the bond’s price. Prices and yields move in opposite directions. When buyers pay less for a bond, its yield rises.
The term premium is the extra yield investors demand for holding a long-dated bond instead of rolling over short-term debt. Reuters argued it had been too low for years. The New York Times reported it has now reached its highest level in more than a decade.
The term premium rebuild is global rather than American, with Japanese, British and Australian long-dated yields repricing at the same time as quantitative tightening removes price-insensitive buyers and sovereign supply keeps growing.
Several drivers are pushing yields higher together:
- Energy-led inflation. The Iran-related energy shock lifted oil and fuel prices and weakened confidence in quick rate cuts, according to UK Finance and Reuters.
- Higher expected policy rates. Hot inflation data and resilient growth have pushed rate expectations up.
- Heavy Treasury supply. Large deficits mean more bonds to sell, and more supply needs higher yields to attract buyers.
- AI corporate borrowing. Hyperscalers, the largest cloud and data-centre operators, reportedly borrowed about $214bn in 2026, compared with $83bn the year before.
- Strong US growth. AI investment is supporting the economy, which makes Federal Reserve cuts less likely.
The least obvious link runs through hedging. Reuters identified that investors buying long-dated AI corporate bonds often hedge their duration, which is their sensitivity to interest-rate changes, by selling Treasuries. AI financing can push government yields up even when corporate credit looks calm.
Cyclical versus structural
The National Institute of Economic and Social Research (NIESR) named three main explanations: the energy shock, AI investment, and public debt and deficits. It cautioned that UK fiscal conditions may amplify global shocks rather than cause them alone.
| Driver | Cyclical or structural | Why |
|---|---|---|
| Energy-led inflation | Cyclical | Could ease if oil and fuel prices fall |
| Central-bank repricing | Cyclical | Tied to current inflation data |
| Term premium | Structural | Reflects a lasting demand for compensation |
| Deficits and supply | Structural | Government borrowing needs persist |
| AI financing | Structural | Multi-year buildout competes for capital |
Some of this pressure may fade with energy prices. The structural pieces look more durable, so assuming a quick return to post-2008 yields carries real risk for anyone pricing bonds, equities or their own debt.
The UK as a live case study: inflation, energy costs and rate-hike pricing
The UK shows these forces working inside one economy. Yesterday’s inflation release provides the starting point.
The Office for National Statistics reported on 20 October that headline inflation reached 3.5% in September, up from 3.1% in August and above the 3.4% forecast. Core inflation, which strips out volatile items like energy and food, rose to 2.8%. Services inflation climbed to 3.7%.
Energy’s share: UK Finance estimates energy costs directly account for about 0.7 percentage points of the 1.1 percentage-point overshoot against the Bank of England’s 2% target.
From there, the chain unfolds quickly:
- Energy prices rise, lifting fuel and headline inflation.
- CPI surprises higher, shifting rate expectations.
- Markets price a hike. With Bank Rate at 3.75%, traders see close to a 100% chance of an increase on 5 November and better than even odds of a second by year-end, according to Euronews.
- Gilts sell off. The 30-year gilt yield briefly topped 6% in October, reportedly the highest since 1998.
- Fiscal headroom shrinks. Reuters estimates the government’s buffer fell from about £24bn in March to between £8.5bn and £16bn.
| Indicator | Latest | Prior or expected | Why it matters |
|---|---|---|---|
| Headline CPI | 3.5% | 3.4% expected | Drives rate-hike pricing |
| September borrowing | £24.5bn | £23.9bn expected | Adds to gilt supply |
| Public-sector net debt | Above £3 trillion | First time on record | Raises sensitivity to yields |
| Bank Rate | 3.75% | Hike priced for 5 November | Sets short-term funding costs |
Memories of the 2022 gilt crisis make investors quick to punish any sign of fiscal slippage. The lesson carries beyond Britain. An energy-driven inflation surprise does not stay in the price data; it moves rate expectations and government borrowing costs together, and you can track that pattern in any market.
Bubble or not? Griffin, Sewing and what credit markets say
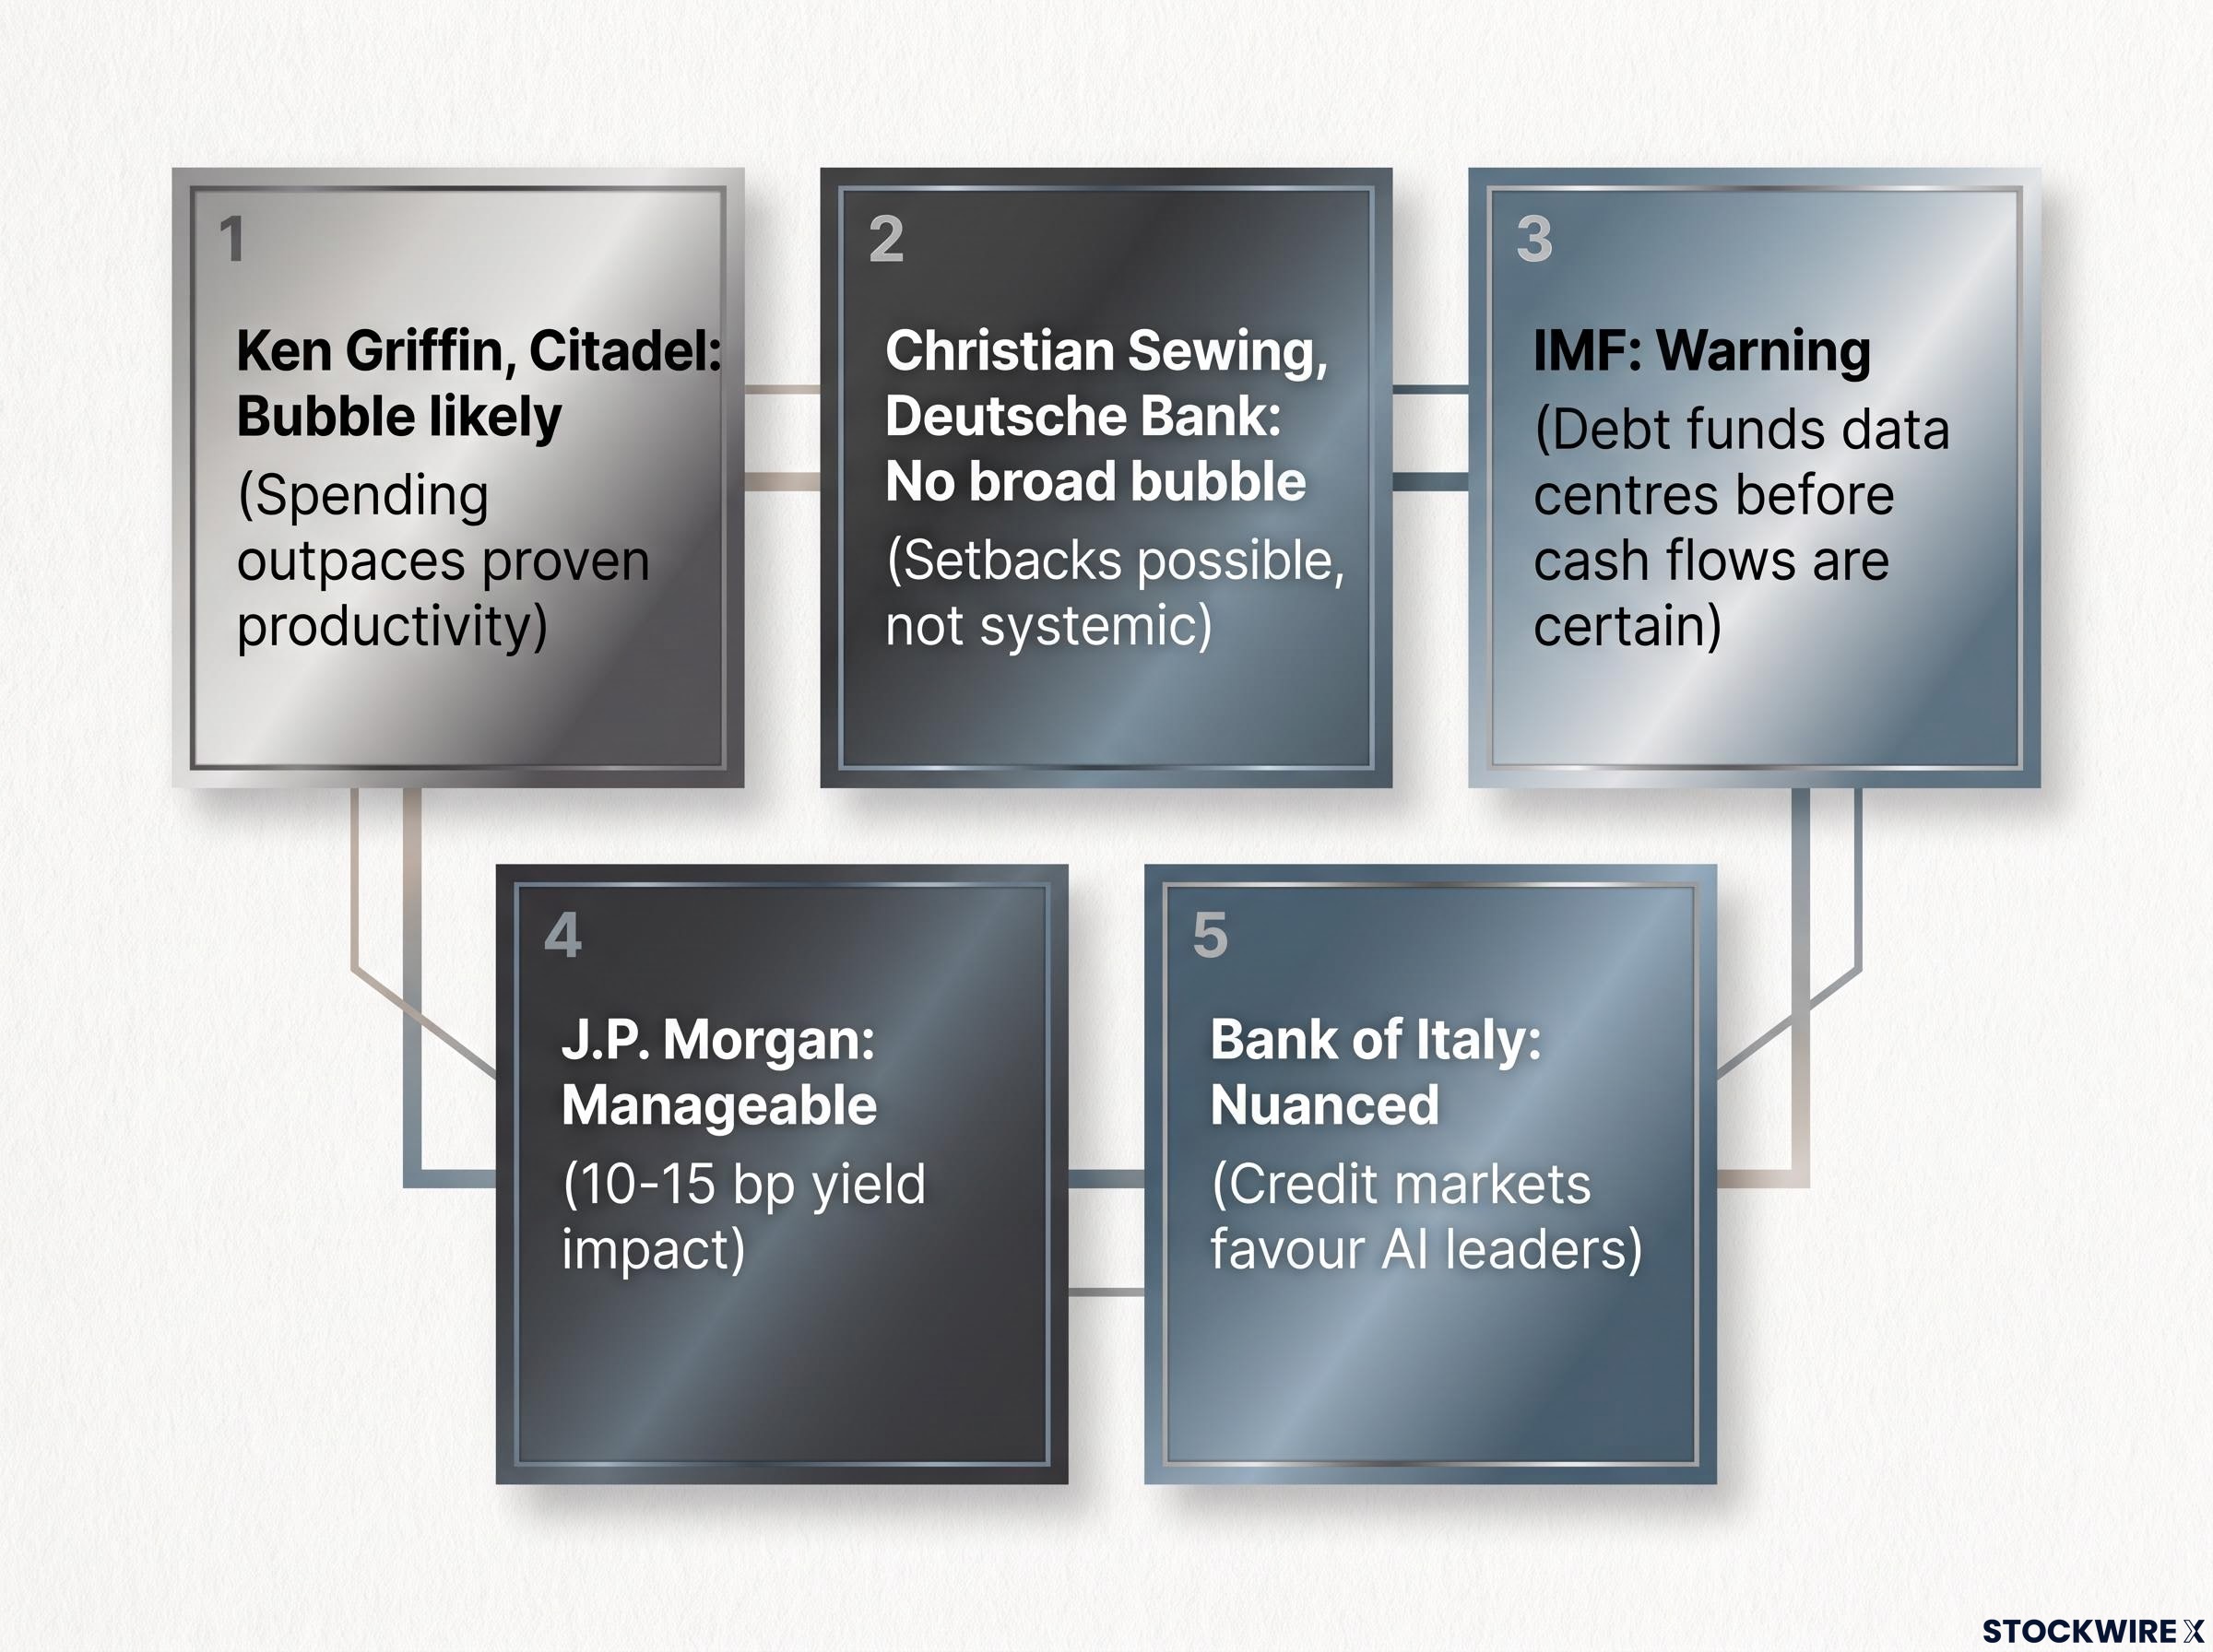
The AI debate has two loud voices. Griffin argues the gap between AI spending and measurable productivity gains is too wide to ignore.
Ken Griffin, Citadel: Investors are “almost certainly” in an AI bubble, according to Bloomberg reporting on 20-21 October.
Sewing disagrees. He sees no broad AI or market bubble about to burst, accepts that individual companies could stumble, and argues volatility does not mean systemic collapse.
Bond-market evidence adds a third voice. The IMF warned on 14 October about risks from debt-funded data-centre construction. J.P. Morgan’s Nikolaos Panigirtzoglou estimates a roughly $260bn rise in 2026 net tech bond issuance could add about 10-15 basis points to global aggregate yields. Bank of Italy economists found hyperscaler bond yields fell relative to other companies after ChatGPT’s launch, suggesting credit investors see leading AI borrowers as strong.
| Voice | Position | Core reasoning |
|---|---|---|
| Ken Griffin, Citadel | Bubble likely | Spending outpaces proven productivity |
| Christian Sewing, Deutsche Bank | No broad bubble | Setbacks possible, not systemic |
| IMF | Warning | Debt funds data centres before cash flows are certain |
| J.P. Morgan | Manageable | 10-15 bp yield impact |
| Bank of Italy | Nuanced | Credit markets favour AI leaders |
The two executives agree on more than the headlines suggest. Both positions accept that AI investment is now large enough to affect credit supply, demand for long-dated bonds and Treasury hedging. You do not need to settle the bubble question to take that supply risk seriously.
For investors weighing the bubble debate, our deep-dive into AI infrastructure bond market risk examines how circular financing flagged by the BIS could undermine technology valuations.
What to watch: risks, counterarguments and signals that matter
Risks that could tighten conditions
- Equity valuations: Weak AI cash flows could compress high-growth stock prices.
- Refinancing: B-rated issuers at 8.39% and CCC-rated at 15.7% face costly rollovers, and postponed deals may cost more later.
- Tight spreads: Reuters found spreads stayed narrow even as AI issuance fed Treasury selling.
- Government funding: Higher yields raise interest bills, as the UK’s shrinking headroom shows.
- Auction liquidity: Repeated larger concessions would signal fading marginal demand.
Why this may not be a crisis
- Growth supports credit: BNY argues rising yields may partly reflect US economic strength.
- Issuance looks manageable: J.P. Morgan’s 10-15 basis point estimate suggests AI supply cannot explain the whole selloff.
- Levels are not unprecedented: BNY’s Alastair Borthwick said the 10-year level itself is not unusual; speed, inflation and liquidity matter more.
Treat calm spreads as incomplete reassurance. Absolute yields and funding costs can rise painfully even while spreads look quiet.
Reading credit spreads alongside absolute yields matters because investment-grade spreads can stay near 0.8 percentage points while Treasury yields hit multi-decade highs, with real stress confined to the weakest CCC tier.
A practical watchlist
- Auction concessions and indirect take: shows whether buyers are getting more selective.
- The 5 November Bank of England decision and autumn budget: tests UK fiscal credibility.
- Energy prices: the main cyclical driver of inflation.
- Corporate issuance: whether postponed deals return or stay shelved.
- Term premium: the clearest gauge of structural pressure.
These statements are speculative and subject to change based on market developments. Past performance does not guarantee future results.
Reading the next move in bond market yields without calling a crisis
No single failure explains the strain. Energy-led inflation, heavy government and AI-related borrowing, and a higher term premium are feeding off each other.
The energy shock may ease. Deficits, supply and AI financing look stickier, which means yields could stay above the post-2008 norm even without a full-blown crisis.
Use the watchlist rather than the bubble headlines to judge direction. Narrowing auction concessions and returning corporate deals would suggest easing; wider concessions and a rising term premium would point the other way. This is a sensible moment to review your exposure to long-duration assets and any refinancing you have coming up.
This article is for informational purposes only and should not be considered financial advice. Investors should conduct their own research and consult with financial professionals before making investment decisions.