
The Memo That Halved Meta’s AI Infrastructure Cost Estimate
4 hrs ago
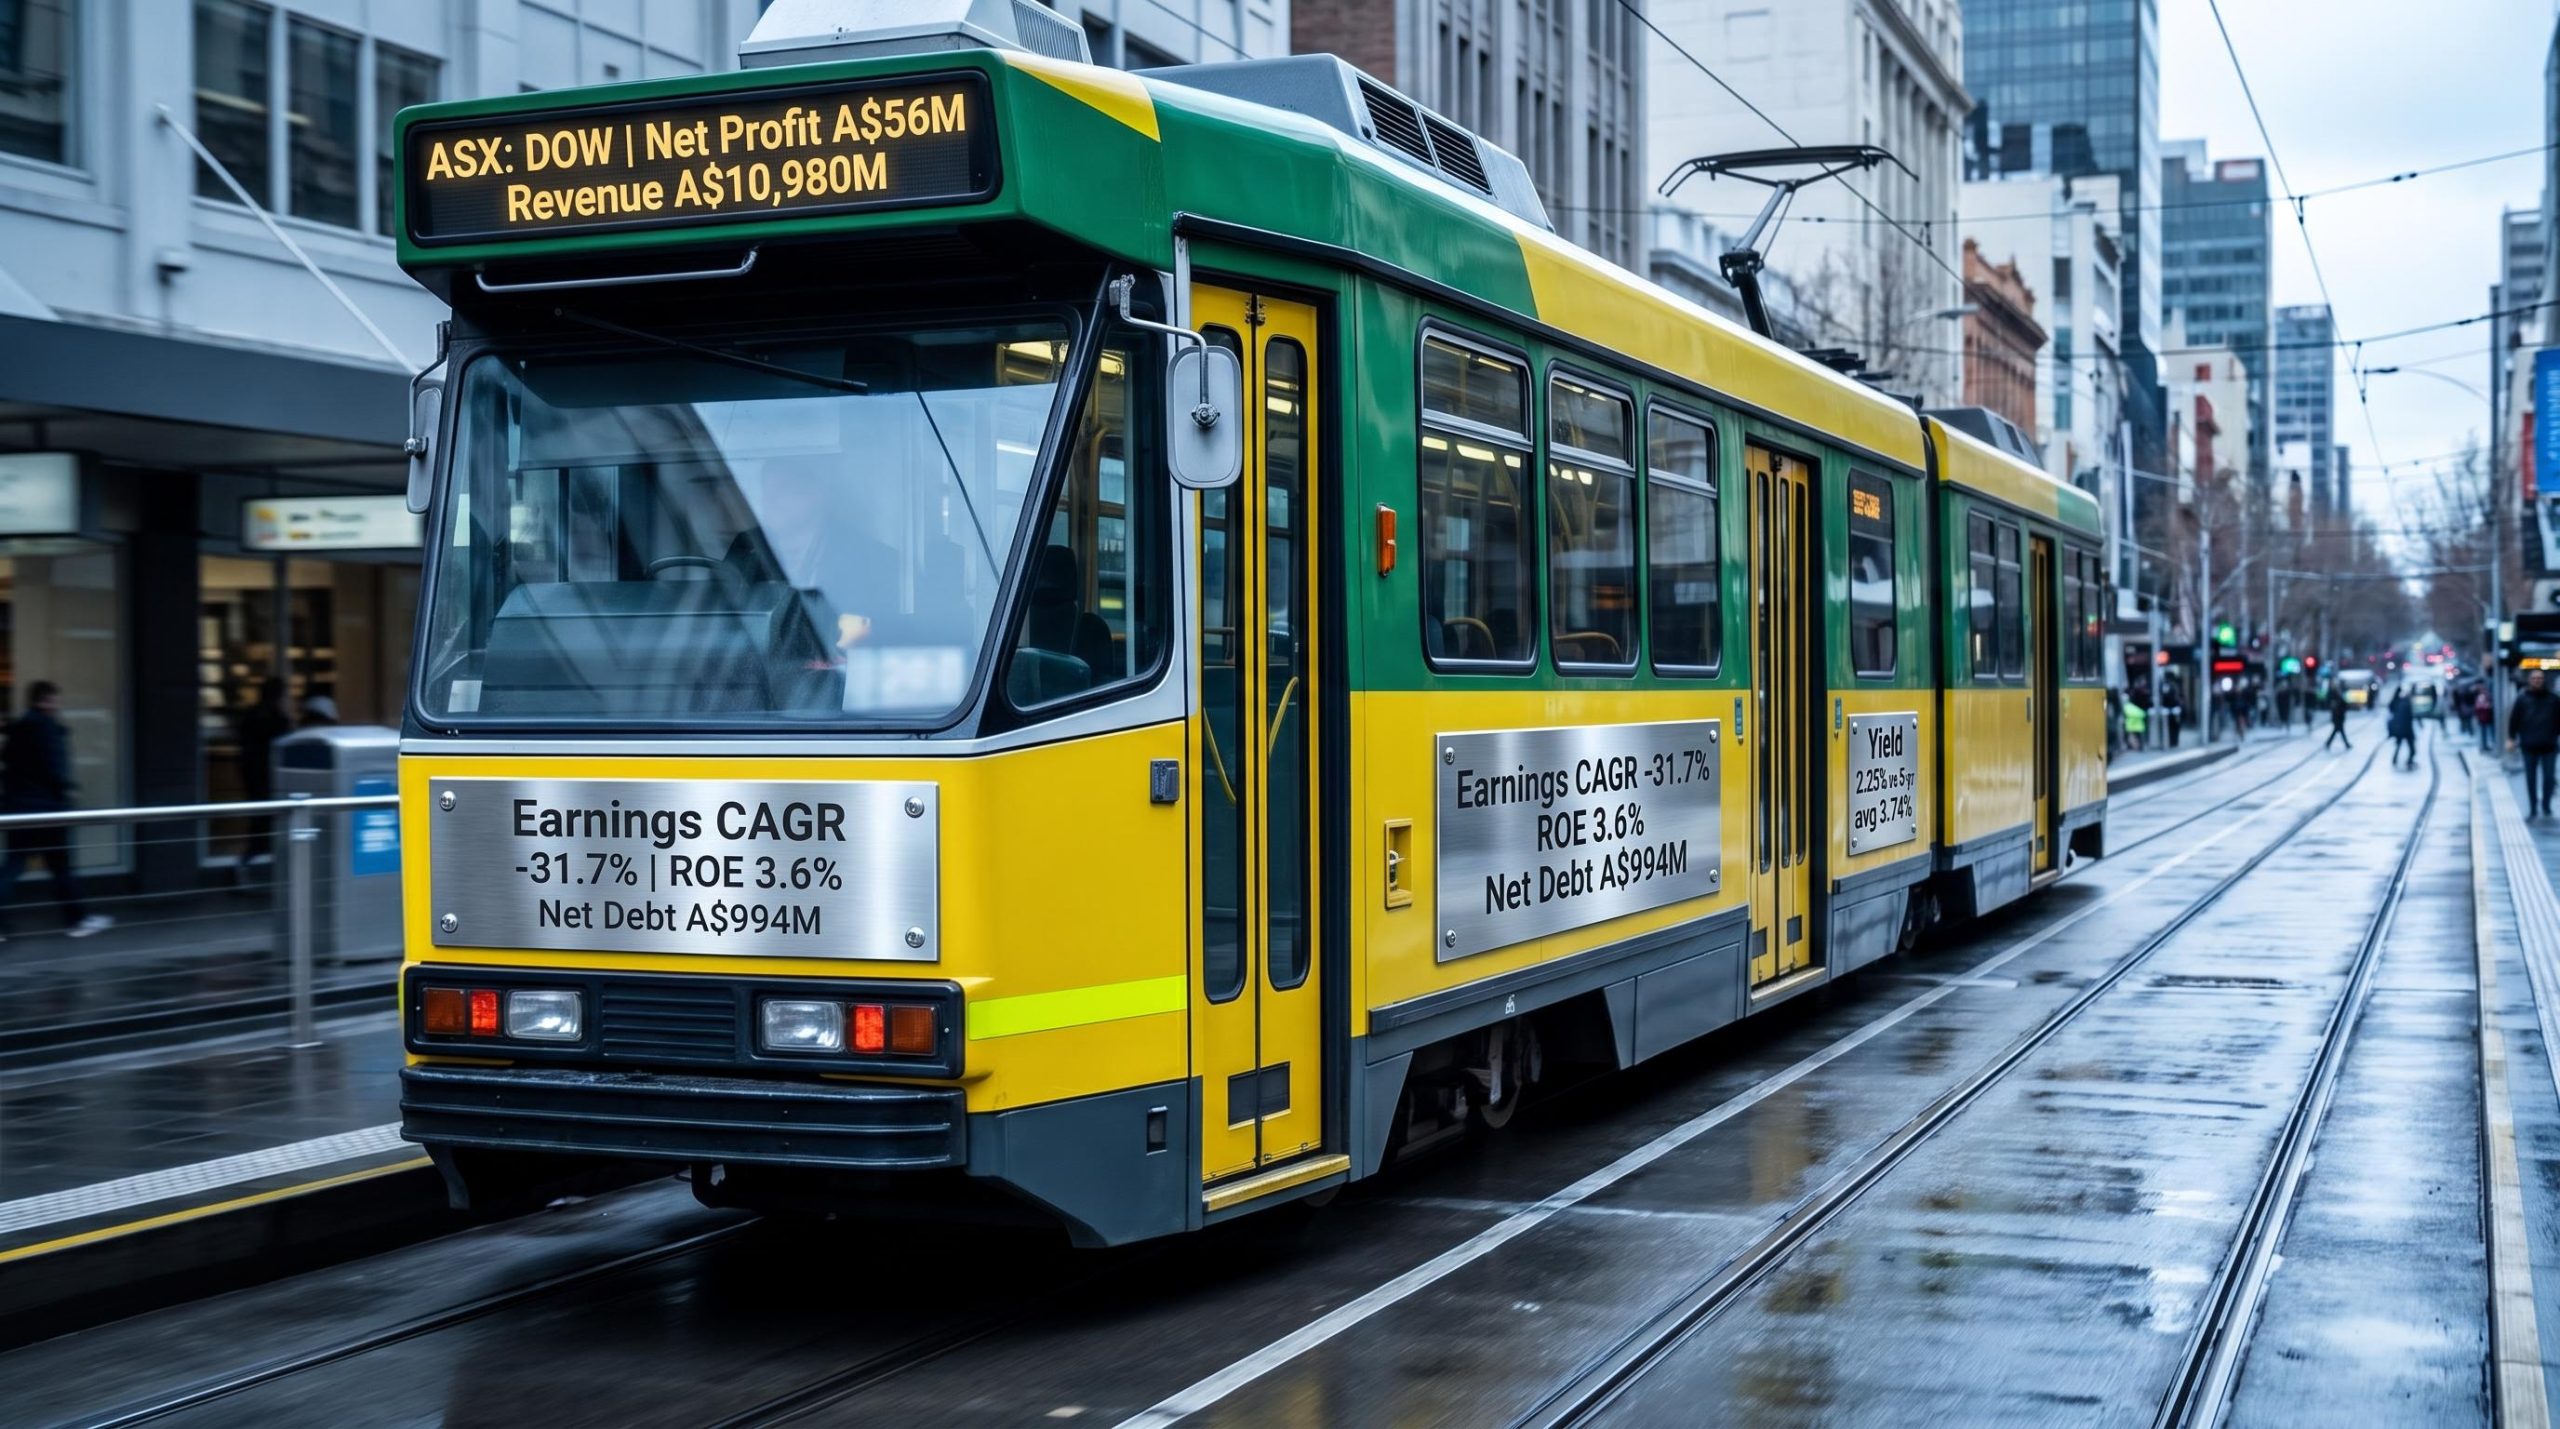
Downer EDI (ASX: DOW) reported A$10,980 million in annual revenue in its most recent full year. It operates Melbourne’s tram network, maintains thousands of kilometres of Queensland roads, and manufactures passenger rolling stock. Yet the company posted a net profit of just A$56 million, down from A$176 million three years earlier, a compound annual earnings decline of 31.7%. For Australian investors evaluating infrastructure exposure, the gap between Downer’s operational scale and its financial returns is the central tension in this stock. The share price has slipped 5.14% year-to-date, the dividend yield has compressed to 2.25% against a five-year average of 3.74%, and management continues to execute a multi-year balance sheet repair programme. What follows is an analysis of Downer’s business structure, the financial trends behind the deterioration, the balance sheet position, and where the stock sits relative to peers, providing a framework for assessing whether the current setup represents value or a value trap.
Downer is not a single business. It operates three reporting segments with distinct risk profiles, contract structures, and margin characteristics. Understanding the divisional split is a prerequisite to interpreting the financial metrics that follow.
The scale of Downer’s embedded relationships is worth noting. The company operates Yarra Trams in Melbourne and holds multi-billion-dollar rail maintenance contracts in Sydney. These are not easily replaceable, and their tenure shapes how investors should read the revenue base: sticky, but not necessarily profitable.
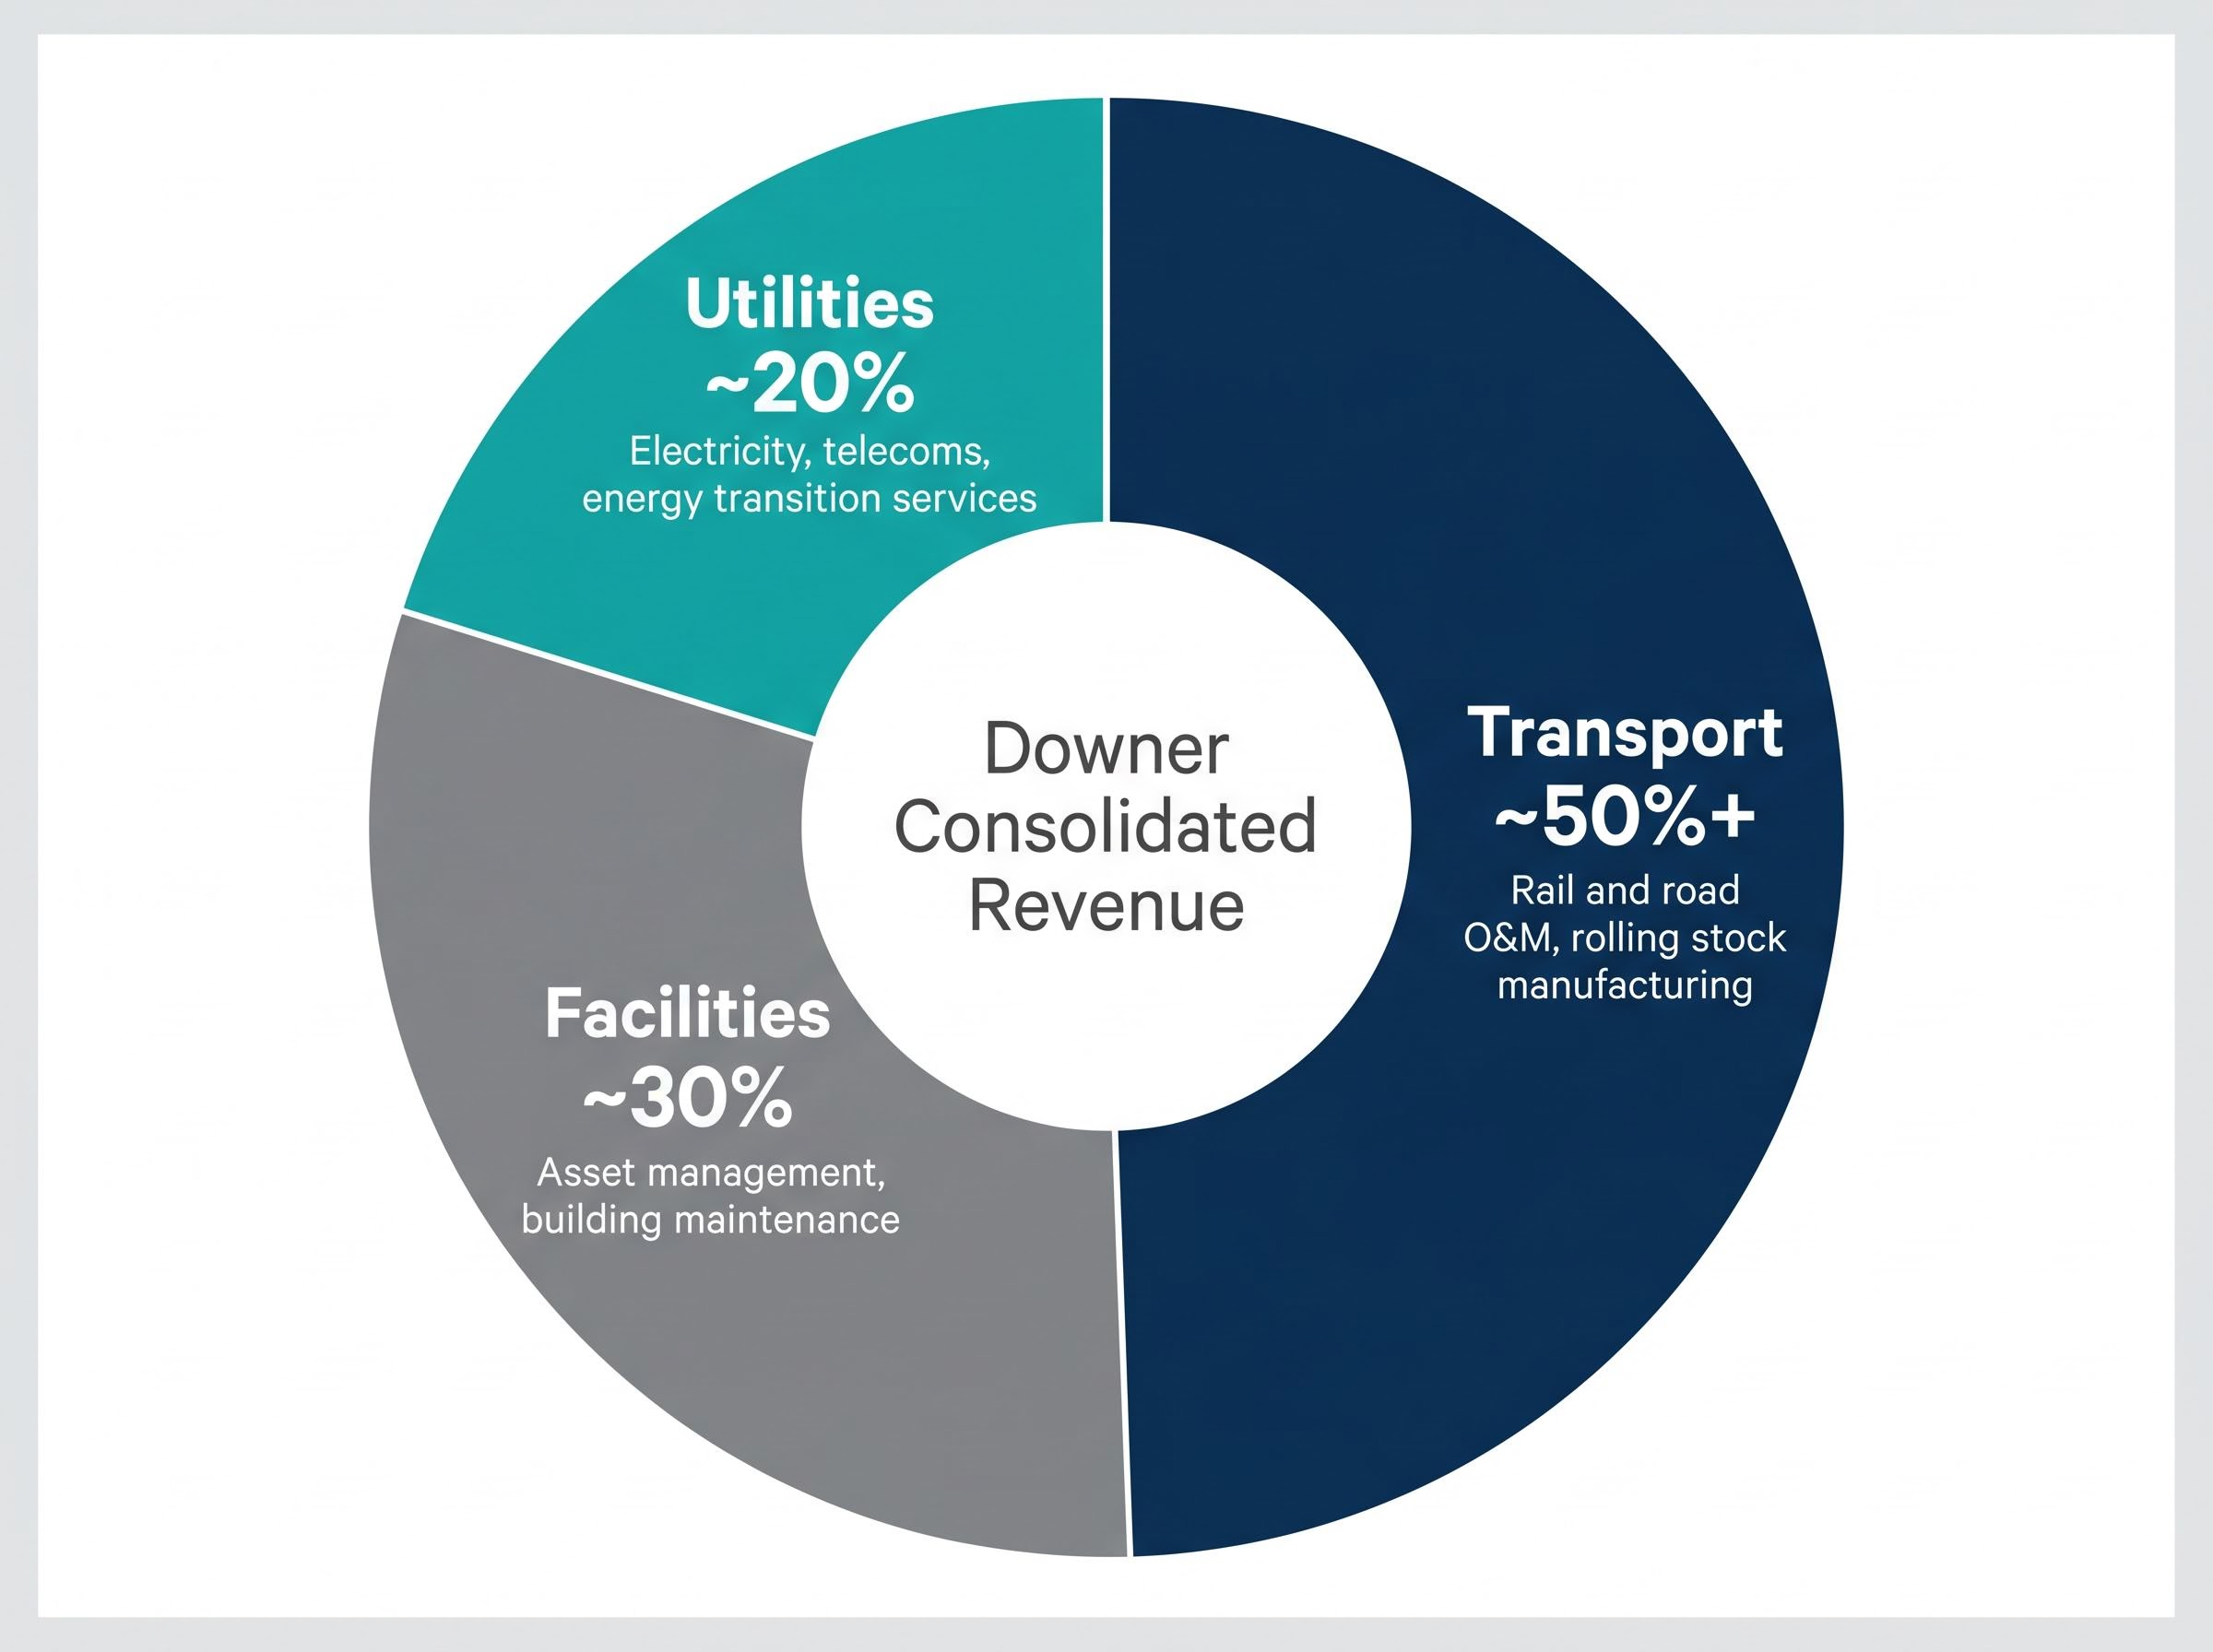
| Division | Core Activity | Revenue Share (%) |
|---|---|---|
| Transport | Rail and road O&M, rolling stock manufacturing | ~50%+ |
| Utilities | Electricity, telecoms, energy transition services | ~20% |
| Facilities | Asset management, building maintenance | ~30% |
With Transport contributing more than half of consolidated revenue, the segment’s contract economics drive the group result more than any other single factor.
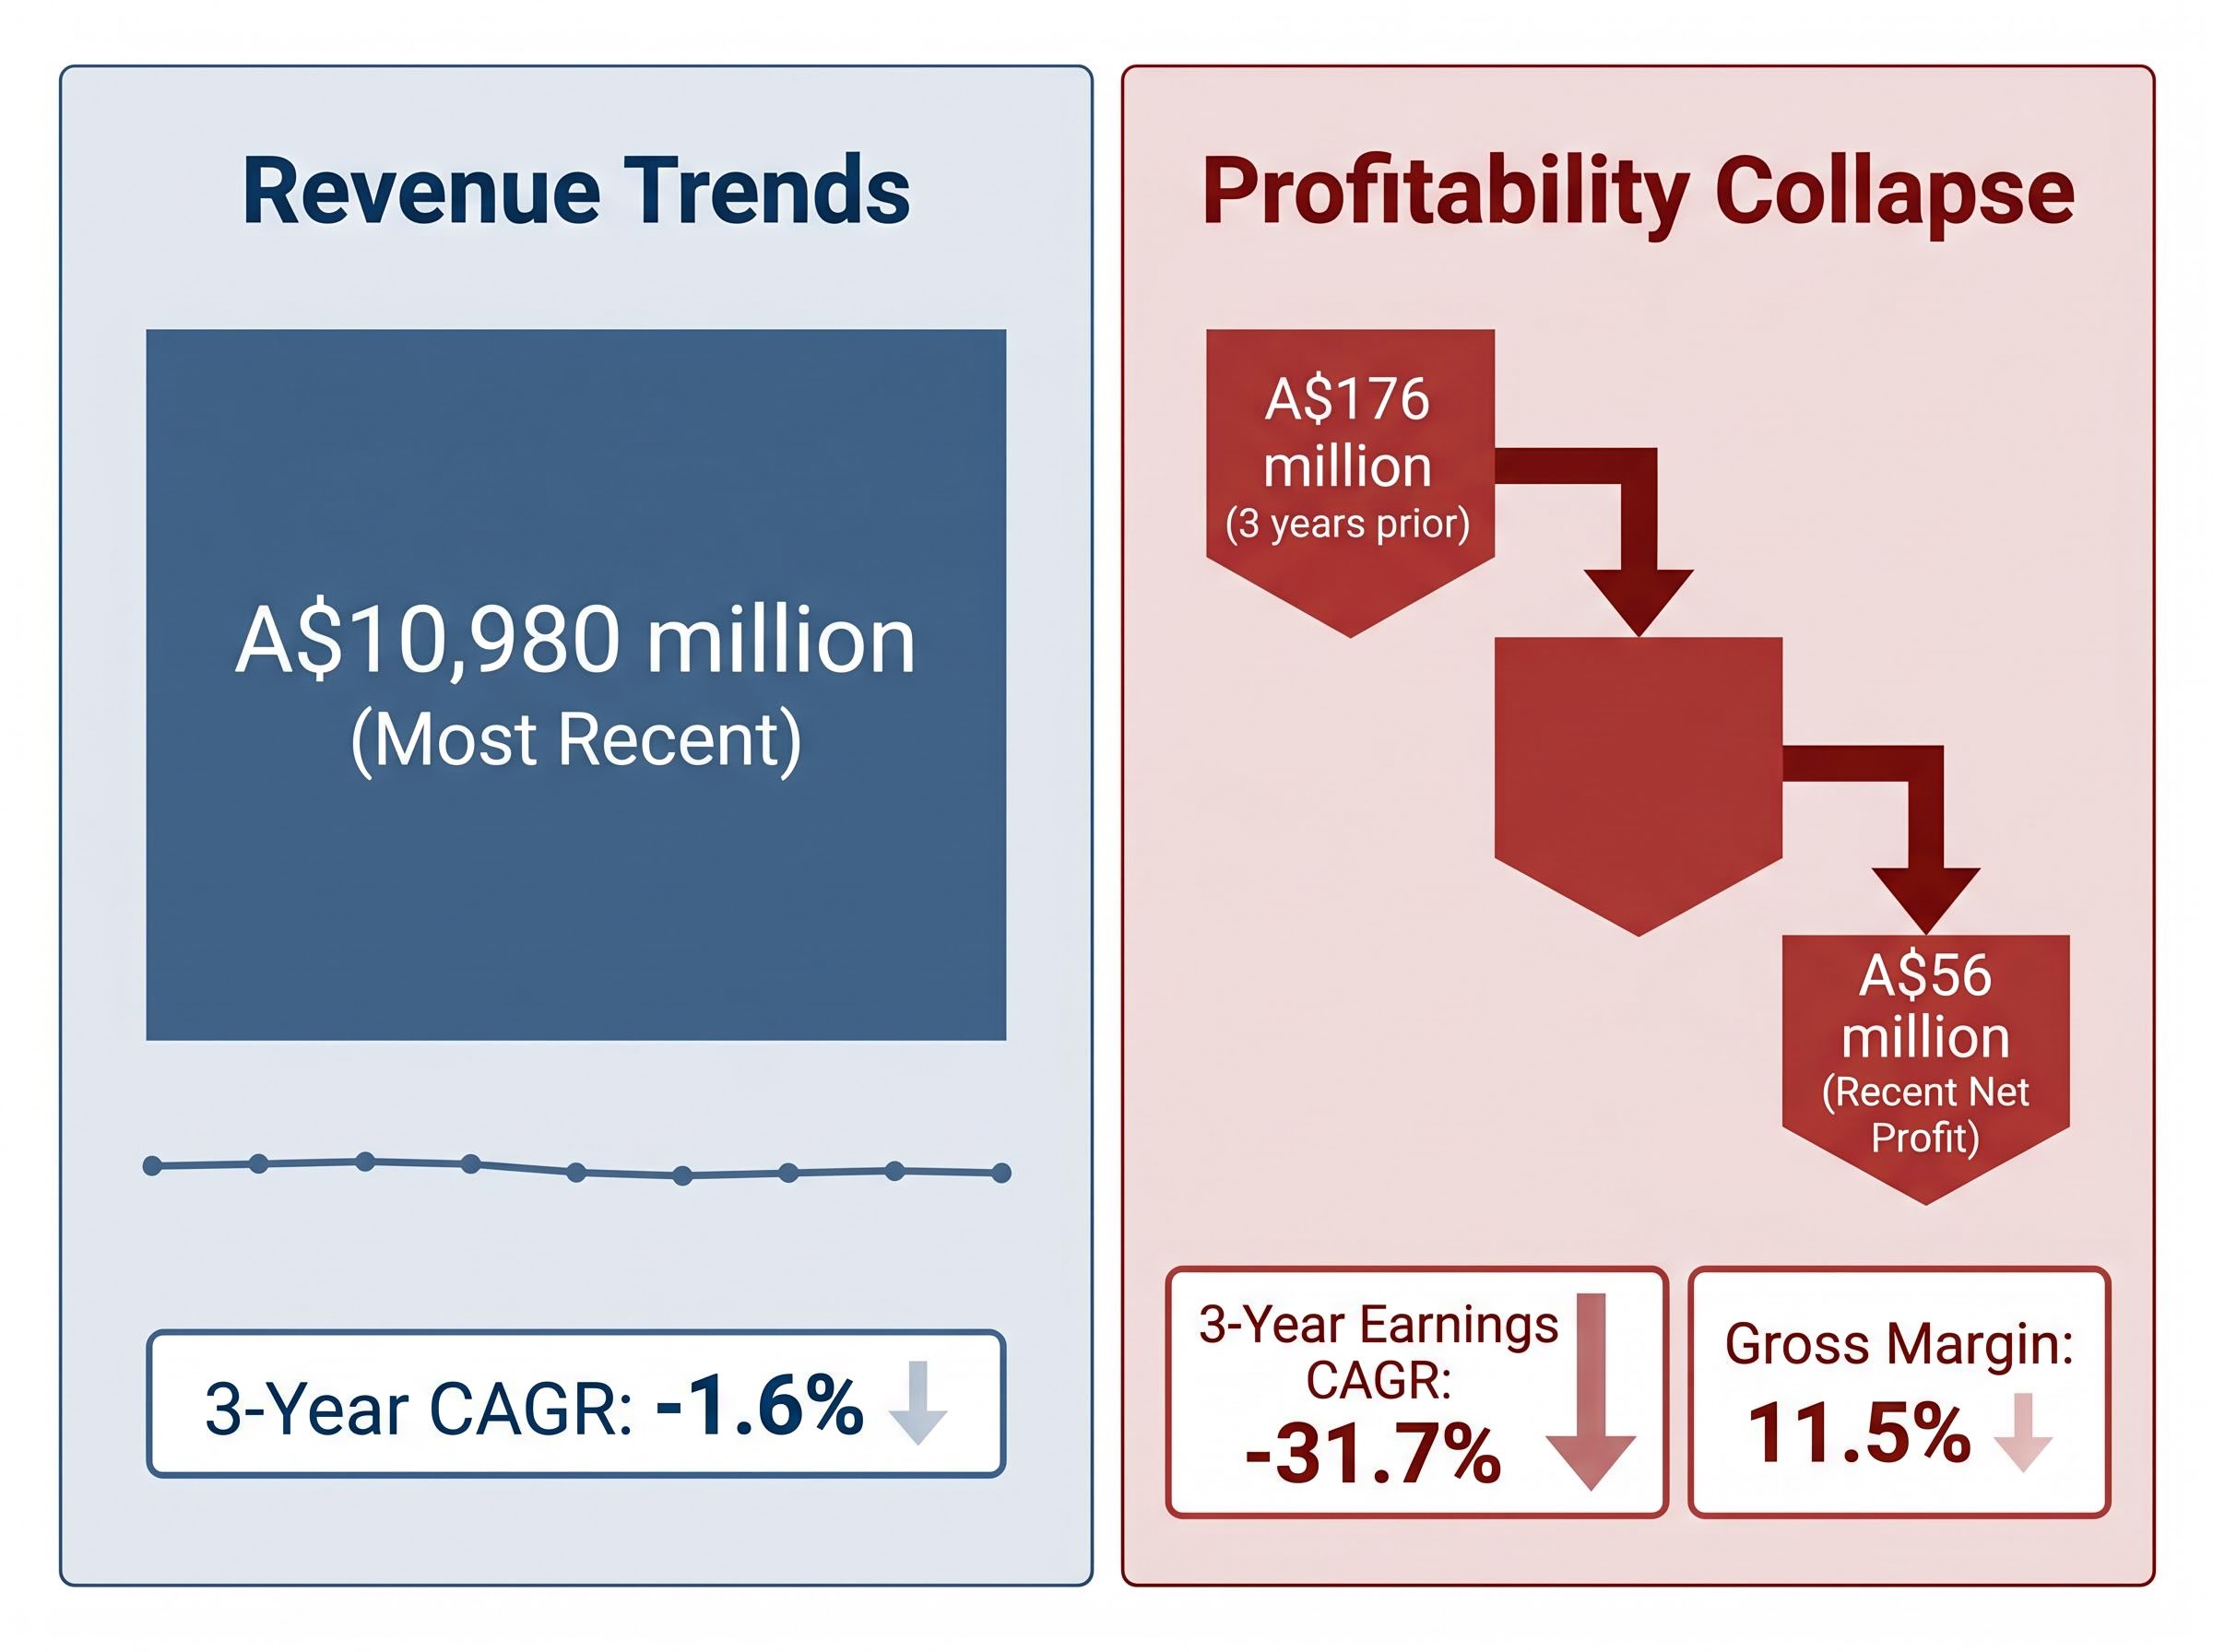
The headline numbers are stark. Downer’s net profit fell from A$176 million to A$56 million over three years. Revenue declined modestly, slipping at a compound annual rate of 1.6%. But profit collapsed at a compound annual rate of 31.7%.
The gross margin of 11.5% provides context. In a services business generating nearly A$11 billion in revenue, an 11.5% gross margin leaves almost no buffer for contract write-downs, cost overruns, or labour inflation. When those pressures materialised, they fell almost entirely to the bottom line.
| Metric | Value / Trend |
|---|---|
| Revenue (most recent full year) | A$10,980 million |
| Revenue CAGR (3 years) | -1.6% |
| Gross Margin | 11.5% |
| Net Profit (most recent) | A$56 million |
| Net Profit (3 years prior) | A$176 million |
| Earnings CAGR (3 years) | -31.7% |
“Downer’s net profit has declined at a compound annual rate of 31.7% over three years.”
Management’s response has been a stated “simplification” programme: exiting high-risk construction activities and pivoting toward recurring O&M and services contracts. Macquarie, in a November 2024 research note, and UBS, in a March 2025 note, both identified legacy loss-making contracts rolling off through FY25-FY26 as the pathway to margin recovery.
The financial evidence of that recovery, however, is not yet visible in headline numbers.
The divergence between a 1.6% revenue CAGR decline and a 31.7% earnings CAGR decline points to a margin deterioration problem, not a volume problem. Revenue held broadly steady. Profitability was eroded at the operating level by cost pressures, contract write-downs, and losses on legacy projects. This distinction matters: a business losing volume requires a different fix than a business losing margin on stable volume. Downer’s challenge sits squarely in the second category.
Net debt, total borrowings minus cash, stands at A$994 million. For a business generating A$56 million in net profit, that figure carries weight, even though equity exceeds debt on a book-value basis. The debt-to-equity ratio of 81.1% is manageable but leaves limited headroom for operational missteps.
ASX balance sheet analysis frameworks add important context here: Downer’s 81.1% debt-to-equity ratio sits in a range that reads very differently depending on sector norms, and under AASB 16, lease liabilities embedded in long-tenure O&M contracts can meaningfully inflate reported leverage figures beyond what headline debt alone suggests.
The return on equity (ROE) figure sharpens the picture. At 3.6% for FY24, Downer generates less than four cents of profit for every dollar of shareholder equity, a measure of how efficiently the company converts its capital base into returns.
“At 3.6% ROE, Downer is generating less than four cents of profit for every dollar of shareholder equity.”
That figure sits materially below peers and below the cost of capital, which means the business is, in economic terms, destroying value for shareholders at current profitability levels.
On the debt management front, Downer has been active. In November 2024, approximately A$500 million in bank debt facilities were refinanced and extended to FY28-FY29. In March 2025, a new A$300 million medium-term note was issued with a maturity in the early 2030s, modestly lengthening the debt profile and reducing average coupon cost. These are signs of proactive management, but the trajectory remains debt reduction, not elimination.
Downer’s April 2026 debt refinancing provides the most recent balance sheet update: the $400 million medium-term note issued at 6.488% over seven years replaced a larger $500 million maturity, with the $100 million reduction reflecting improved cash generation and pushing the weighted average debt maturity to approximately four years at 30 June 2026.
Management has stated a clear capital allocation hierarchy:
That ordering tells investors where dividends sit in the queue: last.
Downer’s current dividend yield of approximately 2.25% sits well below its five-year historical average of 3.74%. The gap is 149 basis points, and its cause matters more than its size.
| Metric | Value |
|---|---|
| Current Dividend Yield | ~2.25% |
| Five-Year Average Yield | 3.74% |
| Gap | ~149 basis points |
“At 2.25%, Downer’s current dividend yield sits nearly 150 basis points below its own five-year historical average.”
The compression is driven primarily by reduced dividend payments, not a rising share price. That is a qualitatively different signal. A yield that compresses because the share price has risen suggests investor optimism. A yield that compresses because the payout has been cut, while the share price simultaneously falls 5.14% year-to-date, signals something closer to the opposite.
Dividend yield compression as a warning signal operates differently depending on its cause: a yield that falls because the share price has risen is a sign of investor confidence, while one that falls because the payout has been cut, as with Downer, is among the clearest early signals that management has deprioritised income in favour of balance sheet repair.
The share price in mid-May 2026 trades around A$7.62-A$7.72, implying a market capitalisation of approximately A$5.03-A$5.10 billion. Analyst consensus sits at Neutral to mild Buy/Outperform, with 12-month price targets ranging from approximately A$7.36 to A$8.24, a modest band that does not suggest strong conviction in either direction.
For income-focused Australian investors who frequently screen for yield, a payout sitting 149 basis points below its own historical average, driven by a deliberate cut tied to the capital allocation hierarchy, should be read as a signal about management’s confidence in near-term cash generation, not as an opportunity to buy an undervalued income stream.
Infrastructure services businesses are not homogeneous. The distinction between operations and maintenance (O&M) contractors and greenfield construction contractors defines the risk-return profile of the sector. O&M providers generate recurring, lower-risk revenue tied to assets that must function regardless of economic conditions: roads, rail networks, power lines. Construction contractors undertake discrete projects with material exposure to cost overruns, design changes, and fixed-price risk.
According to the CBRE Infrastructure Quarterly (Q4 2024), O&M and services providers tied to essential infrastructure tend to show more earnings resilience in downturns than developers or greenfield constructors. Downer’s strategic pivot toward O&M and away from construction aligns with this logic.
Three ASX-listed peers provide useful reference points:
According to UBS’s April 2025 sector note, Downer’s ROE of approximately 3-4% compares to peers in high single digits. Morningstar, in a January 2025 peer comparison, noted that Downer trades at a discounted P/E and EV/EBITDA multiple relative to Ventia, reflecting lower profitability and a track record of contract issues rather than a simple sector-wide discount.
The O&M pivot is generating pipeline activity. Four wins since mid-2024 provide concrete evidence:
These wins are leading indicators. They signal future revenue stability and validate the strategic direction, but they do not yet appear in margin recovery or bottom-line improvement. The lag between contract award and financial impact is the gap investors must bridge with patience or conviction.
The confirmed negatives are specific: three years of earnings compression at a 31.7% compound annual rate, A$994 million in net debt, ROE of 3.6%, a dividend yield sitting 149 basis points below its own five-year average, and a 5.14% year-to-date share price decline.
The unconfirmed positives are directional: the simplification strategy is credible, the contract pipeline exceeds A$2 billion in wins since mid-2024, and broker consensus is mildly constructive, with 12-month targets modestly above current levels. UBS (March 2025) maintains a Neutral/Hold stance. Goldman Sachs (October 2024) rates the stock Neutral, citing limited near-term upside until earnings volatility subsides. Morningstar (February 2025) views the stock as fairly to slightly undervalued on an assumption of moderate margin recovery.
“UBS maintains a Neutral/Hold stance pending clearer evidence of sustainable ROE uplift toward mid-single digits.”
Three specific metrics would shift the picture:
Both Morningstar and UBS flag these as preconditions for a re-rating.
For investors wanting to assess whether the margin recovery is already priced in at current levels, our deep-dive into Downer’s FY25 earnings recovery examines the 33% underlying NPATA uplift, the 46.5% dividend increase, and the two new billion-dollar contracts against a trailing P/E above 32x and net profit margins still below 2%, providing a valuation stress test for the bull case outlined here.
| Factor | Bull Case | Bear Case |
|---|---|---|
| Earnings Trajectory | Legacy contracts roll off; margins recover from FY26 | New contract margins disappoint; cost pressures persist |
| Balance Sheet | Net debt falls below A$900M; refinancing extends runway | Working capital swings constrain free cash flow |
| Dividend Outlook | Payout lifts as debt reduction targets are met | Dividends remain subordinated for 2+ years |
| Valuation | Discount to Ventia narrows on execution evidence | Discount is warranted; ROE stays sub-5% |
Downer’s FY26 half-year results, expected in August 2026, represent the next quantitative update and the most immediate opportunity to test these metrics against actual performance.
The analytical picture for Downer EDI is genuinely mixed. This is a structurally important business embedded in infrastructure Australians rely on daily, executing a strategy that the sector logic supports. The problem is that the financial evidence of that strategy’s success has not yet appeared in profitability or shareholder returns.
The investment case at current levels is a recovery thesis. It requires a 12-to-24-month horizon and tolerance for earnings volatility. It is not a defensive income play; the dividend policy explicitly confirms that. It is not a near-term growth story; the earnings trajectory explicitly denies it.
Investors watching DOW should be tracking margin improvement, not headline revenue. The FY26 half-year results in August 2026 will provide the clearest test of whether simplification is translating into financial recovery or whether the gap between strategy and results continues to widen.
Under ASIC continuous disclosure obligations, ASX-listed companies such as Downer must lodge half-year financial reports in addition to their full-year results, which is why the August 2026 half-year update carries such weight as a quantitative checkpoint for investors tracking margin recovery.
This article is for informational purposes only and should not be considered financial advice. Investors should conduct their own research and consult with financial professionals before making investment decisions. Past performance does not guarantee future results. Financial projections are subject to market conditions and various risk factors.
Downer EDI (ASX: DOW) is an Australian infrastructure services company operating three divisions: Transport (rail and road operations and maintenance, rolling stock manufacturing), Utilities (electricity distribution and telecommunications), and Facilities (building and asset management). It runs Melbourne's tram network and holds multi-billion-dollar rail maintenance contracts in Sydney.
Downer's net profit declined from A$176 million to A$56 million over three years, a compound annual decline of 31.7%, driven by a thin 11.5% gross margin that left almost no buffer against contract write-downs, cost overruns, and labour inflation on legacy construction projects. Revenue fell only modestly at 1.6% per year, confirming this is a margin problem, not a volume problem.
Downer's current dividend yield is approximately 2.25%, well below its five-year historical average of 3.74%, a gap of around 149 basis points. The compression is driven by reduced dividend payments tied to management's capital allocation hierarchy, which explicitly prioritises debt reduction over shareholder distributions.
Downer carries net debt of approximately A$994 million, with a debt-to-equity ratio of 81.1%. Management has been actively refinancing, extending facilities to FY28-FY29 and issuing medium-term notes to push maturities into the early 2030s, with a stated goal of reducing net debt below A$900 million as a precondition for improving shareholder returns.
Since mid-2024, Downer has secured over A$2 billion in contract wins including a A$1.1 billion Sydney Rail O&M extension, a A$600 million Queensland road maintenance re-award, and two smaller utilities and telecoms contracts. These wins validate the strategic pivot toward recurring operations and maintenance work but have not yet translated into visible margin or profit improvement.


