Nvidia’s Biggest Customers Are Building Its Biggest Rivals
33 mins ago

Bank of Queensland shares are trading around $6.27, yet two independent valuation models place fair value anywhere from $7.19 to $10.57 per share. That is not a signal to celebrate. It is a gap that demands interrogation. BOQ sits at an unusual crossroads in May 2026: a share price that has drifted sideways through a period of mixed interim results and sector-wide margin pressure, yet quantitative valuation work that consistently points above the current market price. For Australian investors who hold bank stocks as core portfolio positions, understanding whether that gap reflects genuine undervaluation or a rational discount for execution risk is a meaningful analytical question. What follows walks through exactly how both the price-to-earnings (PE) ratio method and the Dividend Discount Model (DDM) were applied to BOQ’s specific financials, presents the numerical outputs of each, tests the assumptions behind them, and explains what the spread between market price and modelled value actually signals for investors weighing up ASX bank stocks.
BOQ has been trading in a narrow range of $6.25-$6.38 as of 20 May 2026, broadly anchored around the $6.27 level. At that price, the stock implies a PE multiple of approximately 15.3x based on FY24 earnings per share of $0.41, reported via ASX announcement on 16 October 2024. That multiple is not expensive by sector standards, but the market has shown no urgency to push the price higher.
Three factors have shaped recent price action:
The RBA banking sector indicators, updated through April 2026, show net interest margin compression continuing across the major and regional banks, providing the sector-wide backdrop against which BOQ’s own margin pressure and cautious broker consensus targets need to be interpreted.
The major four Australian banks trade on forward PE multiples in the low-to-mid teens, with Commonwealth Bank commanding a premium in the mid-to-high teens. Regional banks sit below that range for structural reasons: smaller balance sheets, narrower earnings diversification, and ongoing investment programmes that absorb capital. BOQ’s current implied PE of 15.3x sits within the broad sector range, but the market is pricing it as a bank still earning its way through a transition, not one that has completed it.
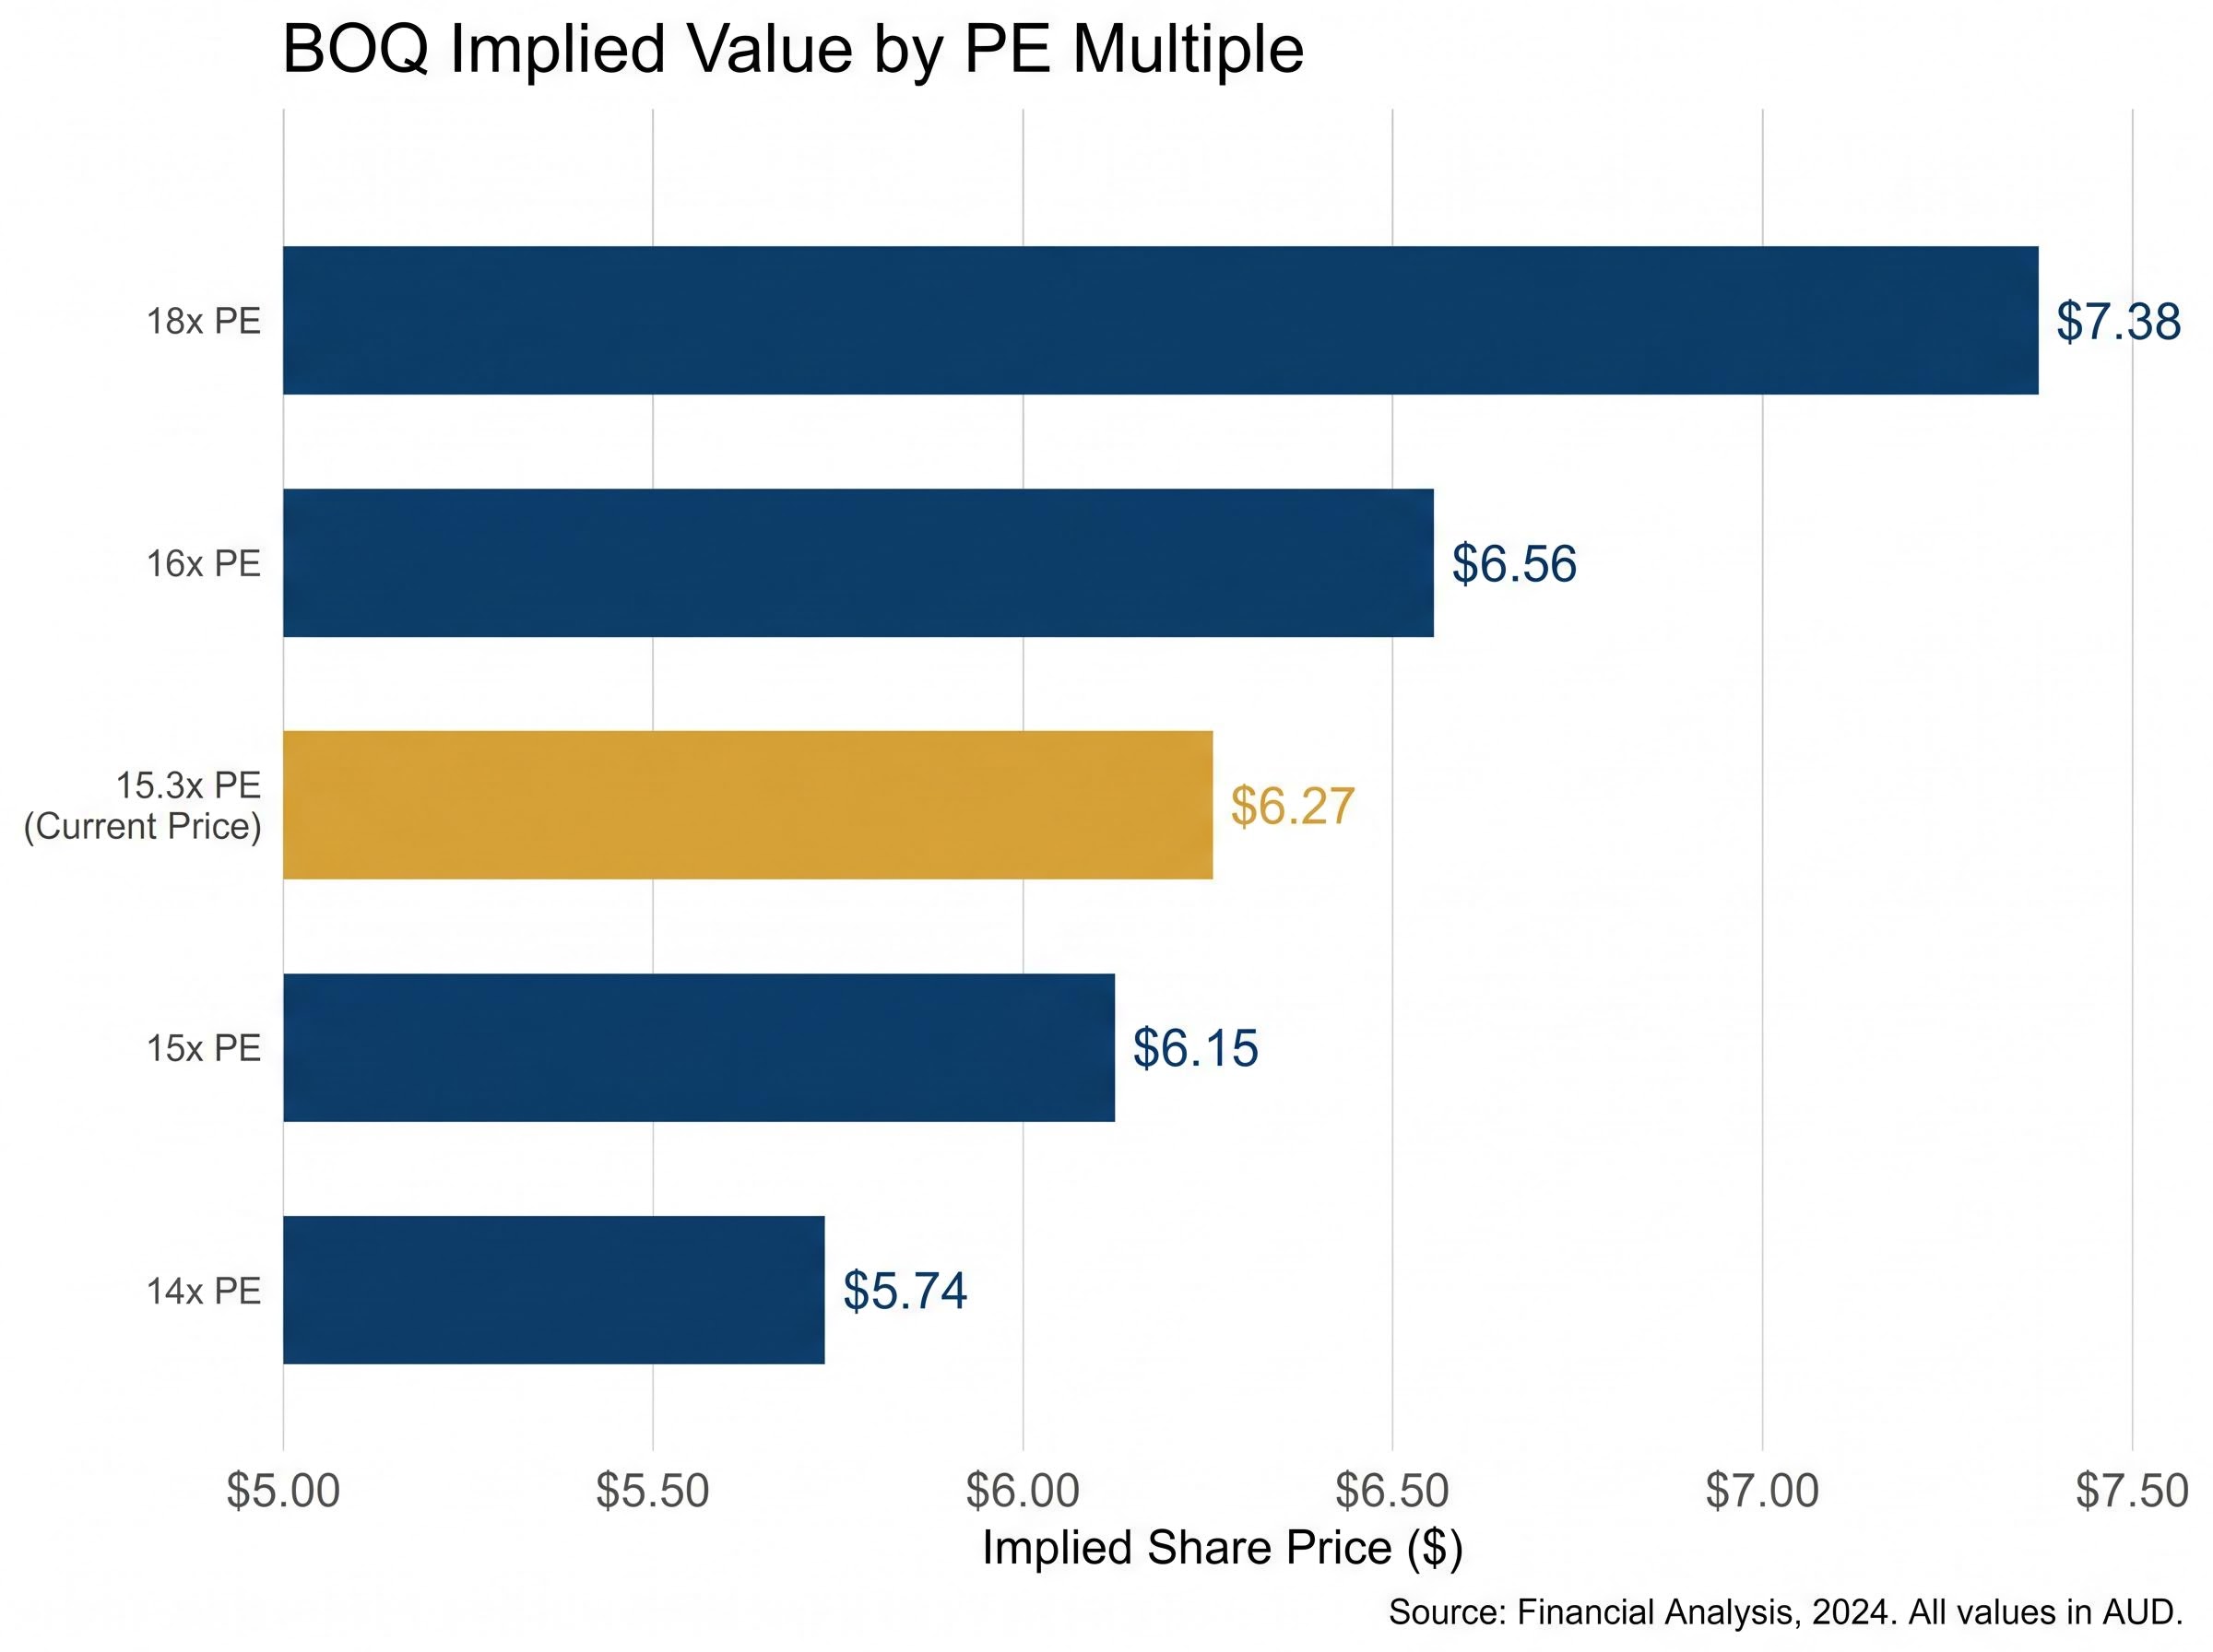
The PE valuation method is a mean-reversion argument. If BOQ traded at the sector average multiple, what price would its earnings support? The arithmetic is explicit: FY24 EPS of $0.41 multiplied by a PE of 18x equals an implied fair value of $7.38.
The question is whether 18x is a defensible multiple. No 2025 or 2026 financial news source explicitly cites 18x as a current sector average for Australian banks. The major banks trade in the low-to-mid teens on a forward basis; CBA commands the premium in the mid-to-high teens. For BOQ, 18x represents a fully valued scenario rather than a baseline assumption.
The sensitivity across a range of multiples shows where the real analytical weight falls:
| PE Multiple | Implied Value | vs $6.27 Current Price |
|---|---|---|
| 14x | $5.74 | 8.5% below |
| 15x | $6.15 | 1.9% below |
| 16x | $6.56 | 4.6% above |
| 18x | $7.38 | 17.7% above |
Assumption caveat: The 18x multiple sits at the upper range of current Australian banking sector multiples and represents a fully valued scenario. At 14-15x, the implied value is close to or below the current share price, consistent with the cautious view embedded in broker consensus. The single input that moves the PE output most is the multiple itself, not the earnings figure.
Applying the same PE ratio framework for ASX bank stocks to Bendigo and Adelaide Bank produces a sector-adjusted implied value of $15.46 against a current price of $10.40, a 49% gap that illustrates how sensitive the implied value figure is to the assumed multiple, reinforcing the point that the multiple selection carries more analytical weight than the earnings input itself.
At 15x, the implied value of $6.15 is barely distinguishable from the current price. At 16x, the upside is modest. The $7.38 figure requires investors to believe BOQ will re-rate to a full sector-average or above-average multiple, a view that assumes the remediation cost programme winds down materially and earnings normalise.
The DDM calculates a stock’s fair value as the annual dividend divided by the difference between the discount rate (the return an investor requires) and the dividend growth rate. It is a framework for answering a specific question: what is a stream of future dividends worth today?
Applied to BOQ, the model produces three distinct outputs depending on which dividend input is used:
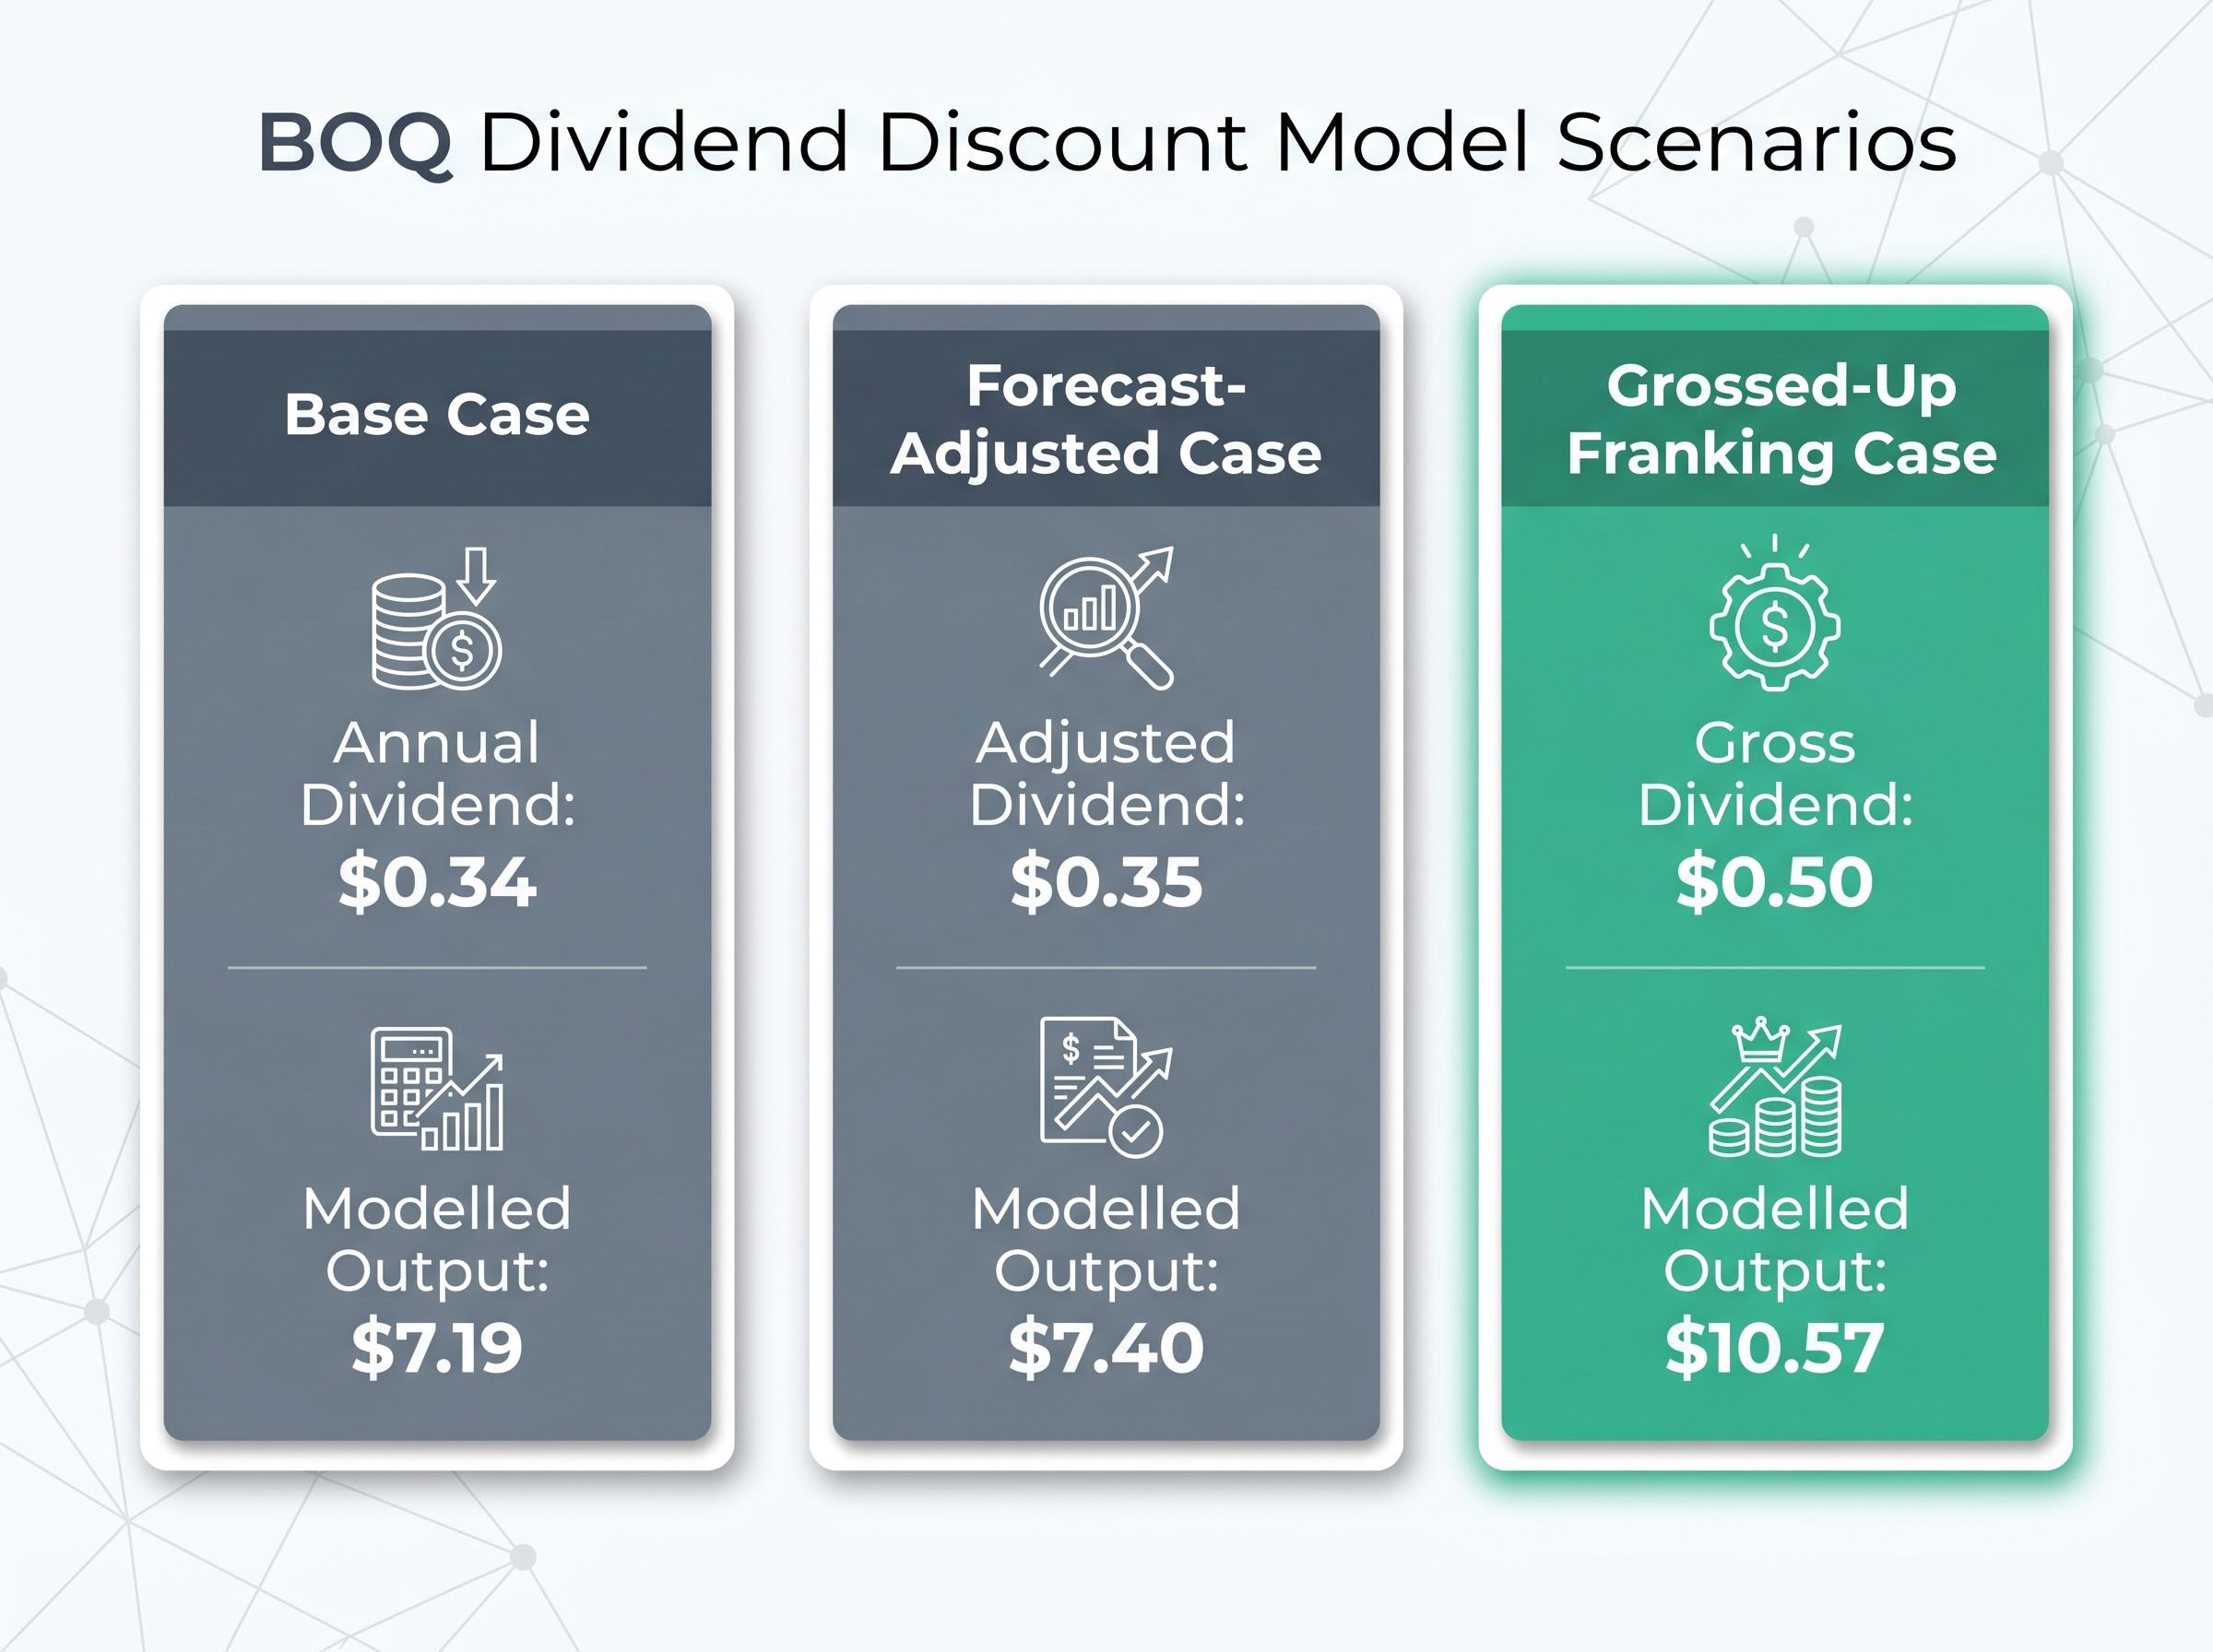
The franking credit adjustment is particularly relevant for Australian investors in higher tax brackets, where imputation credits have direct portfolio value rather than merely theoretical value. For investors outside the Australian tax system, the base case is the appropriate reference point.
The DDM’s sensitivity to its two key assumptions, discount rate and dividend growth rate, is substantial:
| Discount Rate | Growth Rate 2% | Growth Rate 4% |
|---|---|---|
| 6% | $8.50 | $17.50 |
| 8% | $5.67 | $8.50 |
| 10% | $4.25 | $5.67 |
| 11% | $3.89 | $4.86 |
The range runs from $3.89 at the pessimistic extreme (an 11% discount rate with 2% growth) to $17.50 at the optimistic extreme (a 6% discount rate with 4% growth). That is not a confident point estimate. It is a distribution of possibilities, and where BOQ lands within it depends entirely on which growth and risk-rate assumptions prove closest to reality. The base case average of $7.19 represents a midpoint across reasonable scenarios, not a prediction.
Both the PE method and the DDM produce outputs above the current share price under reasonable assumptions. Broker consensus, however, tells a different story about the market’s willingness to close that gap.
Goldman Sachs, Macquarie, and Morgan Stanley have all reportedly maintained Neutral or Hold ratings on BOQ, with price targets broadly clustered in the $6.50-$7.00 range, according to Reuters and AFR summaries. That is more conservative than the 18x PE implied value or the DDM base case, and the gap itself carries analytical meaning.
Three specific factors underpin the market’s reluctance to price BOQ at model-implied valuations:
BOQ’s cash ROE of 4.7%, well below the major bank average of approximately 12%, is one of the regional bank metrics that most directly explains why broker consensus applies a discount to model-implied values; a bank earning significantly below its cost of equity cannot sustain a full sector-average PE multiple regardless of what the remediation cost programme eventually delivers.
APRA’s APS 110 capital adequacy standard sets the foundational requirements for how much regulatory capital Australian authorised deposit-taking institutions must hold against their risk exposures, directly constraining the pace at which BOQ can grow dividends or execute buybacks without first demonstrating sustained earnings improvement.
The $7.38 PE scenario assumes BOQ achieves a full sector-average re-rating, which requires the remediation cost programme to wind down materially. No confirmed corporate event since January 2025, such as a merger or strategic review, has emerged to catalyse that re-rating independently.
PE and DDM models are inputs to an investment thesis, not outputs. They narrow the probability distribution of fair value but cannot eliminate the uncertainty that sits at the heart of any single-stock position. The EPS input of $0.41 is backward-looking, drawn from BOQ’s FY24 results. The 1H25 interim result was characterised as slightly below consensus, raising the question of whether forward earnings will sustain, exceed, or fall short of that baseline.
The qualitative dimensions behind bank valuations, including management credibility, loan-book discipline, and governance track record, are the factors that determine whether a bank’s reported EPS will hold up over successive reporting periods, and they are precisely the inputs that PE ratios and DDM models cannot interrogate.
BOQ’s financial year runs September to August, meaning FY25 full-year results will not be available until approximately October 2025. Between now and then, the models rest on assumptions rather than confirmed data.
Four due-diligence steps give model outputs more or less credibility:
Averaging multiple DDM scenarios and running PE sensitivity across a range of multiples reduces the risk of anchoring on a single misleading figure. No single model output should be treated as a price target.
Both valuation methods, under reasonable assumptions, produce outputs above the current share price. Both broker consensus targets and model outputs converge in a specific zone. The PE method at 15x implies $6.15; at 16x, it implies $6.56; at 18x, it reaches $7.38. The DDM base case averages $7.19. Broker targets cluster in the high $6s to low $7s.
Under realistic (not optimistic) inputs, both models and broker consensus converge on a fair value range in the high $6s to low $7s. The current share price of approximately $6.27-$6.38 sits at or just above the 15x PE implied value, suggesting the market is already pricing in a modest recovery scenario, not ignoring BOQ entirely.
The grossed-up DDM output of $10.57 is a ceiling case relevant only to investors with full franking credit utility. It should not be treated as a typical baseline scenario.
Two observable conditions would signal the valuation discount is beginning to close:
The models suggest BOQ is not expensive. The path to meaningful upside, however, requires specific fundamental improvements that are observable and testable in future results. Until those improvements materialise in reported numbers, the gap between model-implied value and market price may reflect the market pricing risk correctly rather than mispricing an opportunity.
Investors who reach a positive view on BOQ through PE and DDM analysis still face a portfolio construction question that the models cannot answer: whether holding an individual bank stock against a diversified ETF such as VAS represents a superior risk-return trade-off given the monitoring commitment and concentration risk that a single regional bank position introduces.
This article is for informational purposes only and should not be considered financial advice. Investors should conduct their own research and consult with financial professionals before making investment decisions. Past performance does not guarantee future results. Financial projections are subject to market conditions and various risk factors.
The Dividend Discount Model calculates a stock's fair value by dividing the annual dividend by the difference between the required return rate and the expected dividend growth rate. Applied to BOQ, the base case uses an annual dividend of $0.34 per share and produces an average implied value of approximately $7.19, which is above the current share price of around $6.27.
BOQ trades below model-implied valuations primarily due to ongoing IT remediation costs depressing near-term earnings, APRA capital constraints limiting dividend growth and buybacks, and execution risk around its core banking transformation programme, all of which broker consensus reflects through Neutral or Hold ratings and price targets clustered in the $6.50-$7.00 range.
Based on FY24 earnings per share of $0.41, BOQ is trading at an implied price-to-earnings multiple of approximately 15.3x at the $6.27 share price, which sits within the broad Australian banking sector range but reflects the market pricing BOQ as a bank still working through its transition rather than one that has completed it.
When franking credits are included, the grossed-up dividend rises to approximately $0.50 per share, producing a DDM implied value of $10.57 for investors who can fully utilise imputation credits. This ceiling case is most relevant to Australian investors in higher tax brackets where franking credits have direct portfolio value rather than theoretical value only.
Two observable triggers would suggest the gap between market price and model-implied value is narrowing: a visible reduction in the IT remediation and cost run-rate appearing in future results commentary, and EPS stabilisation or recovery above the FY24 baseline of $0.41 confirming that cost reduction is translating into earnings improvement.