Finfluencer Rules Won’t Work Until the Penalty Beats the Profit
2 hrs ago

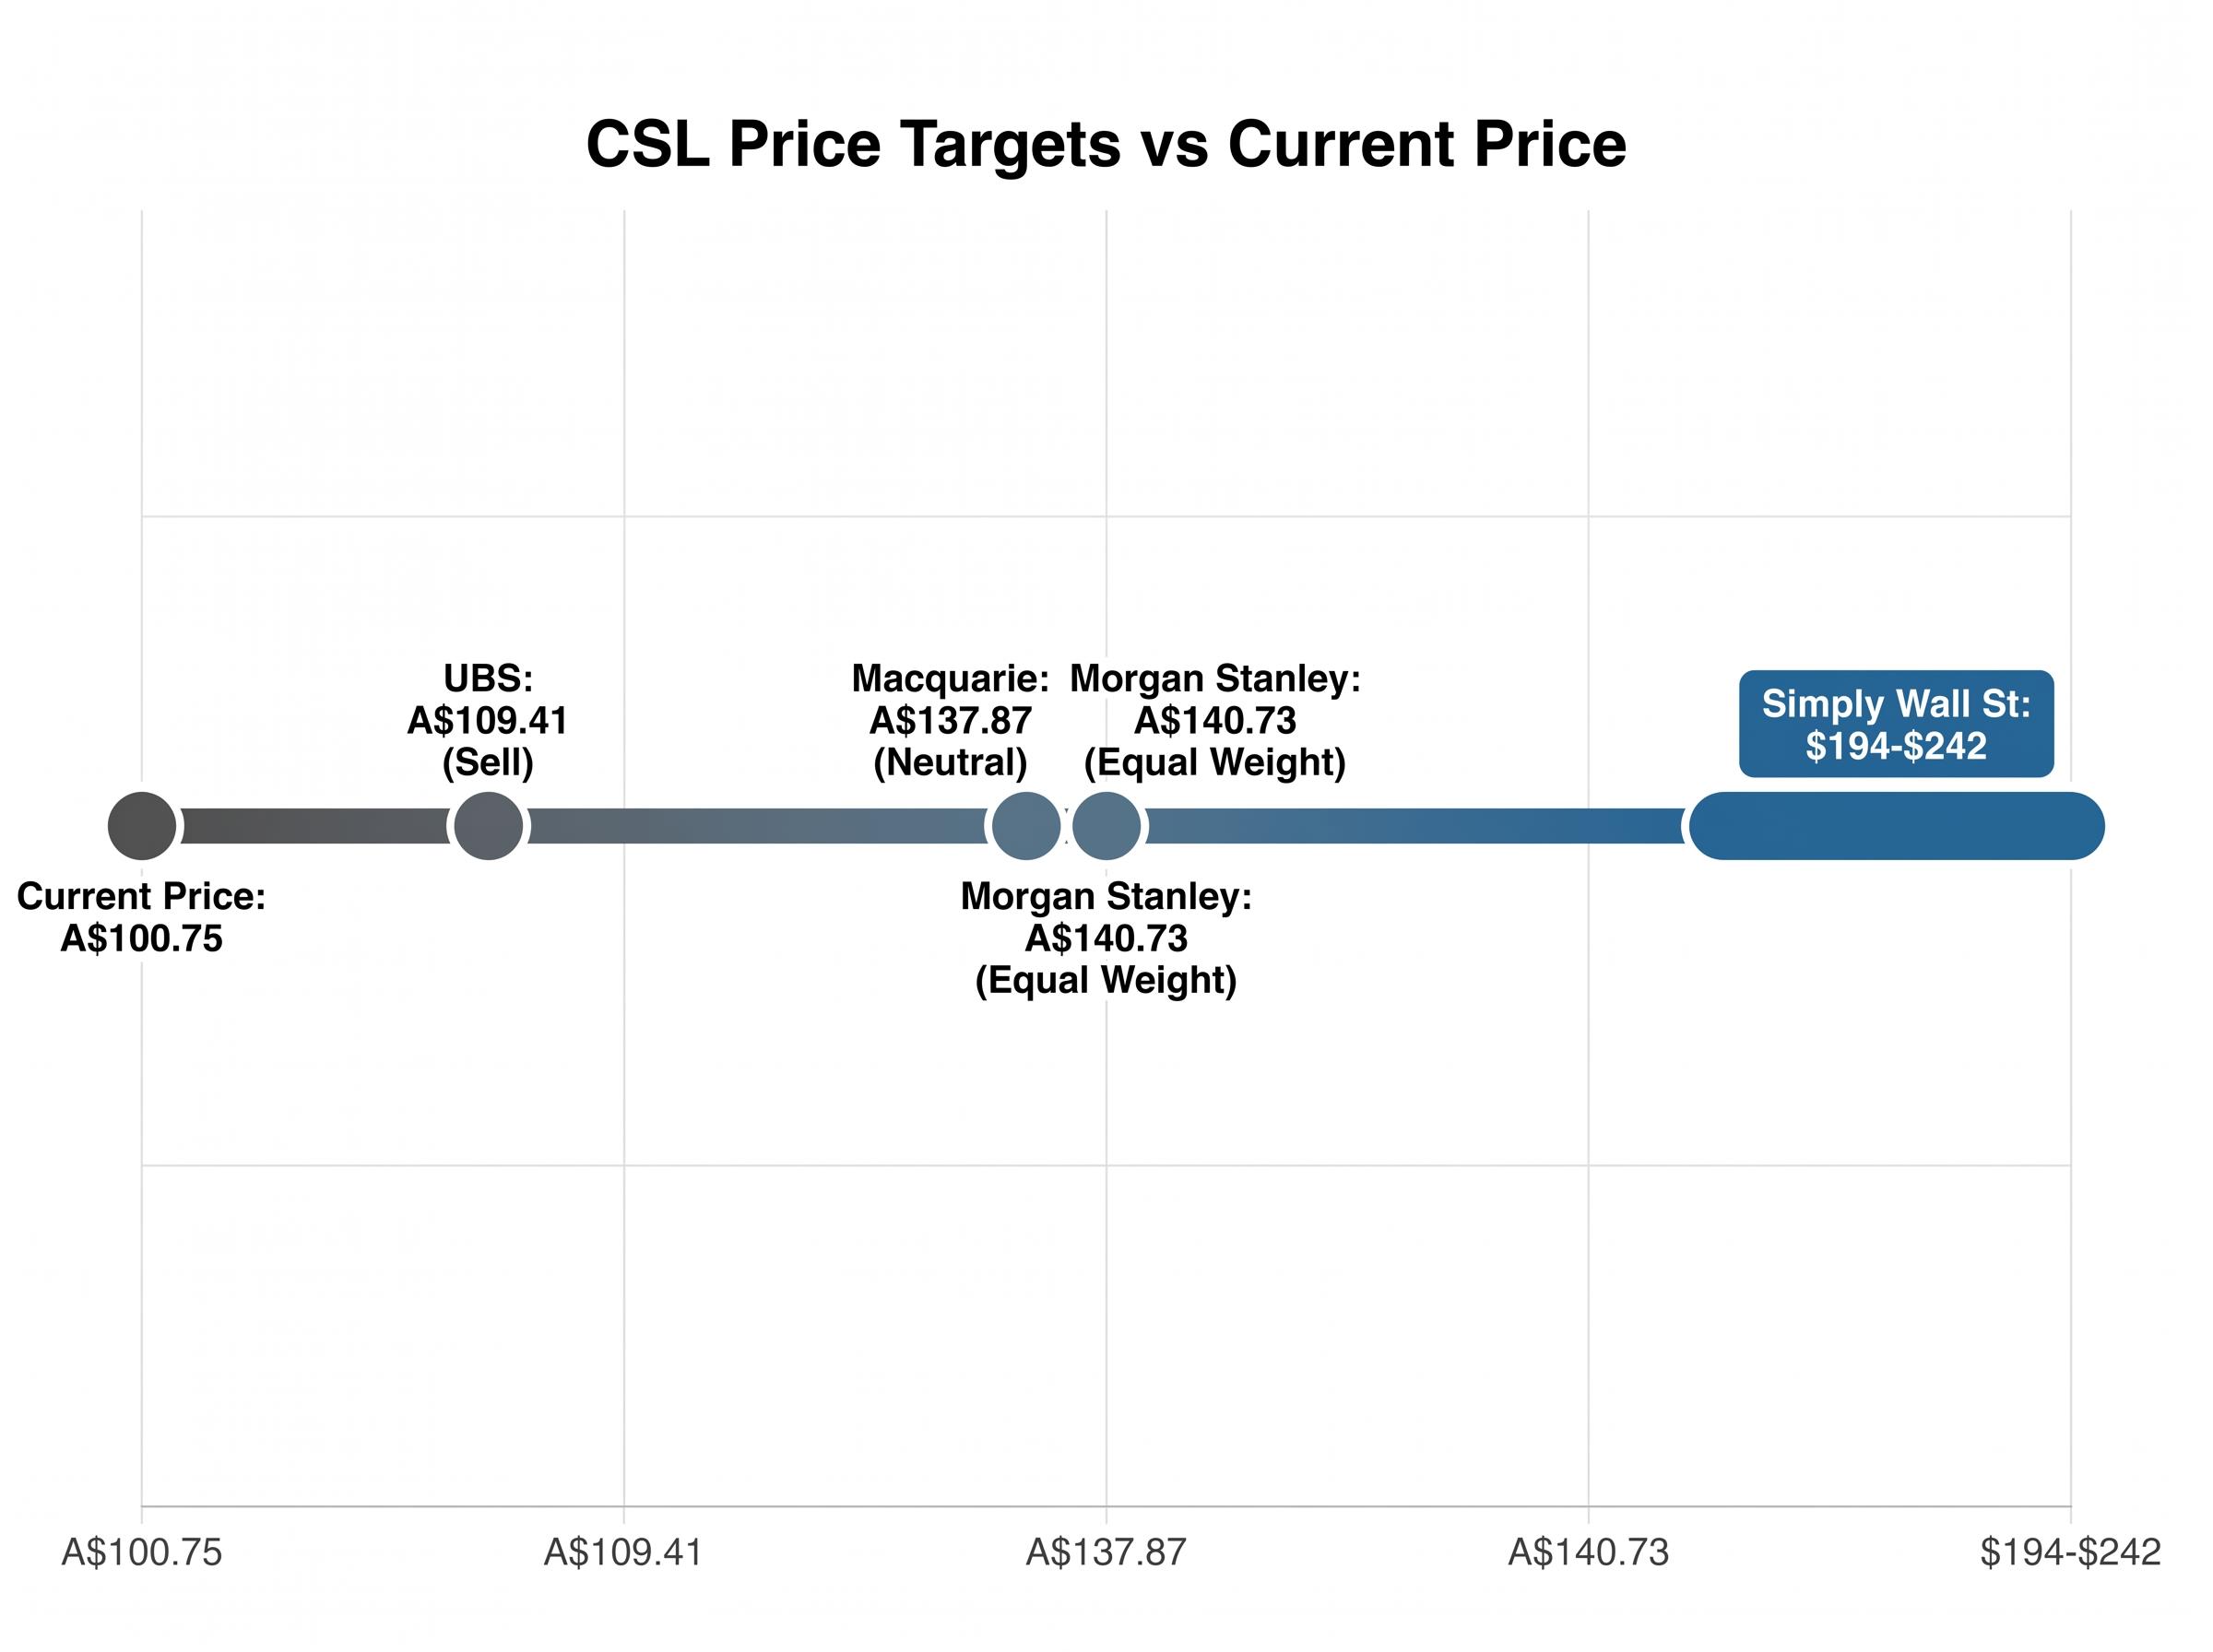
CSL shares are trading at approximately A$100.75, a level last seen a decade ago. Yet analysts at Morgan Stanley and Macquarie still hold price targets of A$137-A$141, while UBS sits at A$109.41 with a Sell rating. That gap, stretching from marginal upside to more than 40% recovery, is the question every Australian investor interested in this stock must answer. The 63.5% decline from CSL’s 52-week high of A$275.79 is not a routine correction. It reflects a confluence of guidance downgrades, an approximately A$5 billion impairment cycle tied to the CSL Vifor acquisition, and a structural reset of the company’s long-term growth profile from low-teens to high-single-digit earnings growth. For investors who have historically treated CSL as a reliable defensive compounder, the current moment demands a fresh analytical lens. This article applies the financial toolkit most appropriate for evaluating a mature blue-chip healthcare business under stress, walks through each division’s distinct outlook, presents the bull and bear cases with equal weight, and identifies the specific checkpoints to monitor from here.
The decline did not arrive in a single event. It compounded across three distinct credibility ruptures, each one deepening institutional scepticism about forward earnings.
Each of these three guidance revisions constituted a material market event under the ASX continuous disclosure obligations under Listing Rules 3.1 and 3.1A, which require listed entities to immediately disclose information a reasonable person would expect to materially affect the price or value of their securities — the regulatory framework that compelled each announcement rather than leaving disclosure to management discretion.
The first rupture came at CSL’s Annual General Meeting on 28 October 2025, when management cut FY26 revenue growth guidance from 4-5% to 2-3% and underlying NPATA growth from 7-10% to 4-7%. More significantly, the long-term FY27-FY28 growth target was revised from low-teens to high-single digits. That single downgrade reframed the investment case from a growth compounder to a slower-growth healthcare operator.
Growth profile reset: FY27-FY28 earnings growth guidance was cut from low-teens to high-single digits at the October 2025 AGM, structurally de-rating the long-term compounding thesis that had underpinned CSL’s premium valuation for over a decade.
The second rupture arrived with the HY26 results on 24 February 2026, where statutory NPAT fell 81% on restructuring charges and impairments, even as underlying revenue grew 4% and underlying NPATA grew 7% in line with the downgraded guidance.
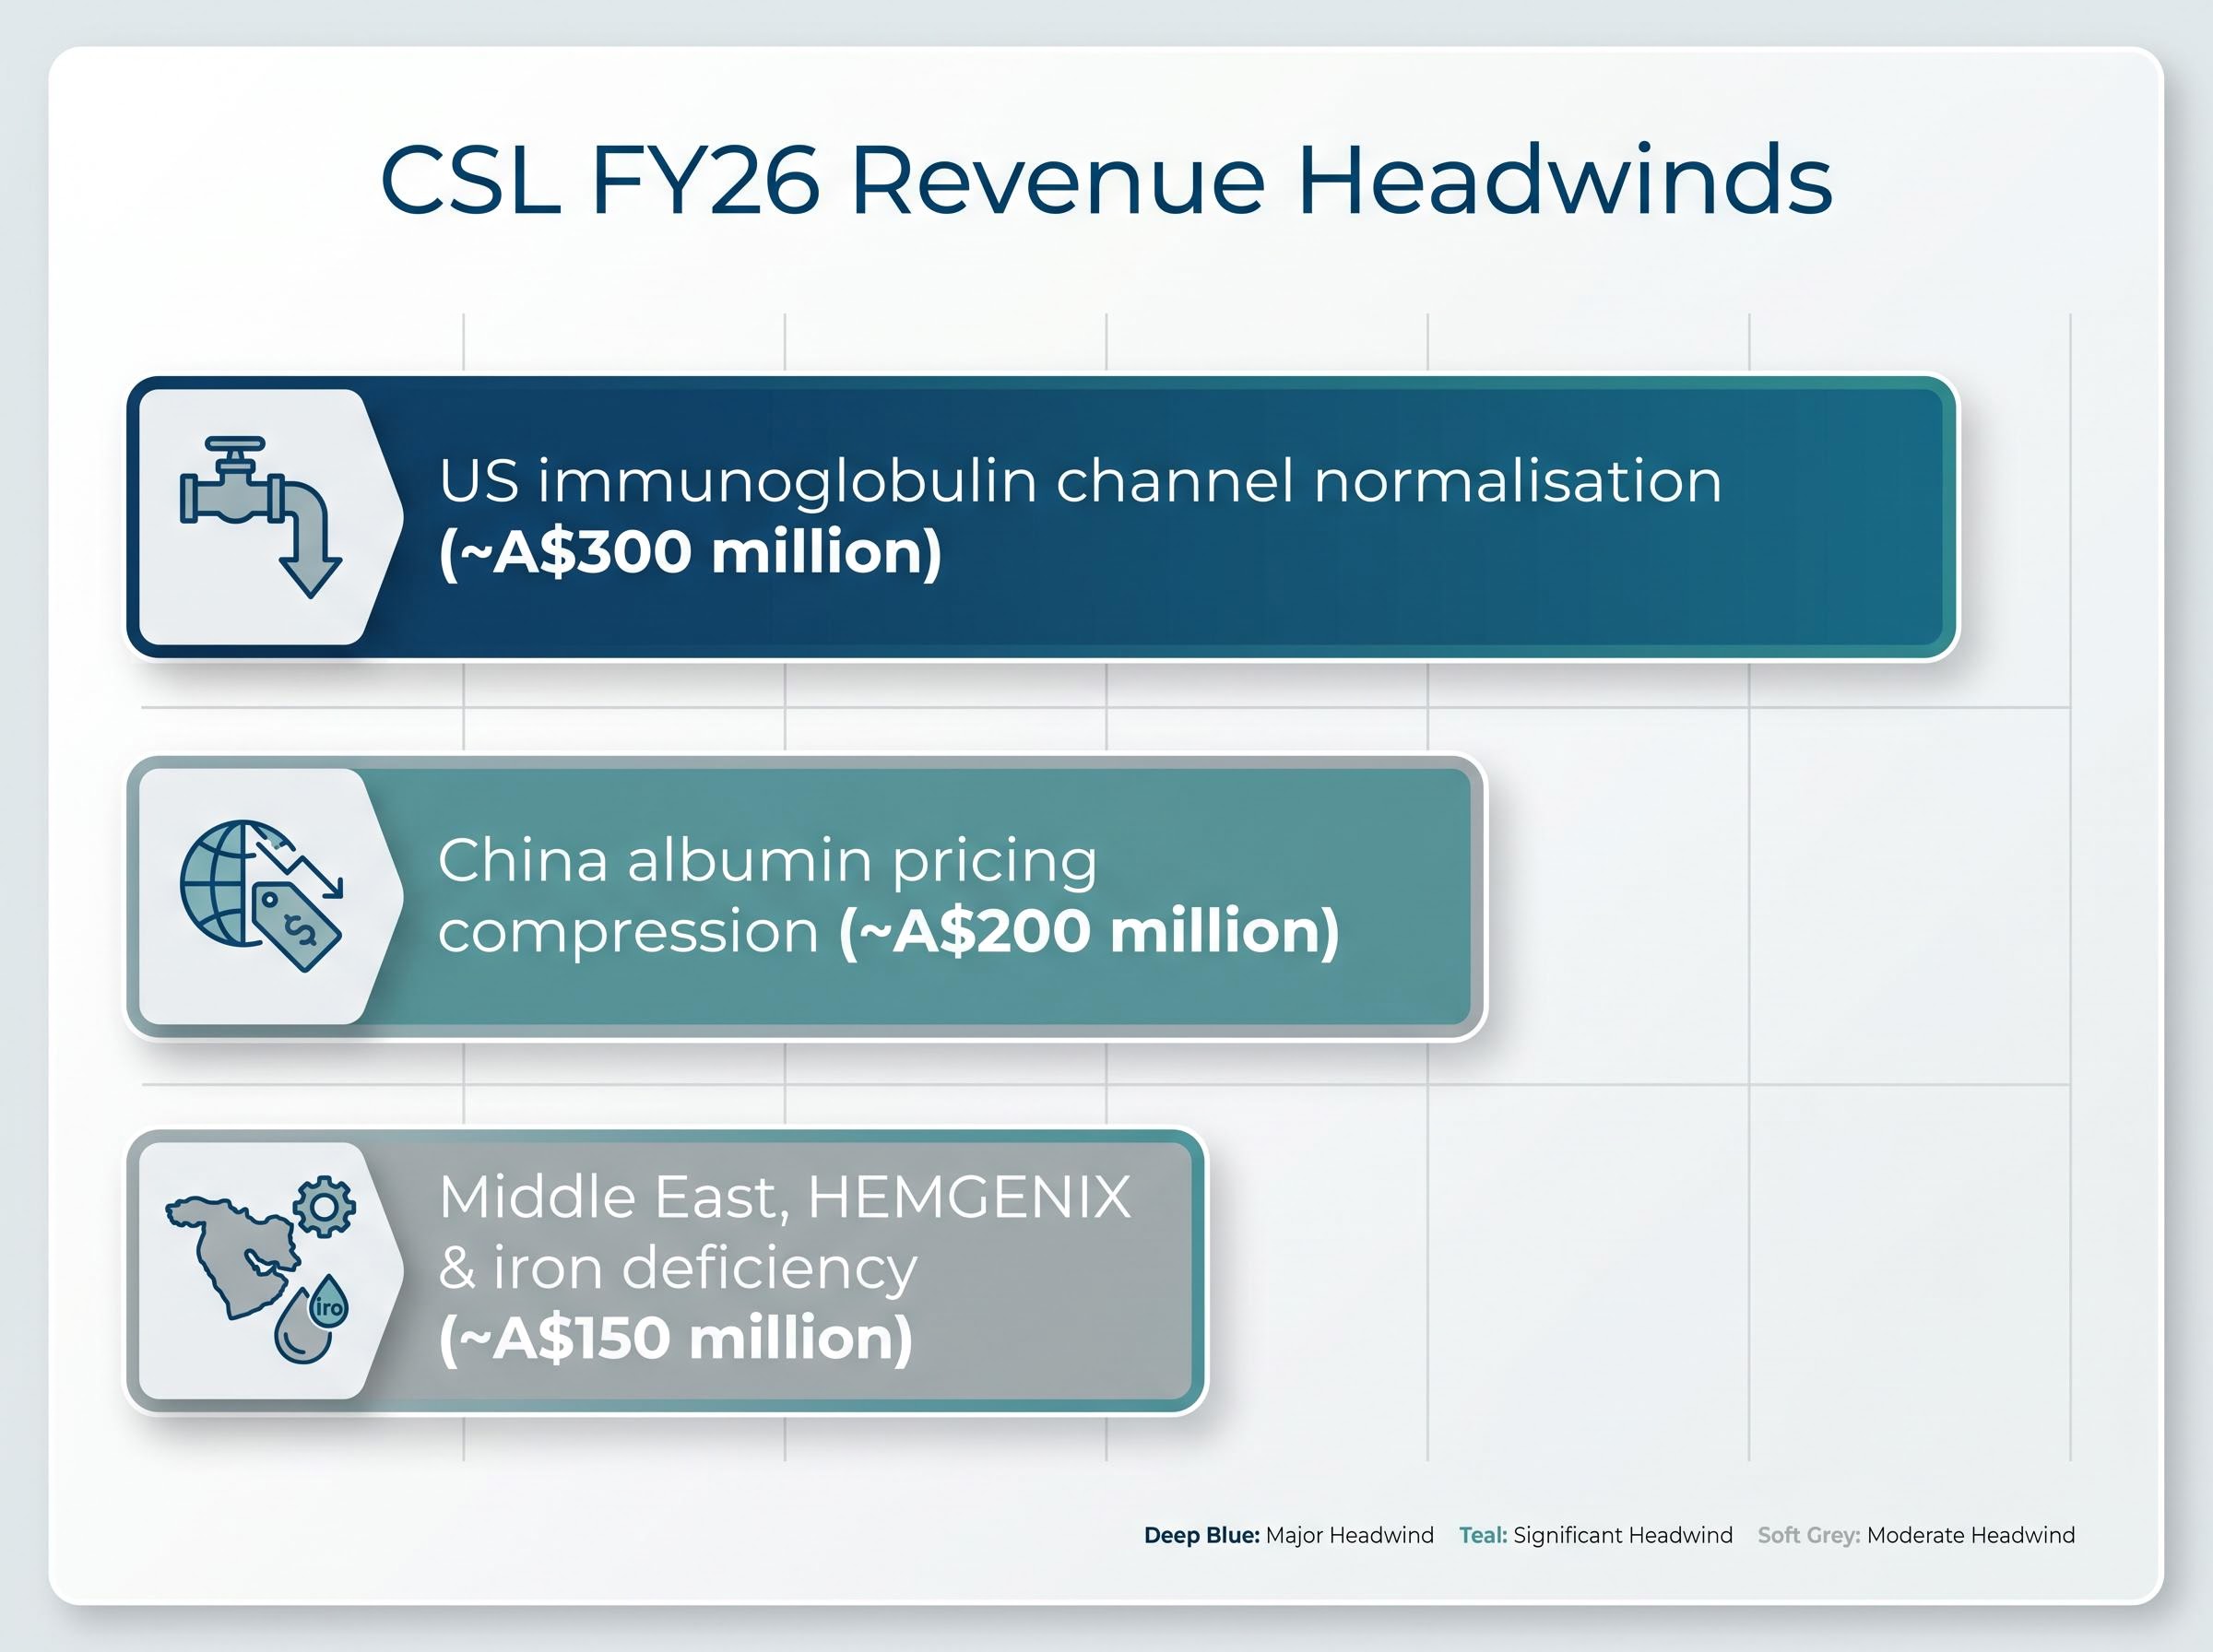
The third, and most damaging, came on 11 May 2026 when the interim CEO’s 90-day review quantified the total impairment bill at approximately A$5 billion pre-tax across FY26-FY27. That review also identified three distinct revenue headwinds for FY26:
FY26 revenue guidance now sits at approximately A$15.2 billion, with underlying NPATA guided to approximately A$3.1 billion. Year-to-date, shares have fallen approximately 41%.
The instinct when a share price falls 64.8% is to reach for the same metrics that identified it as a buy on the way up: revenue growth trajectory, earnings momentum, and forward price-to-earnings expansion. For a mature, capital-intensive healthcare business carrying A$5 billion in impairments, that instinct leads to the wrong questions.
The metrics that matter most at this juncture assess something different. Debt-to-equity ratio reveals whether the balance sheet can absorb the impairment cycle without forced capital raising. Return on equity (ROE), the profit a company generates relative to shareholder funds, reveals whether the underlying business is still converting capital into returns efficiently. And dividend yield at current price levels reveals the income signal embedded in the dislocation, a signal that can be genuine or misleading depending on its source.
Two of the five fundamental analysis metrics that matter most at inflection points like this one are return on equity and debt-to-equity: ROE reveals whether a business is still converting capital efficiently, while the debt-to-equity ratio determines whether the balance sheet can absorb a sustained impairment cycle without forcing a capital raise.
Applying growth-stock logic to CSL at this moment, focusing primarily on when earnings growth re-accelerates to justify a higher price-to-earnings multiple, misses the structural questions about financial foundation that must be answered first.
| Metric | CSL FY24 Value | Benchmark | Interpretation |
|---|---|---|---|
| Debt-to-Equity Ratio | 62.8% | Below 100% (equity exceeds debt) | Positive: balance sheet retains capacity, though post-impairment gearing requires updated confirmation |
| Return on Equity | 14.6% | Above 10% blue-chip benchmark | Positive: capital efficiency remains above the threshold for quality operators |
| Forward Dividend Yield (FY26E) | ~5.1% | Historical average ~1.5% since 2020 | Flag: elevated yield reflects price compression, not dividend growth; sustainability depends on earnings recovery |
The FY24 debt-to-equity ratio of 62.8% indicates equity exceeds total debt, a positive indicator for balance sheet stability. The FY24 ROE of 14.6% sits comfortably above the 10% blue-chip benchmark, suggesting the underlying business continues to generate reasonable returns on shareholder capital.
The forward dividend yield warrants particular scrutiny. At an estimated FY26 dividend per share of approximately A$5.16 and a share price of A$100.75, the implied yield of approximately 5.1% is more than three times CSL’s historical average of roughly 1.5%. That anomaly is a function of price compression, not a change in dividend policy. Income-focused investors should note the distinction carefully.
One important caveat: the post-impairment balance sheet and updated debt profile following the approximately A$5 billion write-down are not yet fully confirmed. Investors should consult CSL’s most recent financial statements for current gearing ratios before relying on the FY24 figures above.
CSL’s risk profile is not uniform. Its three operating divisions face materially different near-term outlooks, and the investment question is partly about which division’s trajectory dominates the next two to three years.
CSL Behring, the plasma-derived therapies division, remains the foundation of the bull case. Underlying global plasma demand continues to grow at mid-to-high single digits. The problem is a one-time US immunoglobulin channel normalisation headwind worth approximately A$300 million in FY26, masking that demand signal in reported revenue.
Management expects H2 FY26 to show recovery as channel inventory normalises. Supporting that expectation, CSL announced a new US$1.5 billion five-year plasma manufacturing capital expenditure programme on 18 November 2025, bringing total plasma manufacturing investment to over US$3 billion since 2018. That level of capital commitment signals long-term confidence in the franchise.
CSL Seqirus, the influenza vaccines business, is set to be demerged into a standalone ASX-listed entity by June 2026. The rationale is strategic autonomy: separating two distinct business profiles so each can attract its own investor base and capital allocation logic.
No regulatory hurdles have been publicly flagged, and the timeline remains end of FY26. For current CSL shareholders, the demerger changes what the remaining listed entity looks like, concentrating it around the plasma and kidney care businesses.
The CSL Vifor acquisition has become the central source of value destruction. The approximately A$5 billion in pre-tax impairments across FY26-FY27, covering intangibles, product portfolio write-downs, and under-utilised property, plant and equipment, represents a crystallisation of acquisition overpayment risk.
Competitive pressures in iron deficiency treatment continue to weigh on revenues. China albumin pricing compression, worth approximately A$200 million in FY26, adds a structural headwind. Volumes in the China albumin market remain stable; it is pricing that is compressing, a distinction that matters for projecting future revenue.
The bull case is structural. The plasma moat remains intact, with mid-to-high single-digit underlying demand growth. The transformation programme front-loads financial pain into FY26, meaning the worst of the restructuring costs (US$700-770 million) and impairments should be absorbed before FY27. Management’s capital allocation signals, a A$750 million share buyback authorised on 18 November 2025 and the US$1.5 billion capex programme, suggest confidence in long-term franchise value. The Seqirus demerger may unlock value currently obscured within the conglomerate structure.
The transformation programme savings target of A$500-550 million in annualised savings by FY28, which underpins management’s confidence that the current cycle front-loads pain rather than permanently impairs the earnings base, is the financial counterweight to the A$5 billion impairment disclosure and the primary lever through which the bull case expects a FY27-FY28 re-rating.
The bear case is credibility-driven. UBS maintains a Sell rating with a target of A$109.41, implying only marginal recovery from current levels. Multiple consecutive guidance downgrades have damaged institutional trust. The growth profile has been permanently reset from low-teens to high-single digits, which structurally de-rates the price-to-earnings multiple the market should be willing to pay.
| Broker | Price Target (A$) | Rating | Implied Upside |
|---|---|---|---|
| Macquarie | $137.87 | Neutral | ~36.9% |
| Morgan Stanley | $140.73 | Equal Weight | ~39.7% |
| UBS | $109.41 | Sell | ~8.6% |
| Simply Wall St (model estimate) | $194-$242 | N/A | ~93-140% |
The unresolved variable: Whether the transformation programme delivers the promised H2 FY26 Behring recovery and positions CSL for a FY27-FY28 re-rating, or whether further downside revisions emerge. That single question separates the bull and bear thesis at current levels.
The analytical task for investors is not picking the right target from a range spanning A$109 to A$242. It is understanding what set of assumptions each target requires, and which of those assumptions the next two reporting periods will either validate or disprove.
Macro factors neither rescue nor doom the CSL thesis on their own, but they tilt the probability distribution in ways investors should consciously account for.
One macro variable not captured in the headline headwinds is CSL’s US tariff exemption on plasma-derived therapies: the Section 232 Proclamation exemption protects core US plasma revenues from import duties effective September 2026, a positive regulatory outcome for the bull case that partially offsets the AUD/USD translation risk and the China pricing compression discussed above.
Structural tailwind: Global plasma demand growth of mid-to-high single digits underpins the entire Behring recovery thesis. This is the long-term demand signal that the bull case requires to remain intact through the current cycle of disruption.
A decade-low share price is a necessary but not sufficient condition for value. The decline reflects a genuine reset in the company’s earnings growth trajectory, not purely a sentiment overshoot.
For investors wanting to understand why a decade-low share price does not automatically signal a buying opportunity, a deeper examination of what a fundamental valuation floor actually requires — including a confirmed permanent CEO, a credible new earnings narrative, and at least one clean reporting period — identifies the specific conditions analysts treat as prerequisites before institutional consensus can form around a recovery price.
Rebuilding institutional trust after multiple consecutive guidance downgrades requires visible delivery across multiple reporting periods. A single quarter will not resolve the credibility deficit. The A$750 million buyback provides an ongoing capital return signal, but execution pace matters as much as authorisation.
HY26 underlying results (revenue +4%, underlying NPATA +7%) delivered in line with the downgraded guidance. That is a small credibility positive, though it remains a single data point against a pattern of missed expectations.
The analytical picture is clear on what has not broken: plasma demand remains structurally sound, CSL’s dividend capacity at current levels implies a historically anomalous 5.1% forward yield, and the balance sheet entered this cycle with equity exceeding total debt. What has changed permanently is the growth profile, the institutional trust deficit, and the approximately A$5 billion in destroyed acquisition value that the Vifor impairments represent.
The analyst disagreement, from A$109.41 to approximately A$242, is not noise. It is a genuine signal that this is a high-uncertainty situation where reasonable assumptions produce vastly different valuations. For Australian investors, the most productive approach is monitoring the four checkpoints above rather than anchoring to a single target. CSL’s investor relations page (investors.csl.com) and ASX announcements for Seqirus demerger milestones are the primary resources to track.
This article is for informational purposes only and should not be considered financial advice. Investors should conduct their own research and consult with financial professionals before making investment decisions. Past performance does not guarantee future results. Financial projections are subject to market conditions and various risk factors.
CSL shares have fallen approximately 41% year-to-date and around 63.5% from their 52-week high due to three consecutive guidance downgrades, an approximately A$5 billion impairment cycle tied to the CSL Vifor acquisition, and a permanent reset of long-term earnings growth from low-teens to high-single digits.
Return on equity (ROE) measures the profit a company generates relative to shareholder funds; CSL's FY24 ROE of 14.6% sits above the 10% blue-chip benchmark, indicating the underlying business is still converting capital efficiently despite the current restructuring cycle.
Investors should track the Seqirus demerger completion by June 2026, H2 FY26 CSL Behring revenue recovery from US immunoglobulin channel normalisation, FY26 restructuring cost delivery within the US$700-770 million guided range, and the credibility of the first FY27 guidance issuance.
The planned demerger of CSL Seqirus into a standalone ASX-listed entity by June 2026 will concentrate the remaining CSL business around plasma therapies and kidney care, potentially unlocking value currently obscured within the conglomerate structure and allowing each business to attract its own investor base.
The elevated forward dividend yield of approximately 5.1% reflects share price compression rather than a change in dividend policy; CSL's historical average yield has been around 1.5% since 2020, so the anomaly is a function of the price decline and its sustainability depends on earnings recovery.