CSL fell from A$342.75 to A$98.59 over roughly six years. The decline included four separate guidance downgrades, a 17.7% single-day collapse on 11 May 2026, and approximately US$5 billion in impairment charges flagged across FY26 and FY27. Throughout every stage of that drawdown, not one covering broker issued a sell rating. As of today, consensus targets from major platforms imply 96-113% upside on a stock trading at a nine-and-a-half-year low, with zero sell recommendations across all tracked coverage. The CSL share price trajectory and the analyst ratings that accompanied it raise a structural question that extends well beyond a single company: what does broker consensus actually measure, and what happens when investors treat it as something it was never designed to be?
From A$342 to A$99: how CSL’s collapse unfolded across four guidance cuts
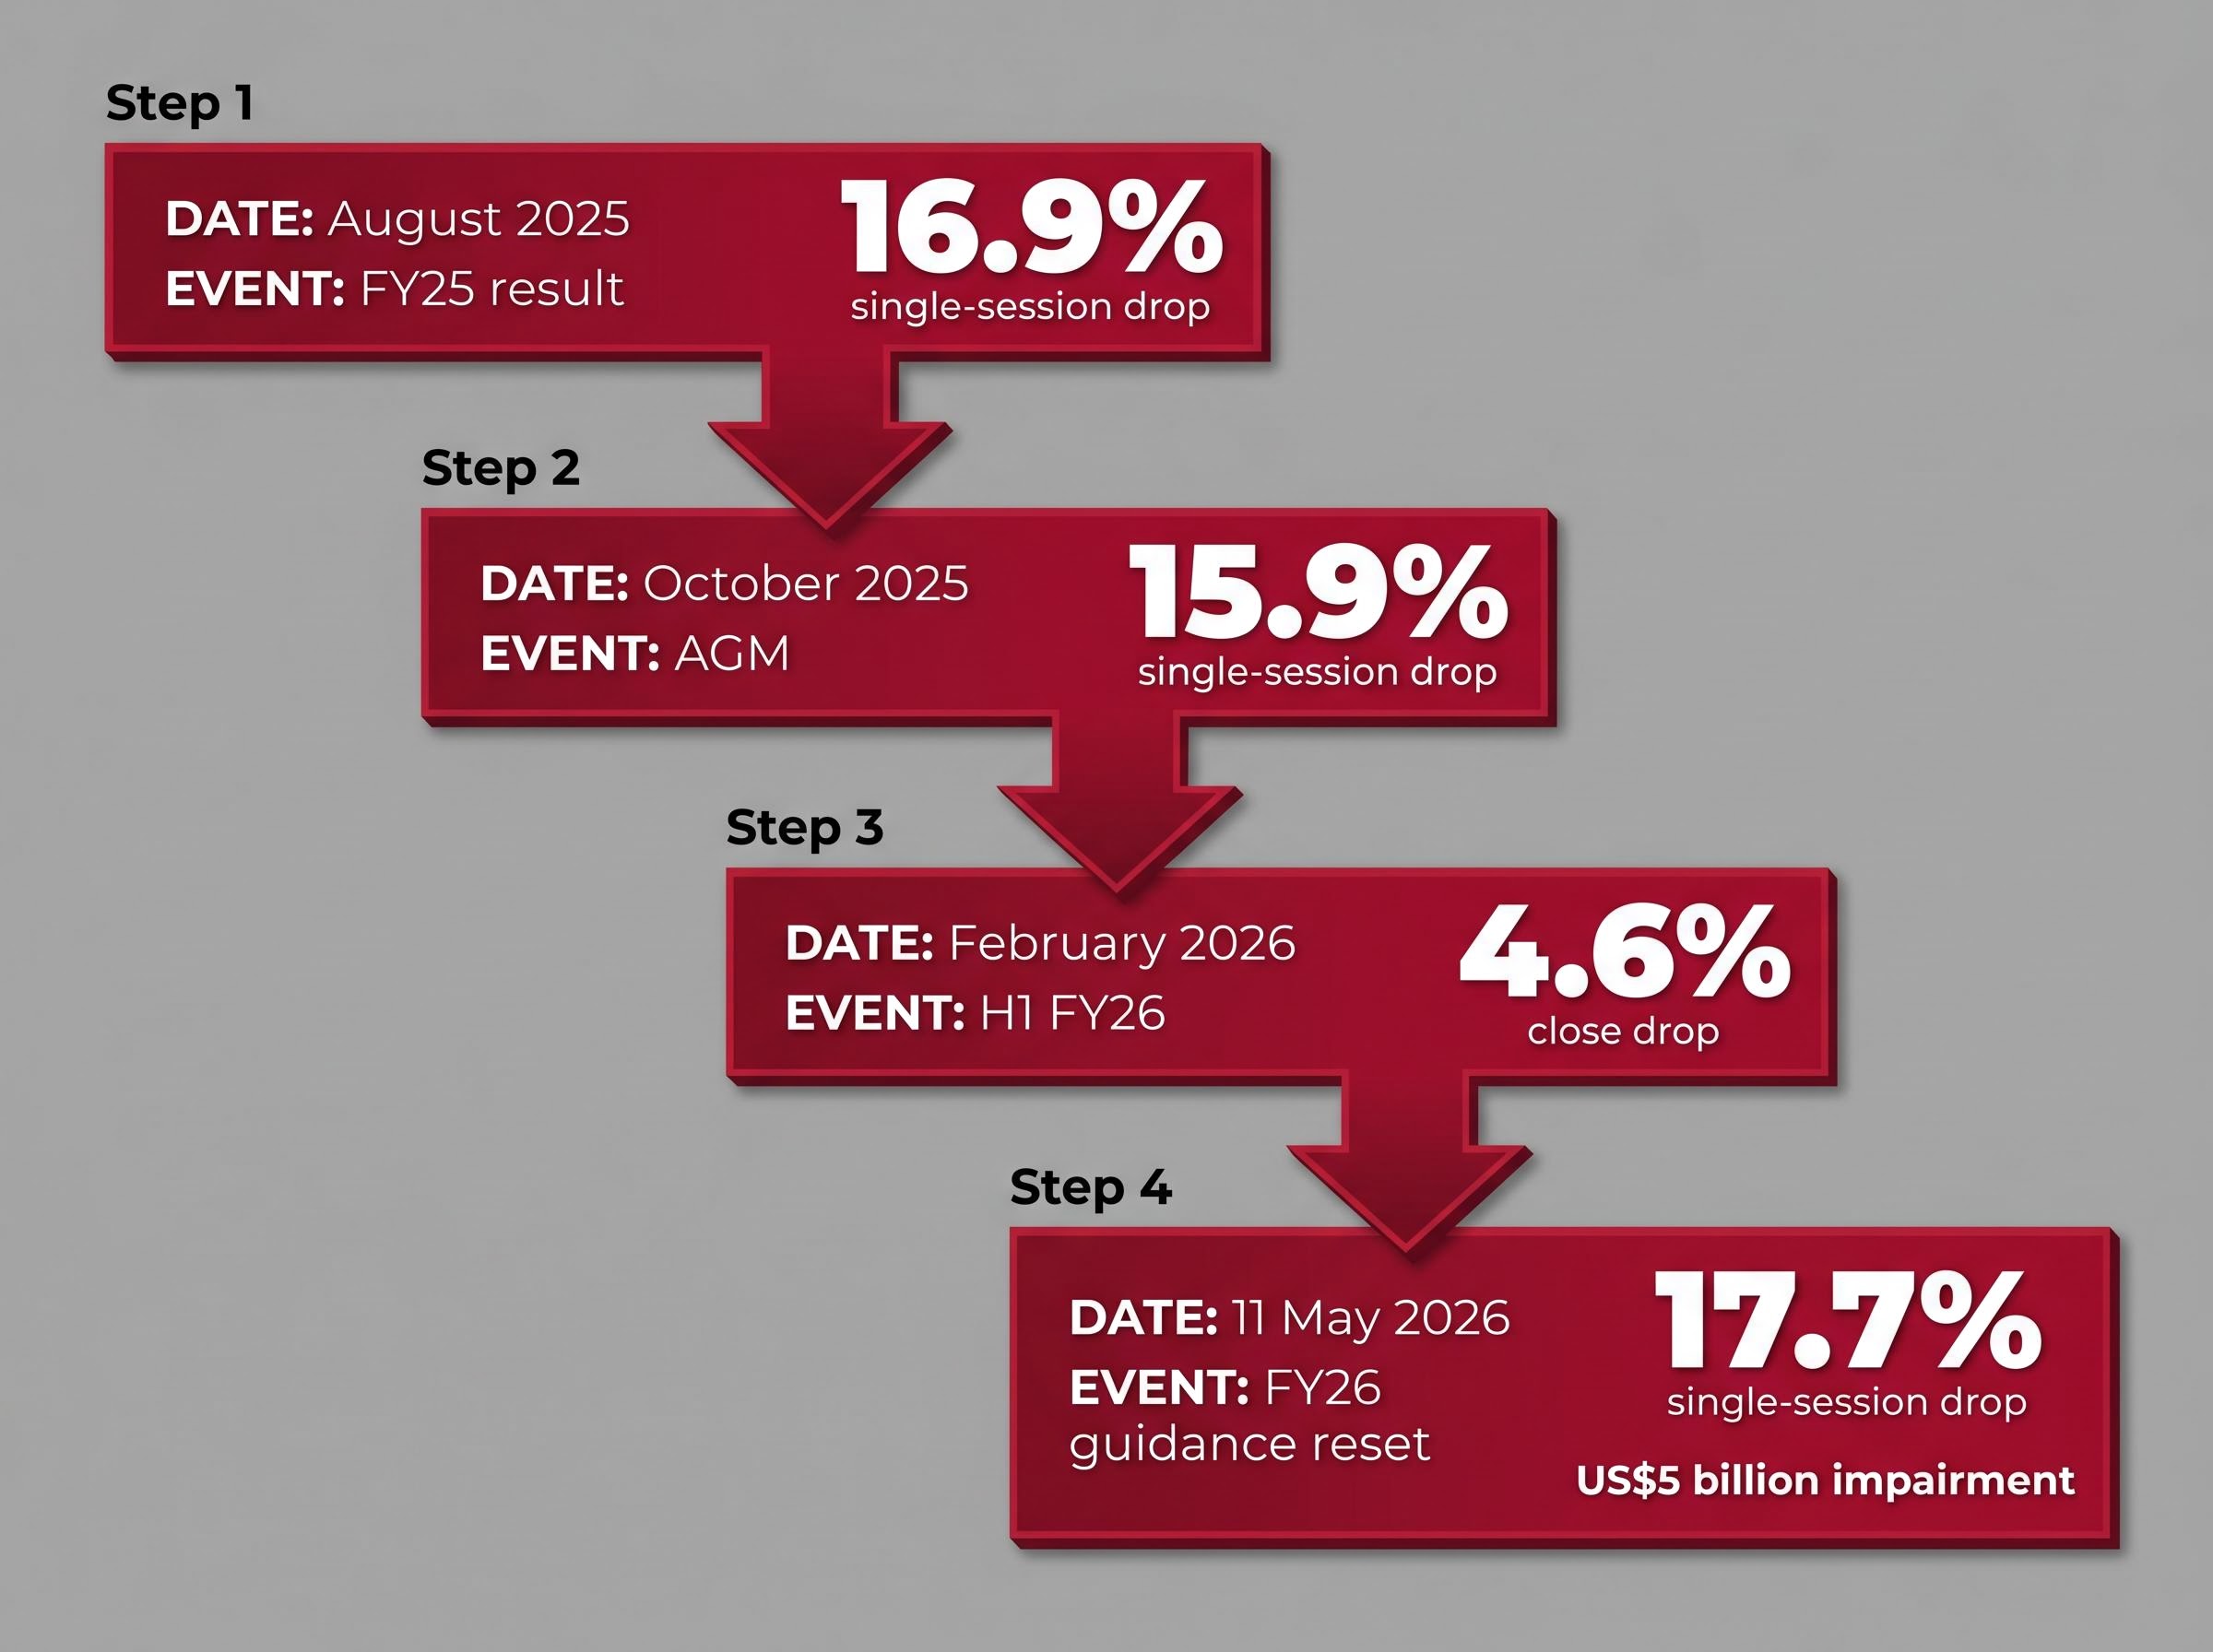
The decline did not arrive as a single shock. It compounded across four distinct guidance events, each accompanied by management explanations that framed the setback as temporary and analyst reassurances that recovery was imminent.
- August 2025 (FY25 result): CSL reported full-year earnings that fell short of expectations, citing persistent weakness in the Seqirus influenza division and slower-than-projected cost normalisation in plasma collection. The stock fell 16.9% in a single session.
- October 2025 (AGM): At the annual general meeting, management flagged further integration challenges related to the Vifor Pharma acquisition. A further 15.9% single-session decline followed.
- February 2026 (H1 FY26): Half-year results revealed margin pressure across the Behring and Seqirus divisions. The stock fell as much as 12% intraday before closing down 4.6%.
- 11 May 2026 (FY26 guidance reset): The fourth and most severe downgrade, detailed below.
Each event carried its own narrative: pandemic disruption, acquisition complexity, divisional weakness, impairment charges. Taken individually, each could be explained away. Taken together, they trace a structural deterioration that the market priced in progressively while the analyst community maintained positive ratings.
The expectations gap mechanics that explain why stocks fall on record profits are the same framework underlying each of CSL’s four guidance-driven declines: in each case, the market was not reacting to whether the result was good or bad in absolute terms but to how sharply actual outcomes deviated from the prior consensus assumption embedded in analyst models.
The fourth downgrade and a US$5 billion impairment
The 11 May 2026 announcement was framed as an Interim CEO 90-Day Review and Financial Update. FY26 revenue guidance was set at approximately US$15.2 billion, implying negative growth from prior expectations. NPATA guidance was cut to approximately US$3.1 billion, also representing negative growth from the prior range of 4-7%. A US$5 billion impairment charge was flagged across FY26 and FY27, covering goodwill and intangible assets related to prior acquisitions.
The stock closed at A$98.59, down approximately 17.7% on the session. That close represented a roughly 67% fall from the February 2020 all-time high of A$342.75 and the lowest level in nine and a half years.
When big ASX news breaks, our subscribers know first
What broker consensus on CSL actually said, snapshot by snapshot
Five verified consensus snapshots, captured at intervals across the decline, show what the professional analyst community formally recommended at each stage. The data speaks for itself.
| Date | CSL Share Price | Consensus Target | Implied Upside (%) | Sell Ratings |
|---|---|---|---|---|
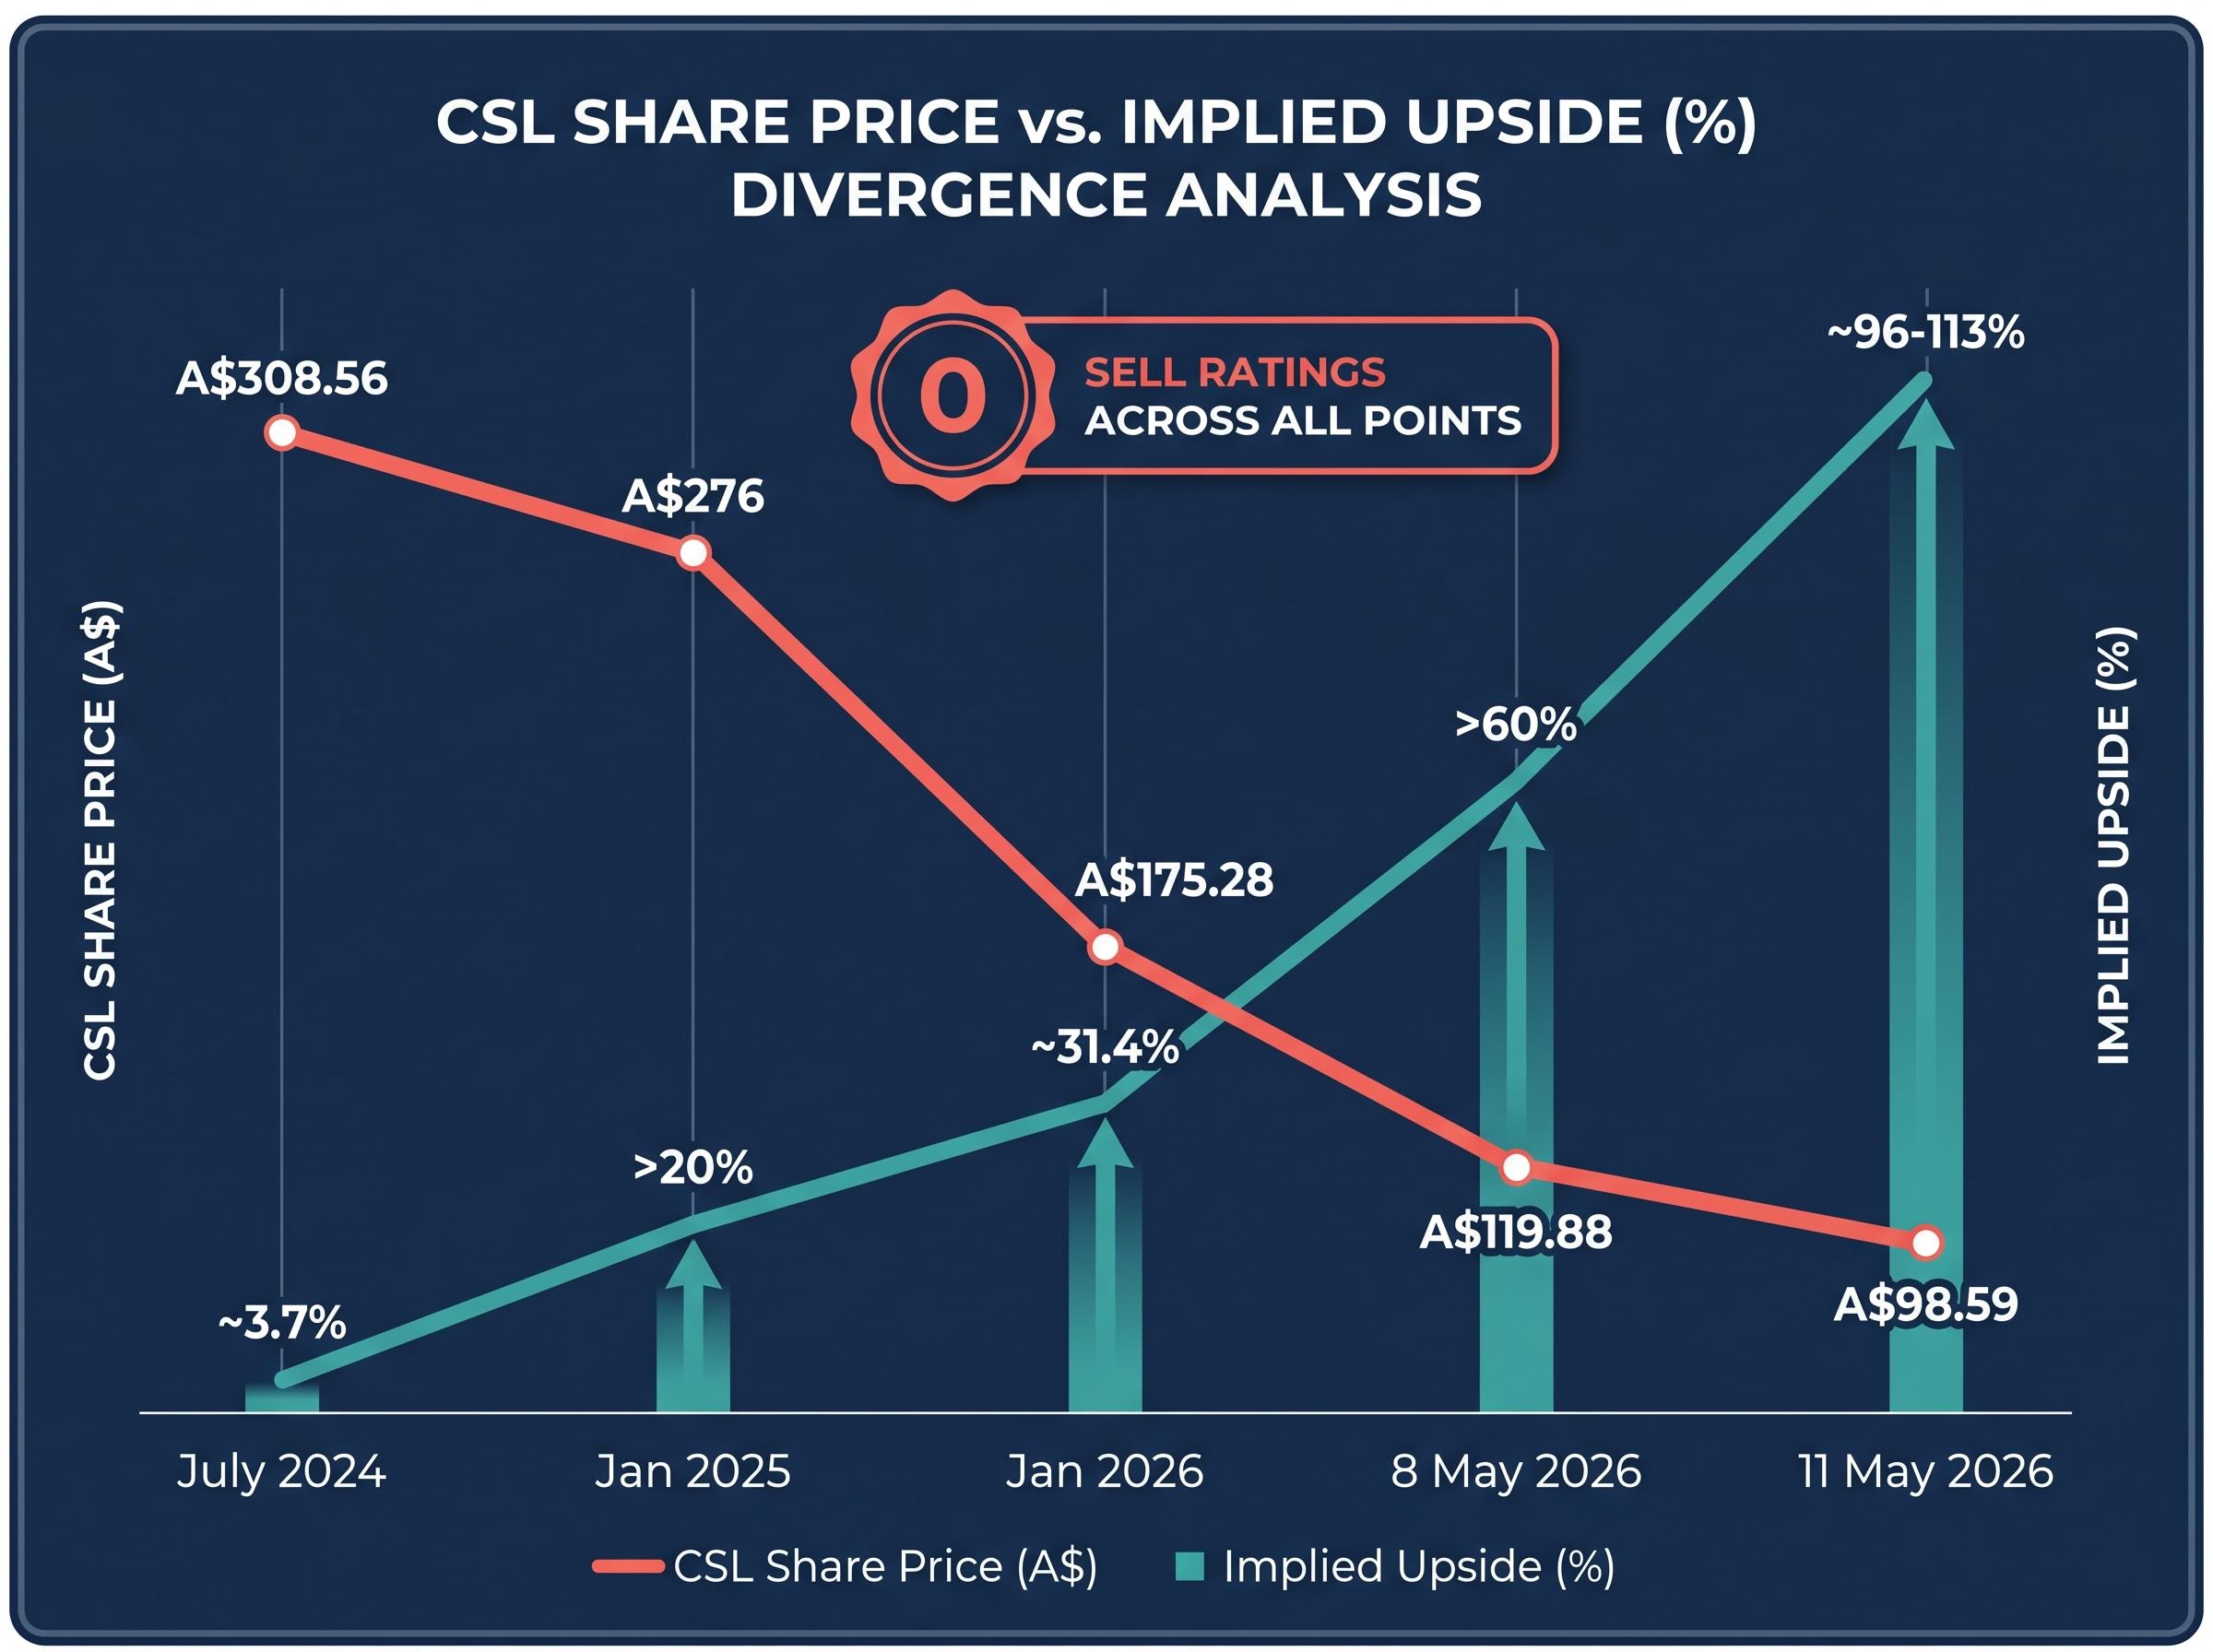
| July 2024 | A$308.56 | A$320 | ~3.7% | 0 |
| January 2025 | ~A$276 | A$332 | >20% | 0 |
| January 2026 | A$175.28 | A$230 | ~31.4% | 0 |
| 8 May 2026 | A$119.88 | A$195 | >60% | 0 |
| 11 May 2026 | A$98.59 | ~A$194-198 | ~96-113% | 0 |
As the share price fell, implied upside did not narrow. It widened. In July 2024, when the stock traded at A$308.56, consensus targets implied a modest 3.7% gain. By 11 May 2026, with the stock at A$98.59, TipRanks showed a Moderate Buy with an average target of A$197.58 (approximately 100% implied upside), while Investing.com showed a Buy rating with a target of A$193.65 (approximately 96% implied upside). One broker maintained an overweight rating with a A$244 target as recently as 8 May 2026, having reduced it from a prior high of A$313.12 set around the time of the October 2025 AGM.
The Consensus Rating Value on 8 May 2026 stood at 0.58, still classifying the stock as a consensus buy. Across twelve covering brokers, targets ranged from A$155 to A$244.
As of 11 May 2026: Zero sell ratings exist across all major consensus platforms. Average price targets imply approximately 96-113% upside from a nine-and-a-half-year low. Post-announcement broker revisions had not yet been published.
Why analyst consensus is structurally wired for optimism
The pattern visible in CSL’s coverage is not an anomaly. It is the expected output of a system with five well-documented structural incentives that produce persistent buy bias, particularly in large-cap ASX healthcare coverage.
- Investment banking relationships: Brokers covering CSL also compete for corporate advisory mandates. Issuing a sell rating on a company that represents potential advisory revenue creates a direct commercial disincentive.
- Management access dynamics: Analysts who rate a stock as a sell risk losing access to company management briefings, investor days, and pre-result guidance sessions. Access is a competitive asset in institutional research.
- Reputational herding: Career risk for a sell-side analyst is asymmetric. Being wrong alone (a solo sell on a blue-chip name that recovers) carries greater professional consequence than being wrong together with the consensus.
- Buy-side pressure: Institutional clients with large long positions may push back against sell recommendations on names they hold. The buy side is the sell side’s customer.
- Biotech pipeline optimism: Analyst models for healthcare and biotech names tend to weight recovery and pipeline scenarios more heavily than downside scenarios, reflecting the sector’s structural emphasis on long-term development timelines.
According to Morningstar global comparison data from January 2026, sell ratings represent fewer than 5-10% of all published ratings globally even during significant drawdowns. On the ASX, the figure for large-cap healthcare names is effectively 0% during comparable declines. CSL has not received a sell rating from any covering broker since at least 2015.
ASIC RG 264 on sell-side research conflicts requires Australian financial services licensees to identify, manage, and disclose material conflicts of interest in analyst research, yet the regulatory framework stops well short of mandating rating distribution outcomes, leaving the structural incentives described above largely intact.
What consensus is and is not designed to measure
Broker consensus is, at its core, an intrinsic value estimation exercise. Analysts model a company’s long-term earnings trajectory, apply a valuation framework, and arrive at a price target that represents where they believe the stock should trade if their thesis is ultimately realised.
This is not the same as a directional price signal. A A$195 target on a A$99 stock does not mean the analyst expects the price to double in the near term. It means the analyst’s model, built on assumptions about plasma collection normalisation, acquisition synergies, and secular immunoglobulin demand growth, produces a valuation roughly double the current price. The gap reflects a model’s view of long-term fair value, not a timing recommendation.
Retail investors often interpret consensus buy ratings as a floor under the share price. The CSL case demonstrates the cost of that interpretation.
What a trend-following model recorded while brokers held their buy ratings
While the broker community maintained buy-equivalent ratings across every stage of the decline, a separate signal was telling a different story. The ChartWatch technical analysis framework, which assesses supply-demand dynamics independently of earnings forecasts or price targets, flagged CSL in a downtrend on 90 separate occasions between late September 2024 and 11 May 2026.
- First downtrend signal: 27 September 2024, with the stock at A$285.10. At that point, consensus remained at buy-equivalent with targets well above the prevailing price.
- Feature-level designations: Of the 90 downtrend appearances, 65 carried a Feature-level designation, the model’s highest-conviction signal.
- Post-FY25 run: Following the 19 August 2025 FY25 results release, CSL recorded an unbroken run of 51 consecutive downtrend designations through to 11 May 2026.
The model produced one solitary uptrend appearance on 13 August 2025, during a recovery from approximately A$230 toward A$275. That signal was negated six days later when the FY25 results triggered the 16.9% single-session decline.
The contrast in numbers: 90 downtrend flags from a trend-following model versus zero sell ratings from covering brokers across the same period. Both were measuring the same stock; they were asking fundamentally different questions of its price behaviour.
This is not an argument that technical analysis is inherently superior to fundamental research. It is an observation that during a sustained drawdown, relying on a single signal type, particularly one with the structural incentives documented in the previous section, leaves investors with a systematically incomplete picture.
CSL is not alone: how the same pattern appears across global biotech declines
The persistent buy bias observed in CSL’s coverage is replicated across international biotech and pharmaceutical names that have experienced comparable drawdowns.
| Stock | Decline | Consensus at Lows | Implied Upside at Lows |
|---|---|---|---|
| Viking Therapeutics (VKTX) | ~65% from Feb 2024 peak | 22 of 24 analysts at Buy | ~163% |
| Moderna (MRNA) | ~50% in 2024 leg | ~18 of 24 analysts at Buy | ~75% |
| Novo Nordisk (NVO) | ~40% correction mid-2025 | European consensus predominantly Buy | ~120% |
| CSL (ASX: CSL) | ~67% from Feb 2020 peak | 0 sell ratings across all platforms | ~96-113% |
According to Morningstar data from January 2026, U.S. markets show approximately 10% of ratings in neutral or reduce territory during comparable drawdowns. ASX large-cap healthcare coverage shows effectively 0% sell ratings across similar periods, placing the Australian biotech and pharma analyst community among the most persistently bullish globally relative to price performance.
The ASX healthcare sector structural risks compounding CSL’s company-specific deterioration include FDA staffing losses exceeding 1,300 positions since 2025 and RFK Jr.’s April 2026 ACIP governing rule changes, both of which affect the commercial outlook for vaccine and immunology franchises in ways that standard broker earnings models do not systematically price.
The CSL case is the most extreme expression of a universal pattern. Investors who recognise this can apply appropriate scepticism to consensus ratings in any biotech or pharma drawdown context, not just this one.
What investors can take from this without throwing out the analyst research entirely
The bull case for CSL has not been extinguished. Secular immunoglobulin demand growth remains intact. Plasma collection costs continue to normalise, albeit more slowly than projected. The transformation programme initiated under the interim CEO review could, over a multi-year horizon, vindicate the long-term thesis embedded in broker models.
Being right over five years while holding through a 67% drawdown, however, is a fundamentally different investment experience to being right in a way that preserves capital or optimises entry timing.
Pre-committed investing strategies such as rules-based rebalancing and dollar-cost averaging have documented advantages precisely because they remove the single-point-of-failure risk of relying on any one signal type during a drawdown, whether that signal is a consensus buy rating, a management guidance update, or a trend indicator.
Three portfolio disciplines emerge from the CSL case:
- Read consensus for valuation context, not timing. A consensus buy rating with a A$195 target on a A$99 stock is a statement about where the analyst’s model places long-term fair value. It is not a signal that the price is about to recover.
- Use trend signals as an independent check. A technical model flagged downtrend conditions on 90 occasions across the same period that produced zero sell ratings. Running a complementary signal alongside fundamental consensus provides a check on timing and sentiment that the consensus framework is not designed to deliver.
- Treat zero sell ratings during sustained drawdowns as a structural feature, not reassurance. The absence of sell ratings on a stock that has fallen 67% is a product of the incentive architecture described above. It should prompt additional scrutiny, not comfort.
As of 11 May 2026, no broker held a price target below CSL’s then-current price of approximately A$99.60. Post-announcement revisions, expected over the following 24-72 hours, may produce the most significant consensus target reset in CSL’s recent coverage history.
This article is for informational purposes only and should not be considered financial advice. Investors should conduct their own research and consult with financial professionals before making investment decisions. Past performance does not guarantee future results.
A real-time case study that investors will be studying for years
CSL’s decline from A$342.75 to A$98.59 produced zero sell ratings from covering brokers and 90 technical downtrend flags from a trend-following model. Both facts are simultaneously true because they are measuring different things with different structural incentives. The lesson is not that analysts are wrong or that technical signals are superior. It is that single-source signal reliance during a sustained drawdown is a risk management failure, and the structural incentives documented here make it a predictable one.
The days following 11 May 2026 will provide real-time evidence of how the analyst community responds when the gap between targets and reality becomes impossible to sustain. Broker revisions expected in the coming sessions will represent a live continuation of this case study. Investors positioned to integrate technical trend signals alongside fundamental research, rather than relying on either in isolation, will be better equipped to interpret whatever comes next.