Chip Stocks Face Asymmetric Risk at the May 14 Summit
22 mins ago

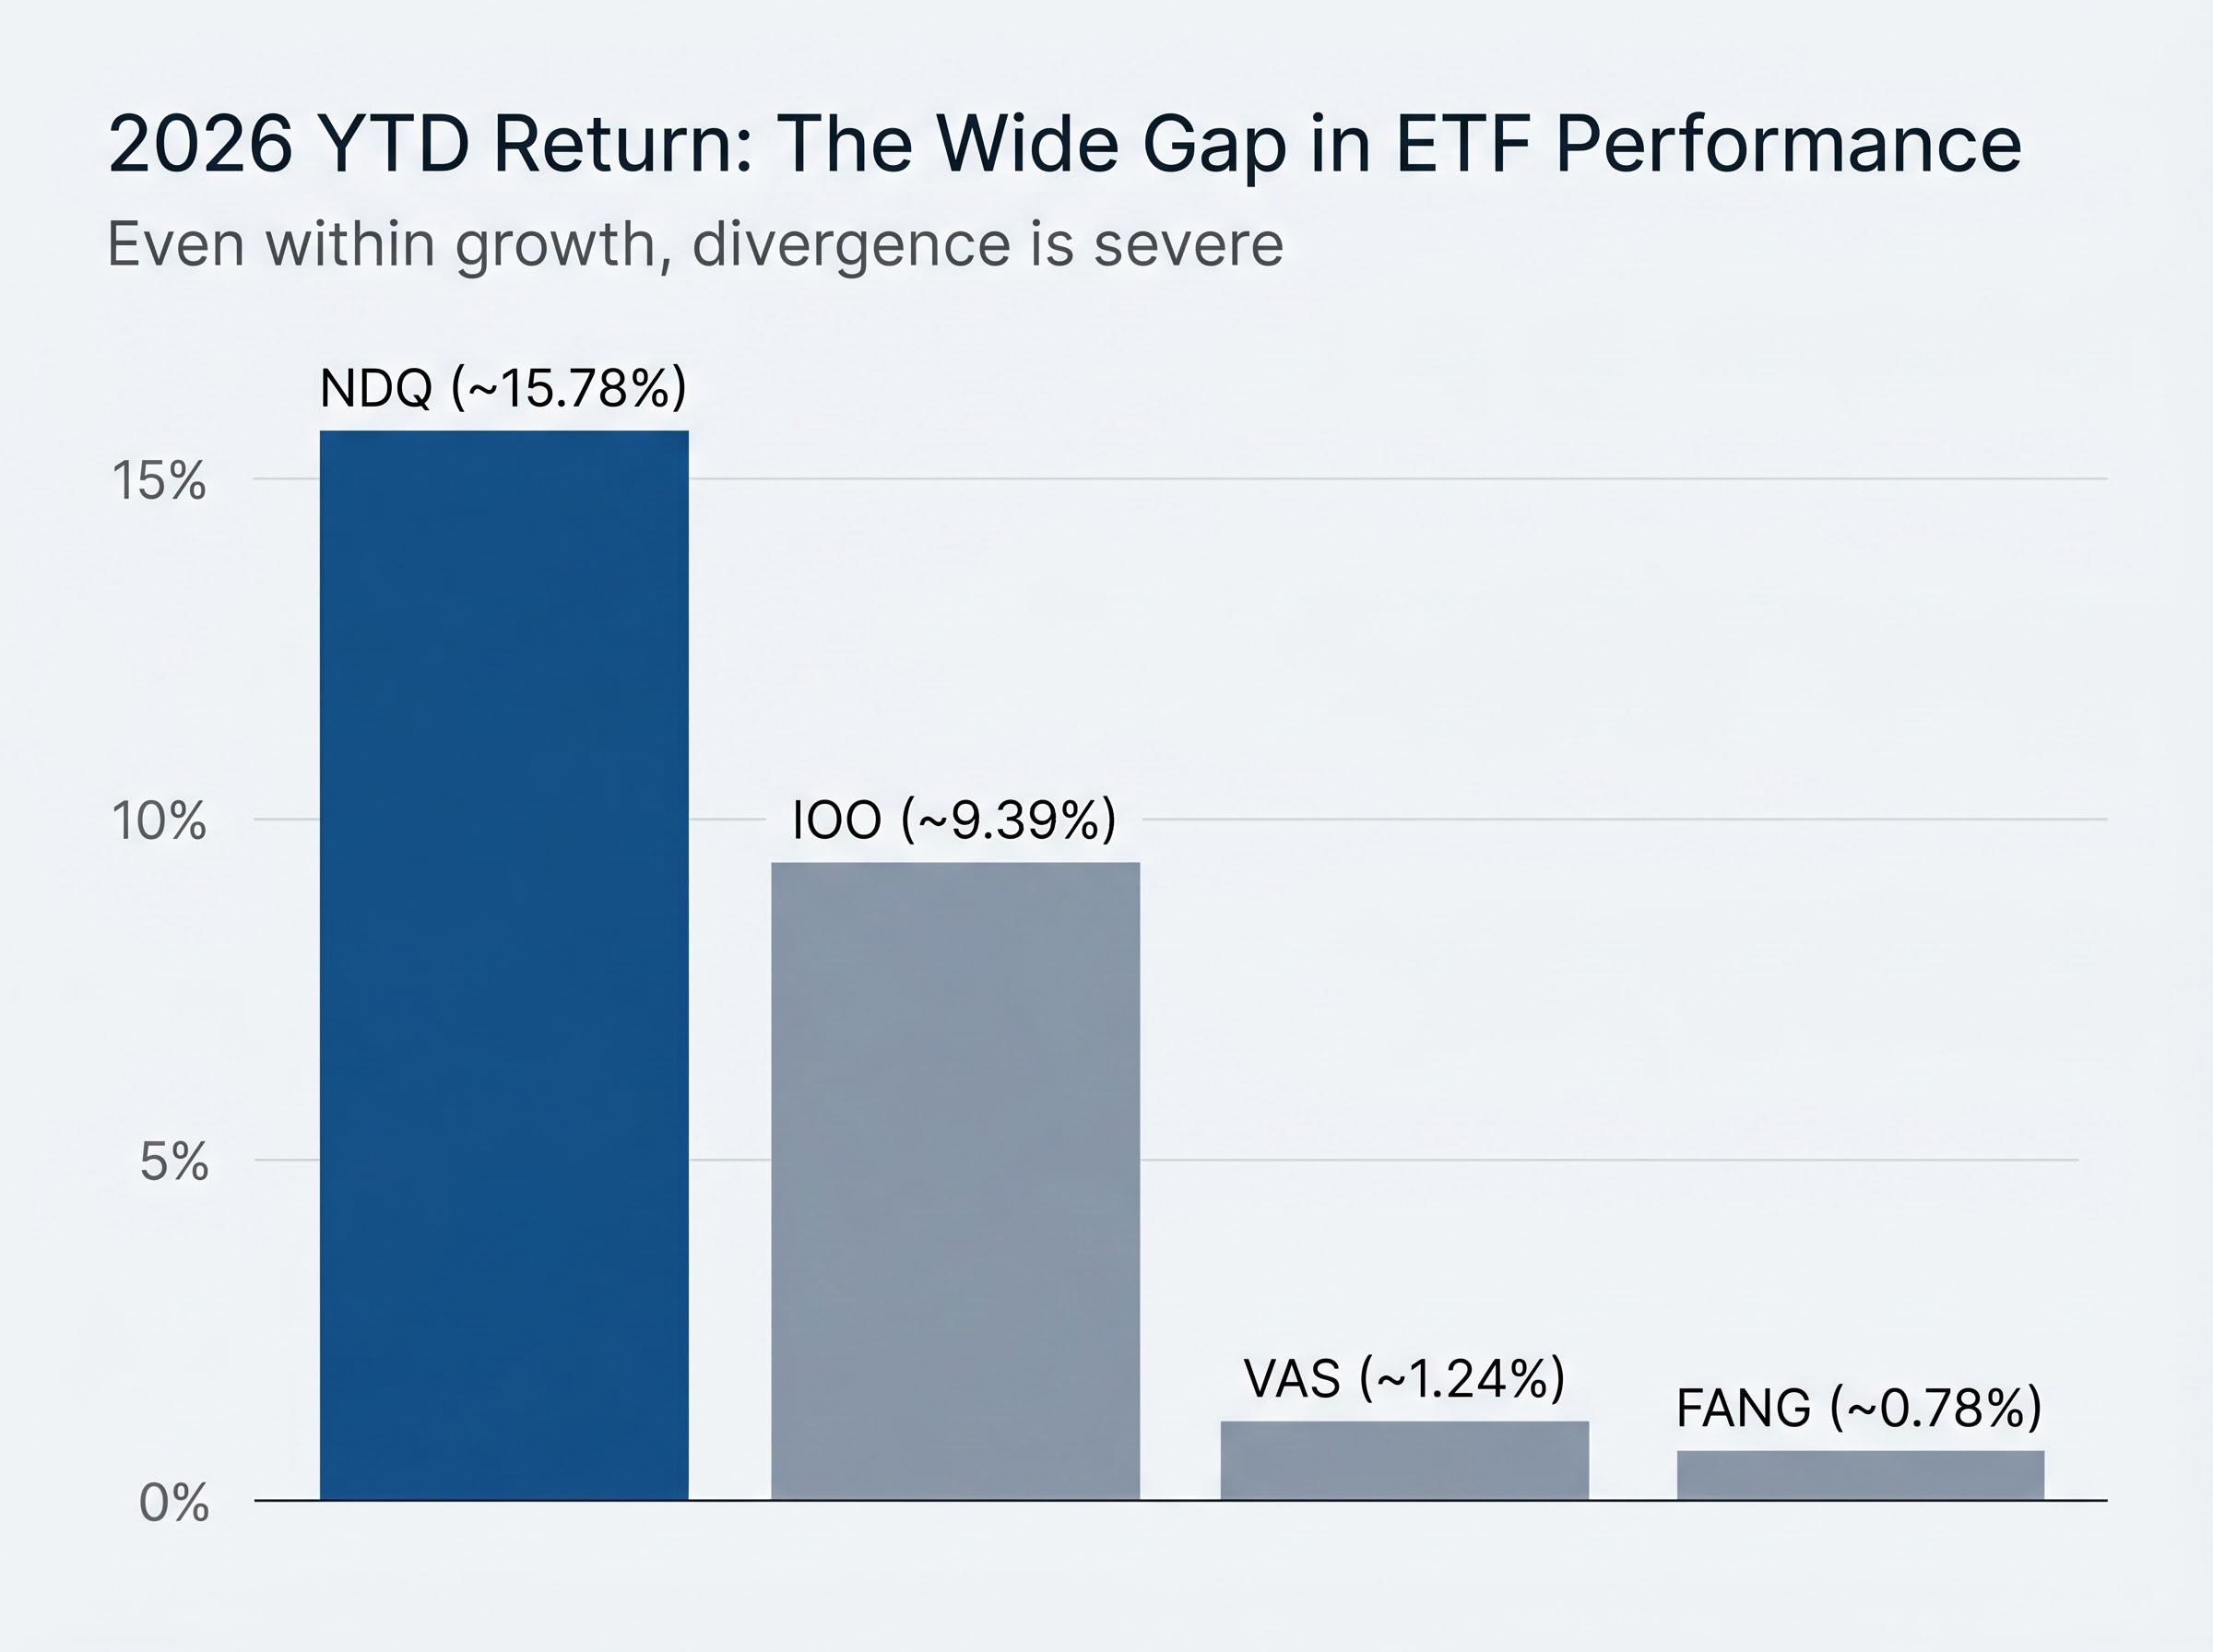
In 2026 to date, BetaShares Nasdaq 100 ETF (NDQ) has returned roughly 15.78%. Vanguard Australian Shares Index ETF (VAS), the broad ASX 300 tracker, has returned just 1.24%. That gap invites a familiar temptation: back the winner. Australian investors searching for growth ETFs on the ASX are navigating a genuinely confusing environment. The RBA has hiked rates to 4.35%, CPI sits at 4.6%, and yet tech-heavy growth ETFs are outpacing value-tilted domestic funds by a wide margin. Expert opinion is split. JPMorgan made the case for value in February. VanEck made the case for growth the same week. By May, the scoreboard favoured growth, but the year is not over. This article examines why the growth-versus-value decision is harder than performance tables suggest, what the historical cycle of style rotation means for Australian portfolios, and why a blended ETF approach may remove the need to call the next rotation correctly.
The headline numbers are striking. NDQ is up roughly 15.78% in 2026. VAS is up 1.24%. For an investor scanning a performance table, the conclusion seems obvious.
It is not. Within the category labelled “growth,” the divergence is just as wide. Global X FANG+ ETF (FANG), which holds 89% growth-company exposure, has returned just 0.78% year to date. iShares Global 100 ETF (IOO) sits at roughly 9.39%. An investor who simply bought “growth ETFs” in January 2026 would have landed anywhere from nearly flat to up almost 16%, depending on which fund they selected.
NDQ vs. FANG in 2026: Both are classified as growth ETFs. NDQ has returned roughly 15.78% year to date. FANG has returned 0.78%. The gap between them, approximately 15 percentage points, is wider than the gap between NDQ and the broad market.
The five-year picture complicates the story further. FANG’s 18.0% annualised return to 31 March 2026 leads the group. NDQ’s five-year annualised figure is 14.9%. Short-term momentum and long-run compounding tell different stories depending on the window selected.
| ETF | Growth exposure | 2026 YTD return | 5-yr annualised return | MER |
|---|---|---|---|---|
| VAS | Value-tilted (broad ASX 300) | ~1.24% | N/A (broad market) | 0.10% |
| IOO | Diversified global blue-chip | ~9.39% | N/A (blended) | 0.40% |
| NDQ | 61% | ~15.78% | 14.9% | 0.48% |
| FANG | 89% | ~0.78% | 18.0% | 0.35% |
The question, then, is never simply growth versus value. It is which growth, in which structure, over which timeframe.
Value investing traces its intellectual heritage to Benjamin Graham in the 1930s: the discipline of buying shares that trade below an estimate of intrinsic worth, often with a dividend emphasis and a focus on established cash flows. Growth investing is the opposite bet. It targets companies delivering above-average revenue and earnings expansion, typically reinvesting profits rather than distributing them, and carrying higher valuations as a result.
In theory, the line between the two is clean. In practice on the ASX, it is not.
Australia’s sharemarket is structurally dominated by banks, miners, and energy producers, all of which sit in value-adjacent territory. Growth exposure percentages across ASX-listed ETFs illustrate how wide the spectrum runs:
According to Stockspot data as at 31 March 2026, a balanced portfolio allocation split roughly 22% growth-style, 43% blended-style, and 35% value-style, reflecting how most diversified Australian investors end up tilted away from pure growth by default.
No ASX-listed ETF exclusively tracks a dedicated domestic growth share index. The ASX 300’s heavy weighting to financials, materials, and energy means that a broad Australian index fund inherently carries a value tilt. Investors seeking concentrated growth exposure must typically look offshore via ETFs such as NDQ, FANG, RBTZ (robotics and AI), HACK (cybersecurity), and SEMI (semiconductors). This structural reality means that Australian growth ETF investors are, by definition, also making a currency and geographic bet.
Growth and value alternate leadership across market cycles. The conditions that drive each rotation, interest rate direction, earnings delivery, and market volatility, are consistently difficult to forecast in advance.
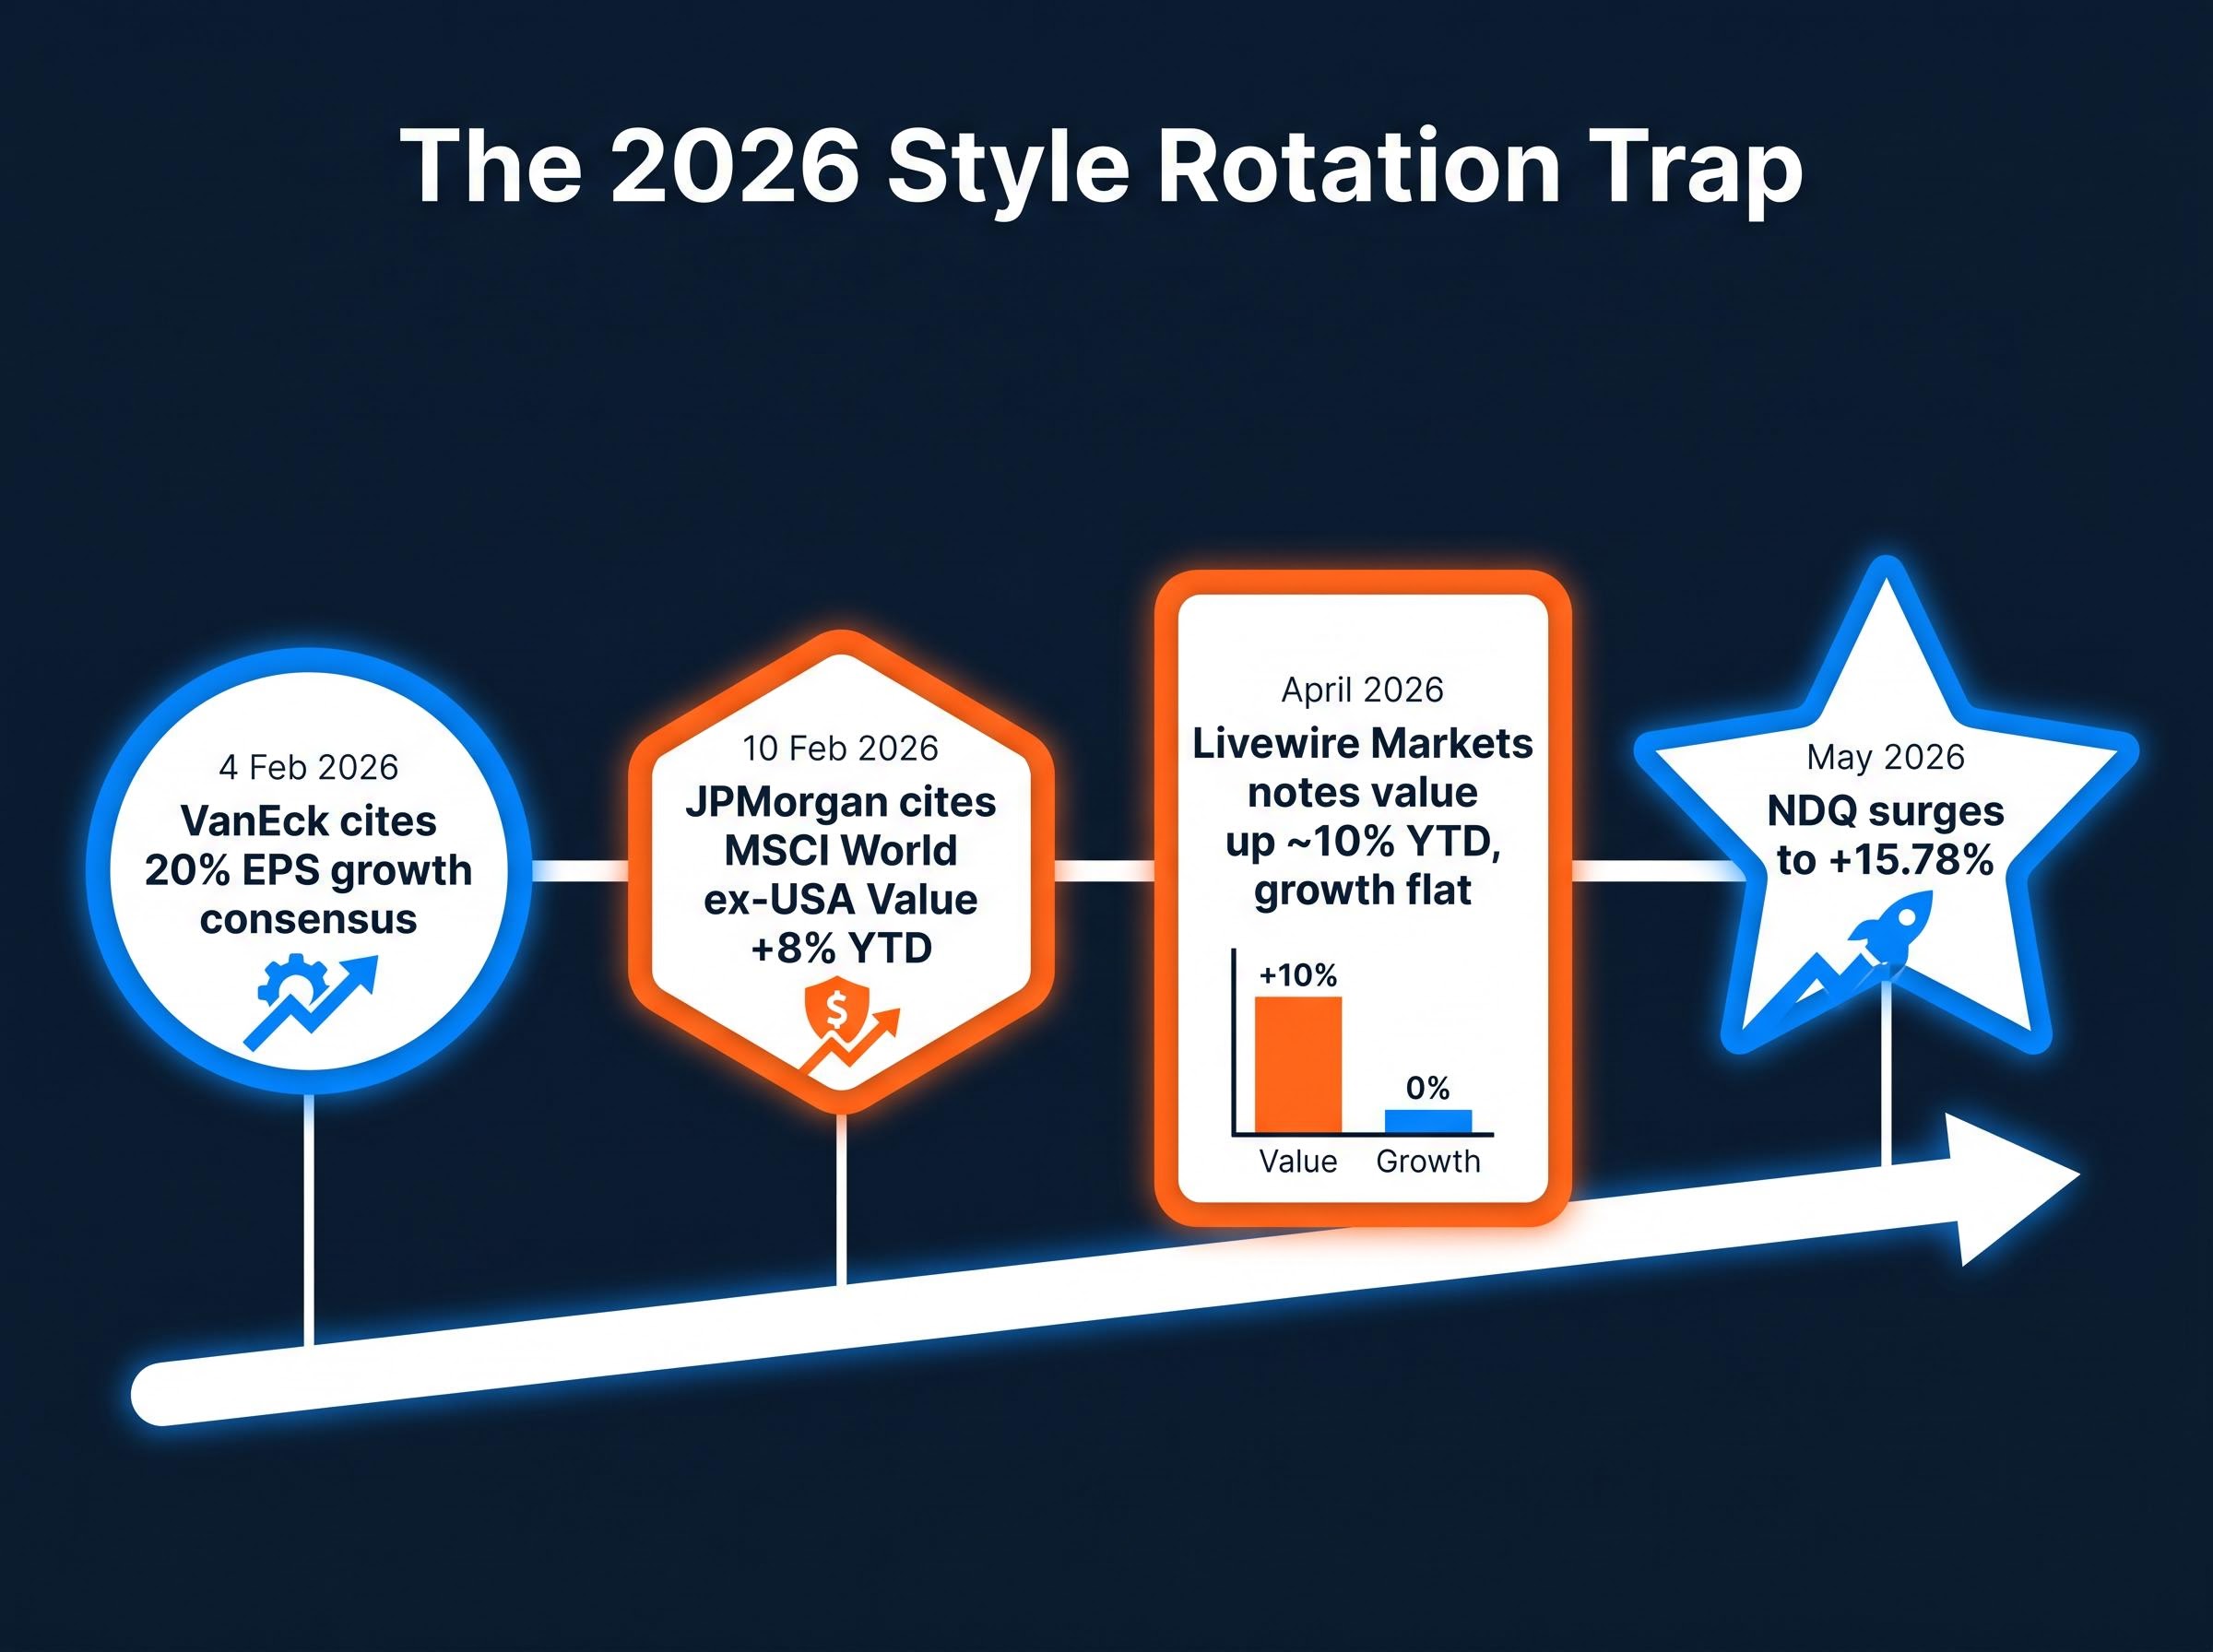
The 2026 environment makes this concrete. On 4 February 2026, VanEck published a pro-growth outlook citing a 20% EPS growth consensus drawn from Bloomberg data. Six days later, on 10 February 2026, JPMorgan Asset Management reported that MSCI World ex-USA Value had returned +8% year to date, with value outperforming growth globally by 5-8% at that point. By April 2026, Livewire Markets noted value was up approximately 10% year to date while growth sat roughly flat.
By May, NDQ had surged to +15.78%, complicating all three narratives.
Opposing calls, same data: VanEck argued for growth outperformance on 4 February 2026, citing 20% EPS growth consensus. JPMorgan argued for value on 10 February 2026, citing a 5-8% global value lead. Both used real data. Both were credible. The market subsequently moved in a direction that validated neither cleanly.
Three conditions typically drive style rotation, and each resists reliable forecasting:
Research indicates that more than 80% of active fund managers fail to outperform their benchmarks over time. Style rotation calling is a subset of the same prediction challenge.
The argument against style prediction is philosophical. The risks embedded in popular ASX growth ETFs in mid-2026 are specific and measurable.
The current growth stock valuation discount complicates the risk picture in both directions: Morningstar data as at 23 March 2026 placed growth stocks at a 21% discount to fair value, a level reached less than 5% of the time since 2011, suggesting that the elevated S&P 500 forward PE of approximately 22x is not uniform across the growth category and that index-level valuation averages can obscure significant dispersion within it.
ATEC and CLDD illustrate a recurring pattern. Thematic ETFs attract capital after a period of strong performance, then underdeliver over longer horizons. HGEN’s extraordinary one-year return of 101.2% to 31 March 2026 shows why capital flows toward these products at exactly the point where mean reversion risk is highest.
The thematic ETF behaviour gap is structural, not incidental: Morningstar research found that the ARK Innovation ETF delivered a reported time-weighted return of approximately 233% while the typical investor experienced roughly negative 35%, because capital flooded in near peak valuations and was withdrawn during drawdowns, leaving most participants worse off than a passive index holder.
Most high-growth ETFs on the ASX experience significant price fluctuations. The five-year data, rather than the trailing twelve months, tends to reveal whether the theme delivered durable returns or a short burst followed by compression.
If style picking is unreliable and concentrated growth carries specific risks, what does a portfolio built around not picking look like?
The simplest version uses two instruments. VAS provides broad ASX 300 exposure with a value tilt through its bank and energy weighting, at a management expense ratio of 0.10%. IOO provides diversified global blue-chip exposure at 0.40%, capturing growth without the concentration of a single-theme fund. IOO’s 9.39% year-to-date return in 2026 demonstrates that diversified global positioning can deliver strong results without a pure growth bet.
Morningstar Australia recommended in March 2026 that style-neutral broad ETFs such as VAS offer a practical approach to managing rotation risk, particularly for investors uncertain about rate direction.
Stockspot’s Turquoise Balanced Portfolio, allocated 22% growth-style, 43% blended-style, and 35% value-style as at 31 March 2026, provides a live example of style-neutral construction at a retail level.
The fee differential matters over time. VAS charges 0.10%. NDQ charges 0.48%. Thematic growth ETFs range up to 1.35% (MAET). Over a decade of compounding, that cost spread is a structural headwind that concentrated growth allocations must overcome through outperformance simply to match a low-cost blended alternative.
ASX ETF cost and tax mechanics interact in ways that amplify the MER gap over time: the 50% CGT discount available after a 12-month holding period applies equally to VAS and NDQ, meaning the after-tax return advantage of a lower-MER fund compounds across every year the position is held, not just in years when the higher-cost fund underperforms on a gross basis.
| ETF | Style orientation | MER | 2026 YTD return | Role in blended portfolio |
|---|---|---|---|---|
| VAS | Broad / value-tilted | 0.10% | ~1.24% | Domestic core, income, franking |
| IOO | Global blended | 0.40% | ~9.39% | Global diversification, growth capture |
| NDQ | Growth (61%) | 0.48% | ~15.78% | Satellite growth allocation |
| FANG | Concentrated growth (89%) | 0.35% | ~0.78% | High-conviction thematic |
A blended approach will not capture the full upside of a growth cycle. NDQ’s 15.78% versus VAS’s 1.24% makes that trade-off visible in real time. The offset is that a blended portfolio also avoids capturing the full downside when the rotation reverses.
The question Australian investors face is not “will growth or value win in 2026.” It is: how much valuation risk and volatility can this portfolio absorb, and over what time horizon?
Growth ETFs expose investors to potential drawdowns exceeding 50%. An investor unable to hold through a drawdown of that magnitude is structurally better suited to less concentrated approaches, regardless of which style appears to be leading in any given year.
For investors who do want deliberate growth exposure, the five-year data supports choosing broadly diversified instruments over highly concentrated ones. NDQ’s 61% growth exposure at a 0.48% MER has delivered 14.9% annualised over five years. HYGG, with 95% growth exposure at 0.70% MER, has delivered 8.2% annualised. Concentration has not compensated for its additional risk in most periods. MCGG’s 24.1% three-year annualised return is the strongest in its cohort, but the fund lacks sufficient long-run history to confirm durability.
Before allocating to growth ETFs, three questions merit honest answers:
The question is not which style wins next year. It is how much of being wrong your portfolio can absorb.
A core blended portfolio built around VAS and IOO can be supplemented with a defined, size-capped growth allocation for investors who have considered the above. The distinction is between building a portfolio around growth ETFs as primary holdings and using them as a deliberate, measured satellite position.
The core-and-satellite framework provides a structural discipline for exactly this trade-off: anchoring 75% or more of portfolio exposure in broad, low-cost index ETFs while reserving a defined satellite allocation for higher-conviction growth positions ensures that any one growth ETF’s drawdown affects only the bounded portion of the portfolio rather than the whole.
Style rotation is cyclical. It is also, as the 2026 data demonstrates in real time, unpredictable even for well-resourced institutional analysts with proprietary data. A blended, low-cost approach is not settling for average returns. It removes the compounding cost of repeatedly mis-timing the cycle.
NDQ’s strong year-to-date performance is genuine. It is also a single data point within a rotation pattern that has reversed repeatedly across market history. With the RBA holding at 4.35% and CPI at 4.6%, the macro environment heading into the second half of 2026 remains genuinely uncertain, reinforcing the case for structural diversification over tactical style bets.
The practical next step is straightforward: review current ETF allocations for unintentional concentration in either style. A portfolio assembled one ETF purchase at a time often carries a style tilt that was never deliberately chosen. Making that tilt visible, and deciding whether it reflects a considered view or an accumulated default, is where the real allocation decision begins.
This article is for informational purposes only and should not be considered financial advice. Investors should conduct their own research and consult with financial professionals before making investment decisions. Past performance does not guarantee future results.
Growth ETFs on the ASX track companies expected to deliver above-average revenue and earnings expansion, typically with higher valuations and lower dividends, while value ETFs focus on shares trading below estimated intrinsic worth, often with stronger dividend income. Because the ASX is structurally dominated by banks, miners, and energy producers, most domestic index ETFs carry a natural value tilt, meaning investors seeking growth exposure generally need to look at offshore-focused funds like NDQ or FANG.
Not all growth ETFs are constructed the same way: NDQ holds around 61% growth-company exposure and returned roughly 15.78% year to date in 2026, while FANG holds 89% growth exposure and returned just 0.78% over the same period. The difference comes down to which specific stocks each fund holds, how concentrated the portfolio is, and which sectors or themes are driving returns in a given period.
Growth ETFs typically hold high-duration assets, meaning companies whose value depends heavily on future cash flows, which makes them more sensitive to rising interest rates. With the RBA hiking to 4.35% in 2026, the cost of discounting those future cash flows increases, putting structural pressure on growth valuations relative to value-oriented investments.
Style rotation refers to the cyclical shift in market leadership between growth-oriented and value-oriented investments, driven by changes in interest rates, earnings delivery, and market volatility. It matters for ETF investors because attempting to time which style will outperform in any given year has historically proven unreliable, even for institutional fund managers with proprietary data.
A core-and-satellite approach involves anchoring 75% or more of a portfolio in broad, low-cost index ETFs such as VAS and IOO, then reserving a defined smaller allocation for higher-conviction growth positions. This structure limits the impact of any single growth ETF drawdown to the bounded satellite portion of the portfolio rather than affecting the entire investment.