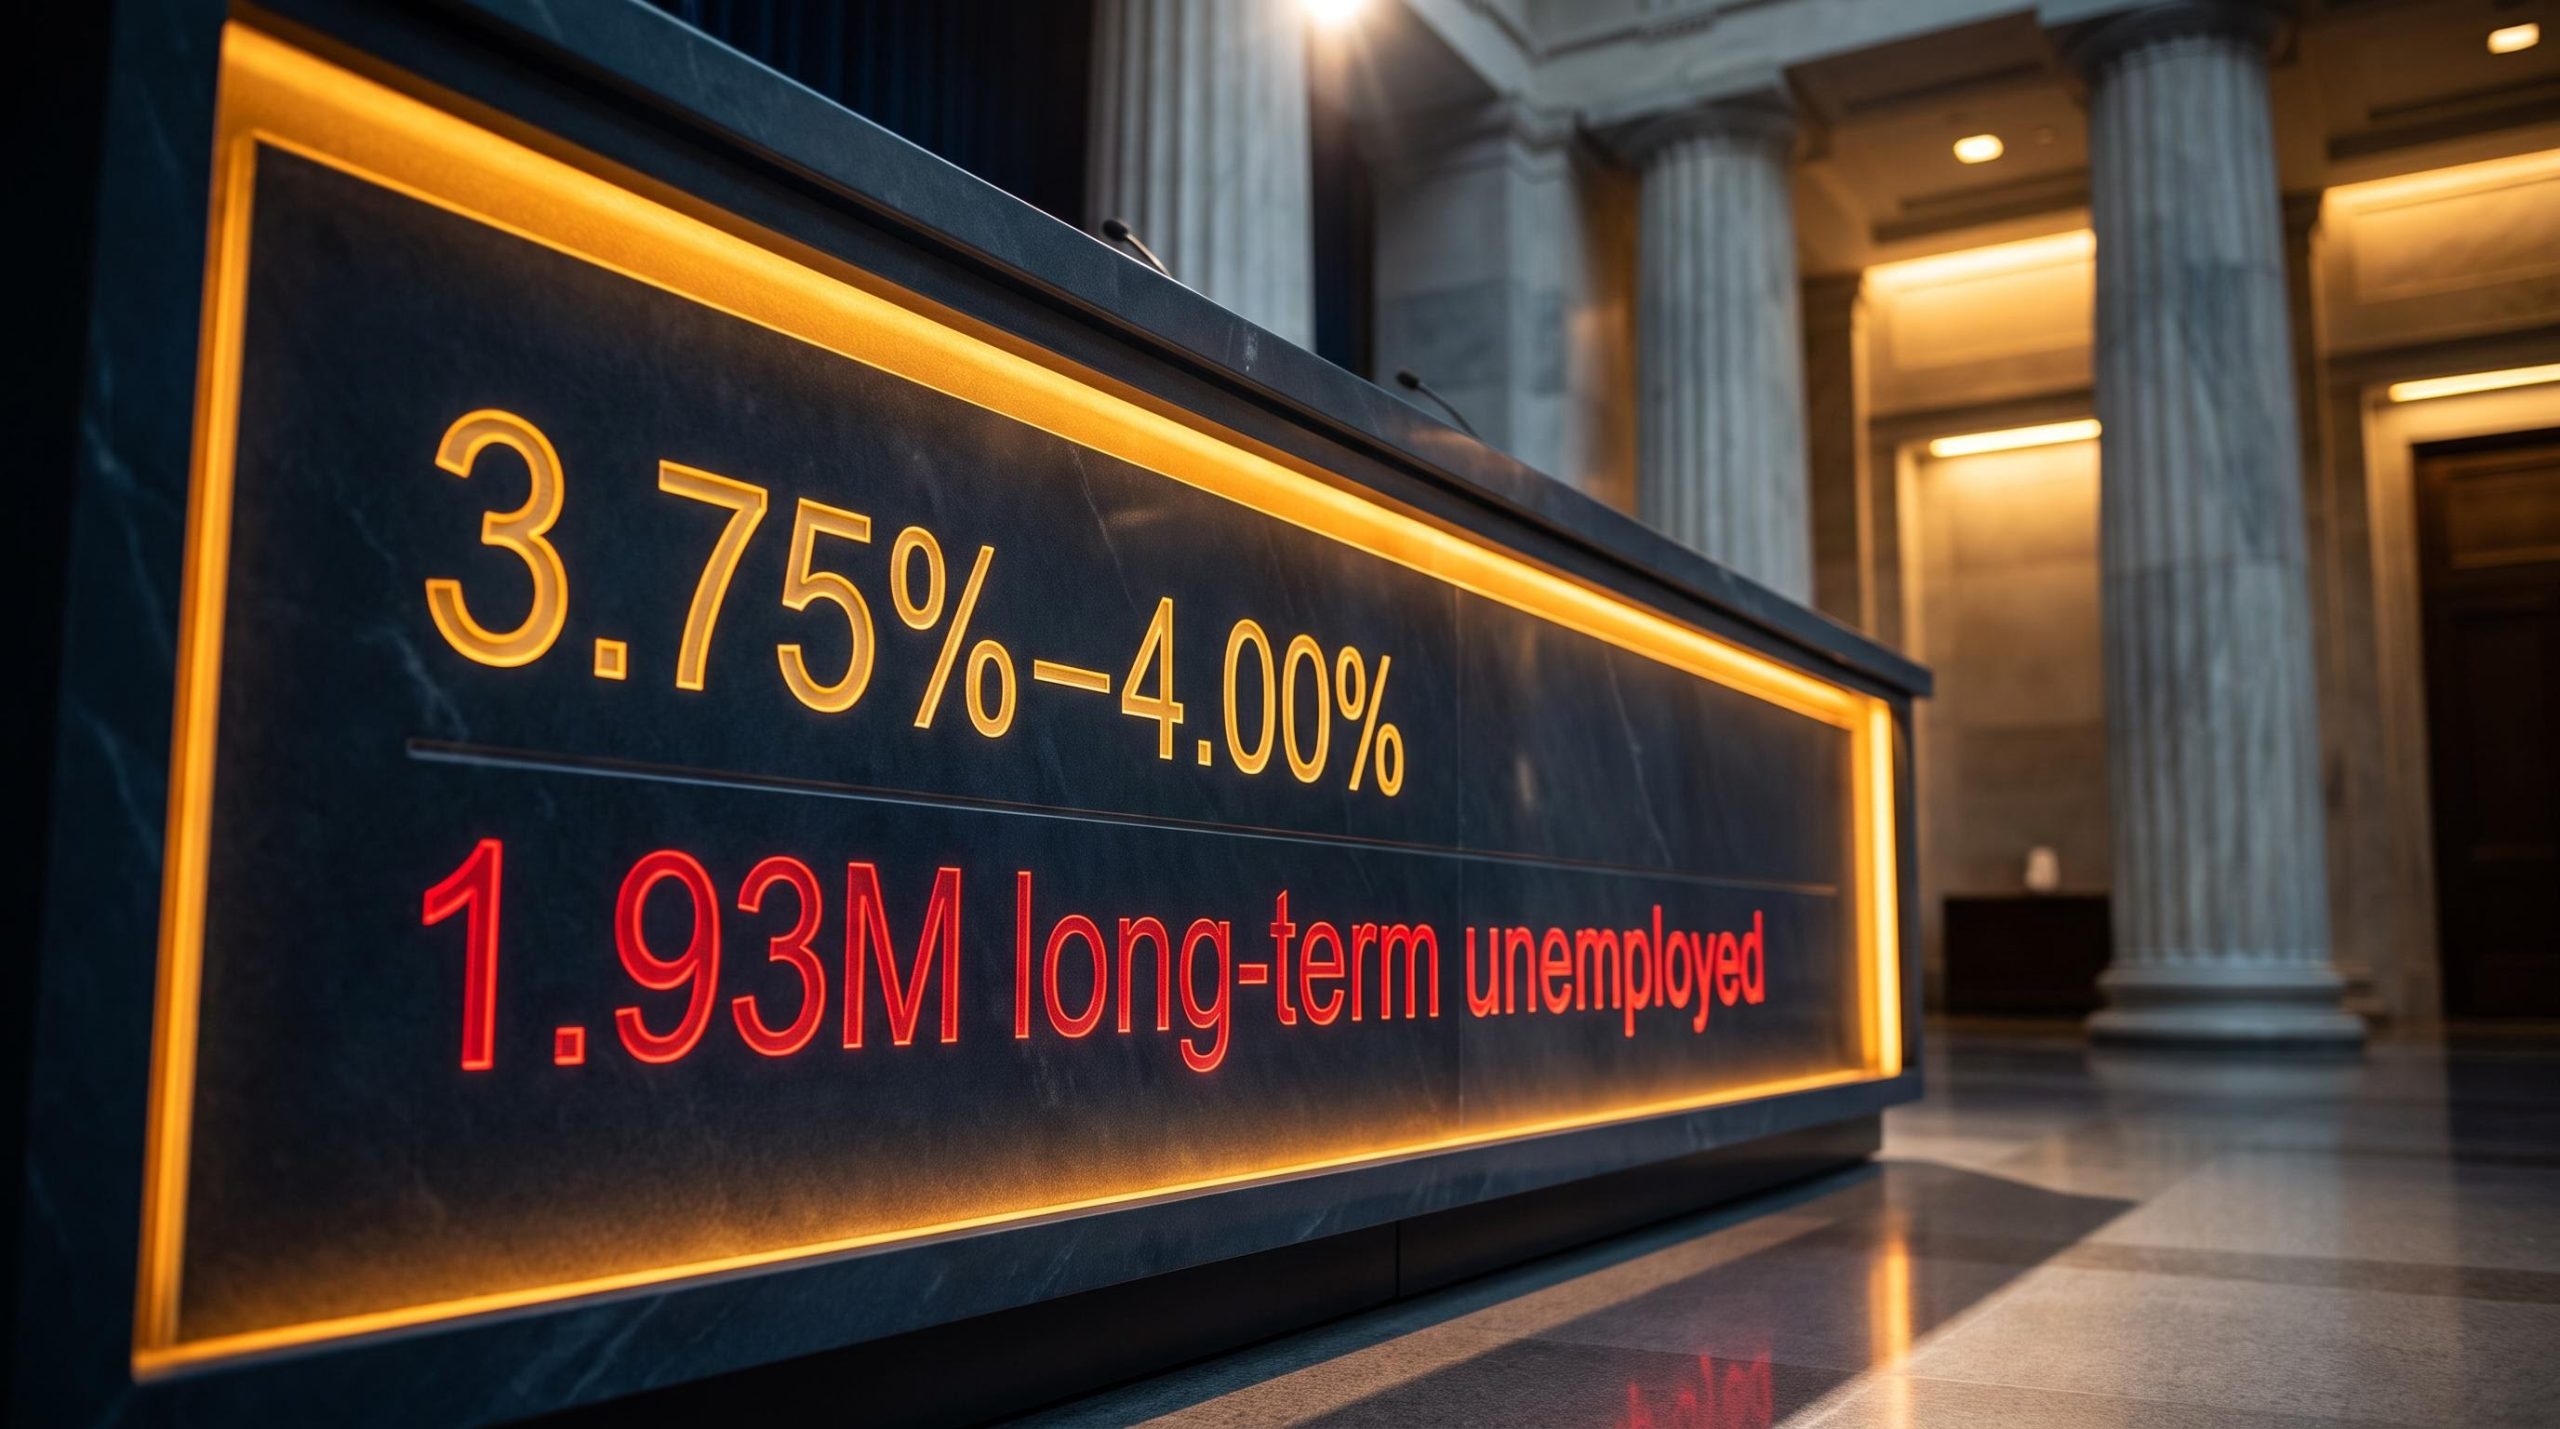
The US economy keeps posting resilient headline numbers, yet one of the most reliable early signals of financial distress is flashing quietly in a place almost nobody looks: the Producer Price Index. Bankruptcy attorneys now rank among the fastest-growing billing categories in that index, and demand for their services tends to rise well before insolvencies show up in aggregate filing data.
That matters because professional services demand moves ahead of the crisis, not alongside it. When companies start paying restructuring lawyers, the trouble is already underway.
Beneath the calm surface of stable growth sits a severe undercurrent of corporate insolvency and household financial strain that rarely reaches the front page. The credit stress data tells a story the top-line figures do not.
Here is the framework for reading these hidden distress signals before they bleed into the broader market and reach your portfolio. This analysis walks through the corporate bankruptcy surge, the restructuring mechanics that mask true default rates, the banking pullback drying up capital, and the moment household strain climbs the income ladder.
The record surge in corporate bankruptcy filings
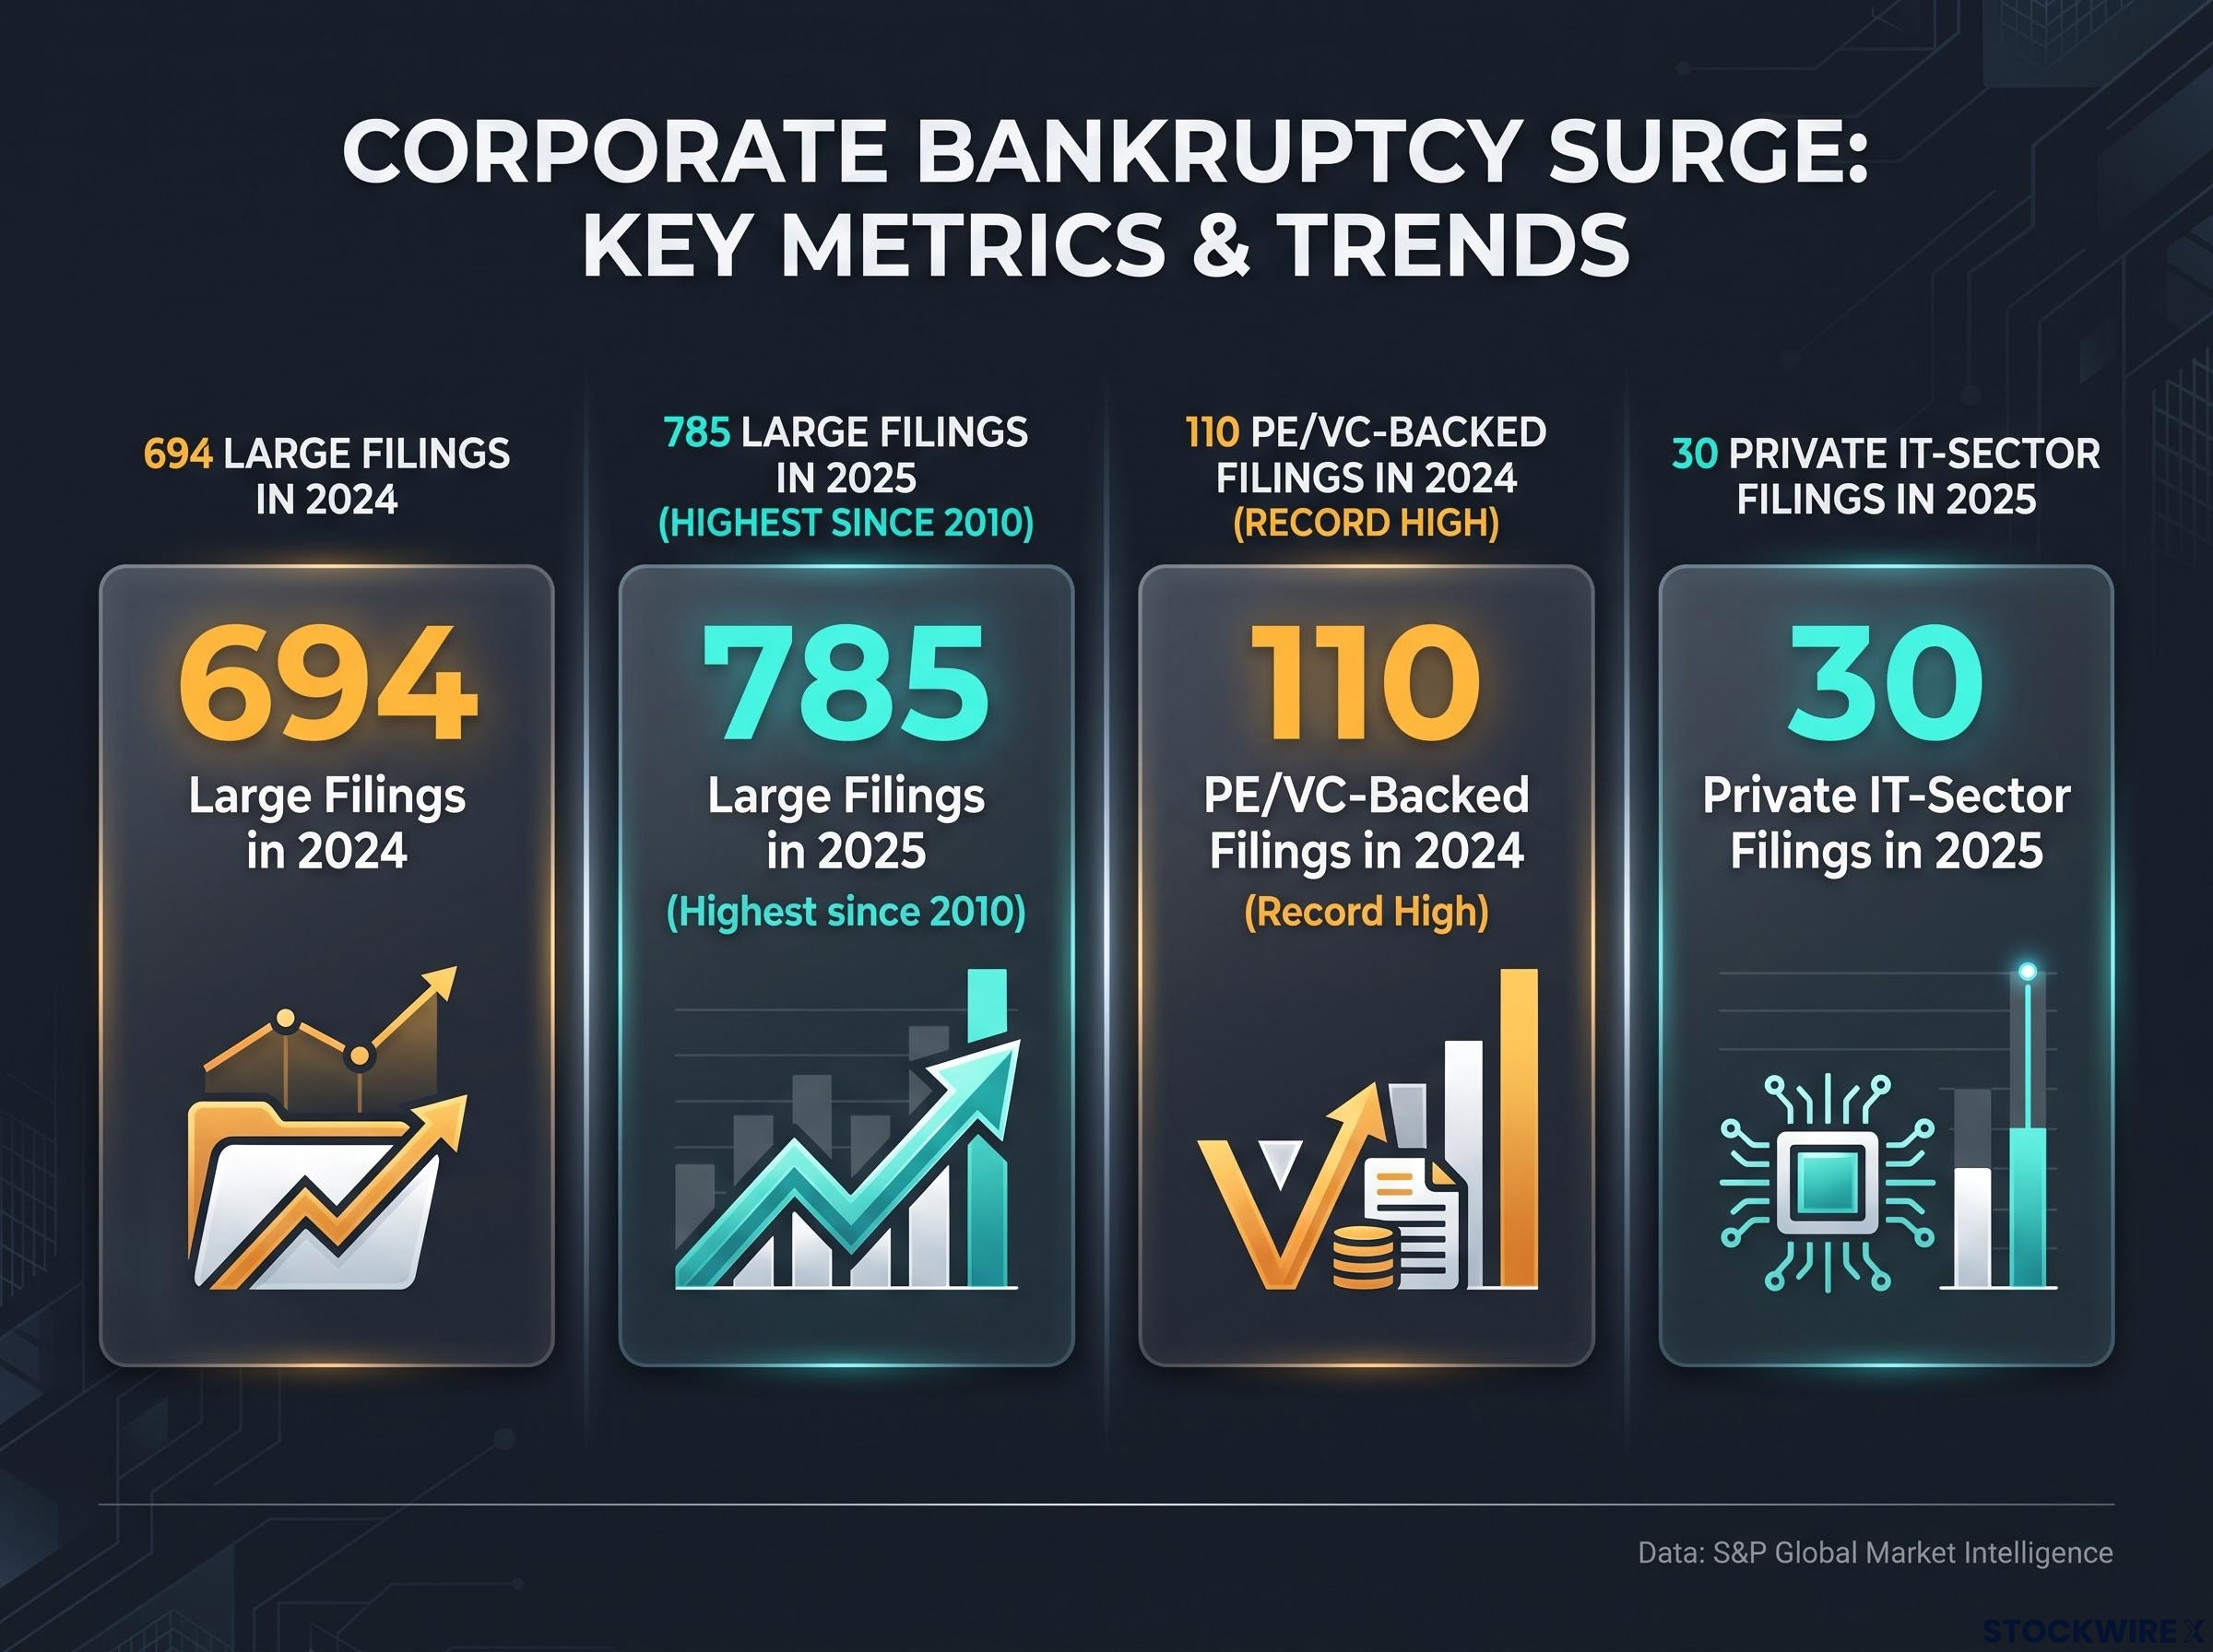
Start with the raw volume, because it is genuinely historic. According to S&P Global Market Intelligence, large US corporate bankruptcy filings reached 694 in 2024 and climbed to 785 in 2025, the highest annual total since 2010.
For three straight months in mid-2025, filings from companies carrying at least $2 million in liabilities topped 70 per month, which S&P describes as unprecedented in the history of its data series. July 2025 alone recorded 71 filings, the busiest month since July 2020 at the time.
The pace has cooled since. S&P recorded 50 large filings in April 2026, the lowest monthly total of the year, down from 70 in March 2026. But a slower monthly count does not erase the records set in 2025; those filings continue to work through the economy as liquidations, layoffs, and creditor losses.
What should command your attention is not the aggregate number but where the stress concentrates. The failures cluster heavily in leveraged, sponsor-owned businesses and cyclical sectors.
Private equity- and venture-capital-backed companies recorded 110 filings in 2024, a record high and a rise of more than 15% year-over-year. Private US IT-sector firms logged 30 filings in 2025, led by application software companies, proving the strain reaches previously well-funded tech, not just bricks-and-mortar retail.
Industrial and consumer discretionary firms carry a disproportionate share of the damage. In June 2025, those two sectors alone accounted for 107 filings, nearly as many as every other industry combined.
| Period | Total Large Filings | Key Sector Drivers |
|---|---|---|
| Full-year 2024 | 694 | 110 private equity / venture-backed filings, a record high |
| Full-year 2025 | 785 (highest since 2010) | Industrial and consumer discretionary; 30 private IT-sector filings |
| April 2026 | 50 (down from 70 in March) | Cooling monthly pace, records still echoing |
The concentration is the read you should take from this. Companies most dependent on cheap capital are already failing, which means the honest question for your portfolio is whether your holdings sit inside these vulnerable private equity and covenant-lite structures. Broad market panic is the wrong response; targeted assessment of leverage exposure is the right one.
The leveraged loan market illustrates this bifurcation with particular clarity: first-quarter 2026 data showed corporate default rates reaching 4.9% in March, with software, media, and energy sectors carrying a disproportionate share of that stress even as high-rated debt held relatively stable.
When big ASX news breaks, our subscribers know first
How distressed debt exchanges mask the true insolvency rate
The bankruptcy count is only part of the picture, because many distressed companies never file at all, at least not right away. They use a manoeuvre that keeps them out of court while their solvency quietly deteriorates.
A distressed debt exchange is an out-of-court deal where a struggling company renegotiates with its lenders, swapping existing debt for new terms: a lower balance, a later maturity, or deferred interest. Corporate managers reach for it because it avoids the cost, disclosure, and control loss of formal bankruptcy. It buys time.
The problem is that time is often all it buys. Research from Moody’s Analytics, published in May 2026, found that nearly 25% of firms completing a distressed exchange ultimately suffer a hard default, meaning bankruptcy or a missed payment, and over one-third eventually face either a hard default or another forced restructuring.
The historical record is harsher still. Work by Edward Altman and co-authors examined 57 distressed exchanges completed before 2008 and found 45.6% eventually went bankrupt, with a median time to failure of roughly two years.
Moody’s corporate default risk outlook for 2026-2027 situates these exchange-driven failures within a broader fragmentation of public and private credit risk, finding that companies relying on repeated restructuring face compounding solvency headwinds that extend well beyond the initial distress event.
Why do so many fail? The structural reasons are consistent. Companies typically delever only modestly, so they emerge still carrying heavy debt against weak cash flows, with no cushion for the next shock. DBRS Morningstar, in a March 2026 credit report, tied rising exchange-driven defaults in private credit to borrowers still battling declining revenue and thin operating margins, frequently after earlier rescue measures had already failed.
The late-stage tactics tell you how thin the margin has become. DBRS notes these deals increasingly lean on interest deferrals and delayed amortisation, extend-and-pretend mechanics that push the reckoning down the road rather than resolving it.
The practitioner’s verdict Purnima Puri of HPS Investment Partners argued in a July 2025 Bloomberg interview that distressed swaps are mostly costly failures, pointing to asymmetric information, fragmented creditor groups, and overly optimistic valuation assumptions as the reasons they so often collapse into repeat distress.
Not everyone reads it so darkly. Fitch Ratings, in a March 2025 report, framed the surge as a cycle-specific response to the post-pandemic rate shock, noting that exchanges deliver recoveries of 78% to 93% against just 40% to 51% for bankruptcies. On that view, some of these deals are proactive balance-sheet management rather than terminal decline.
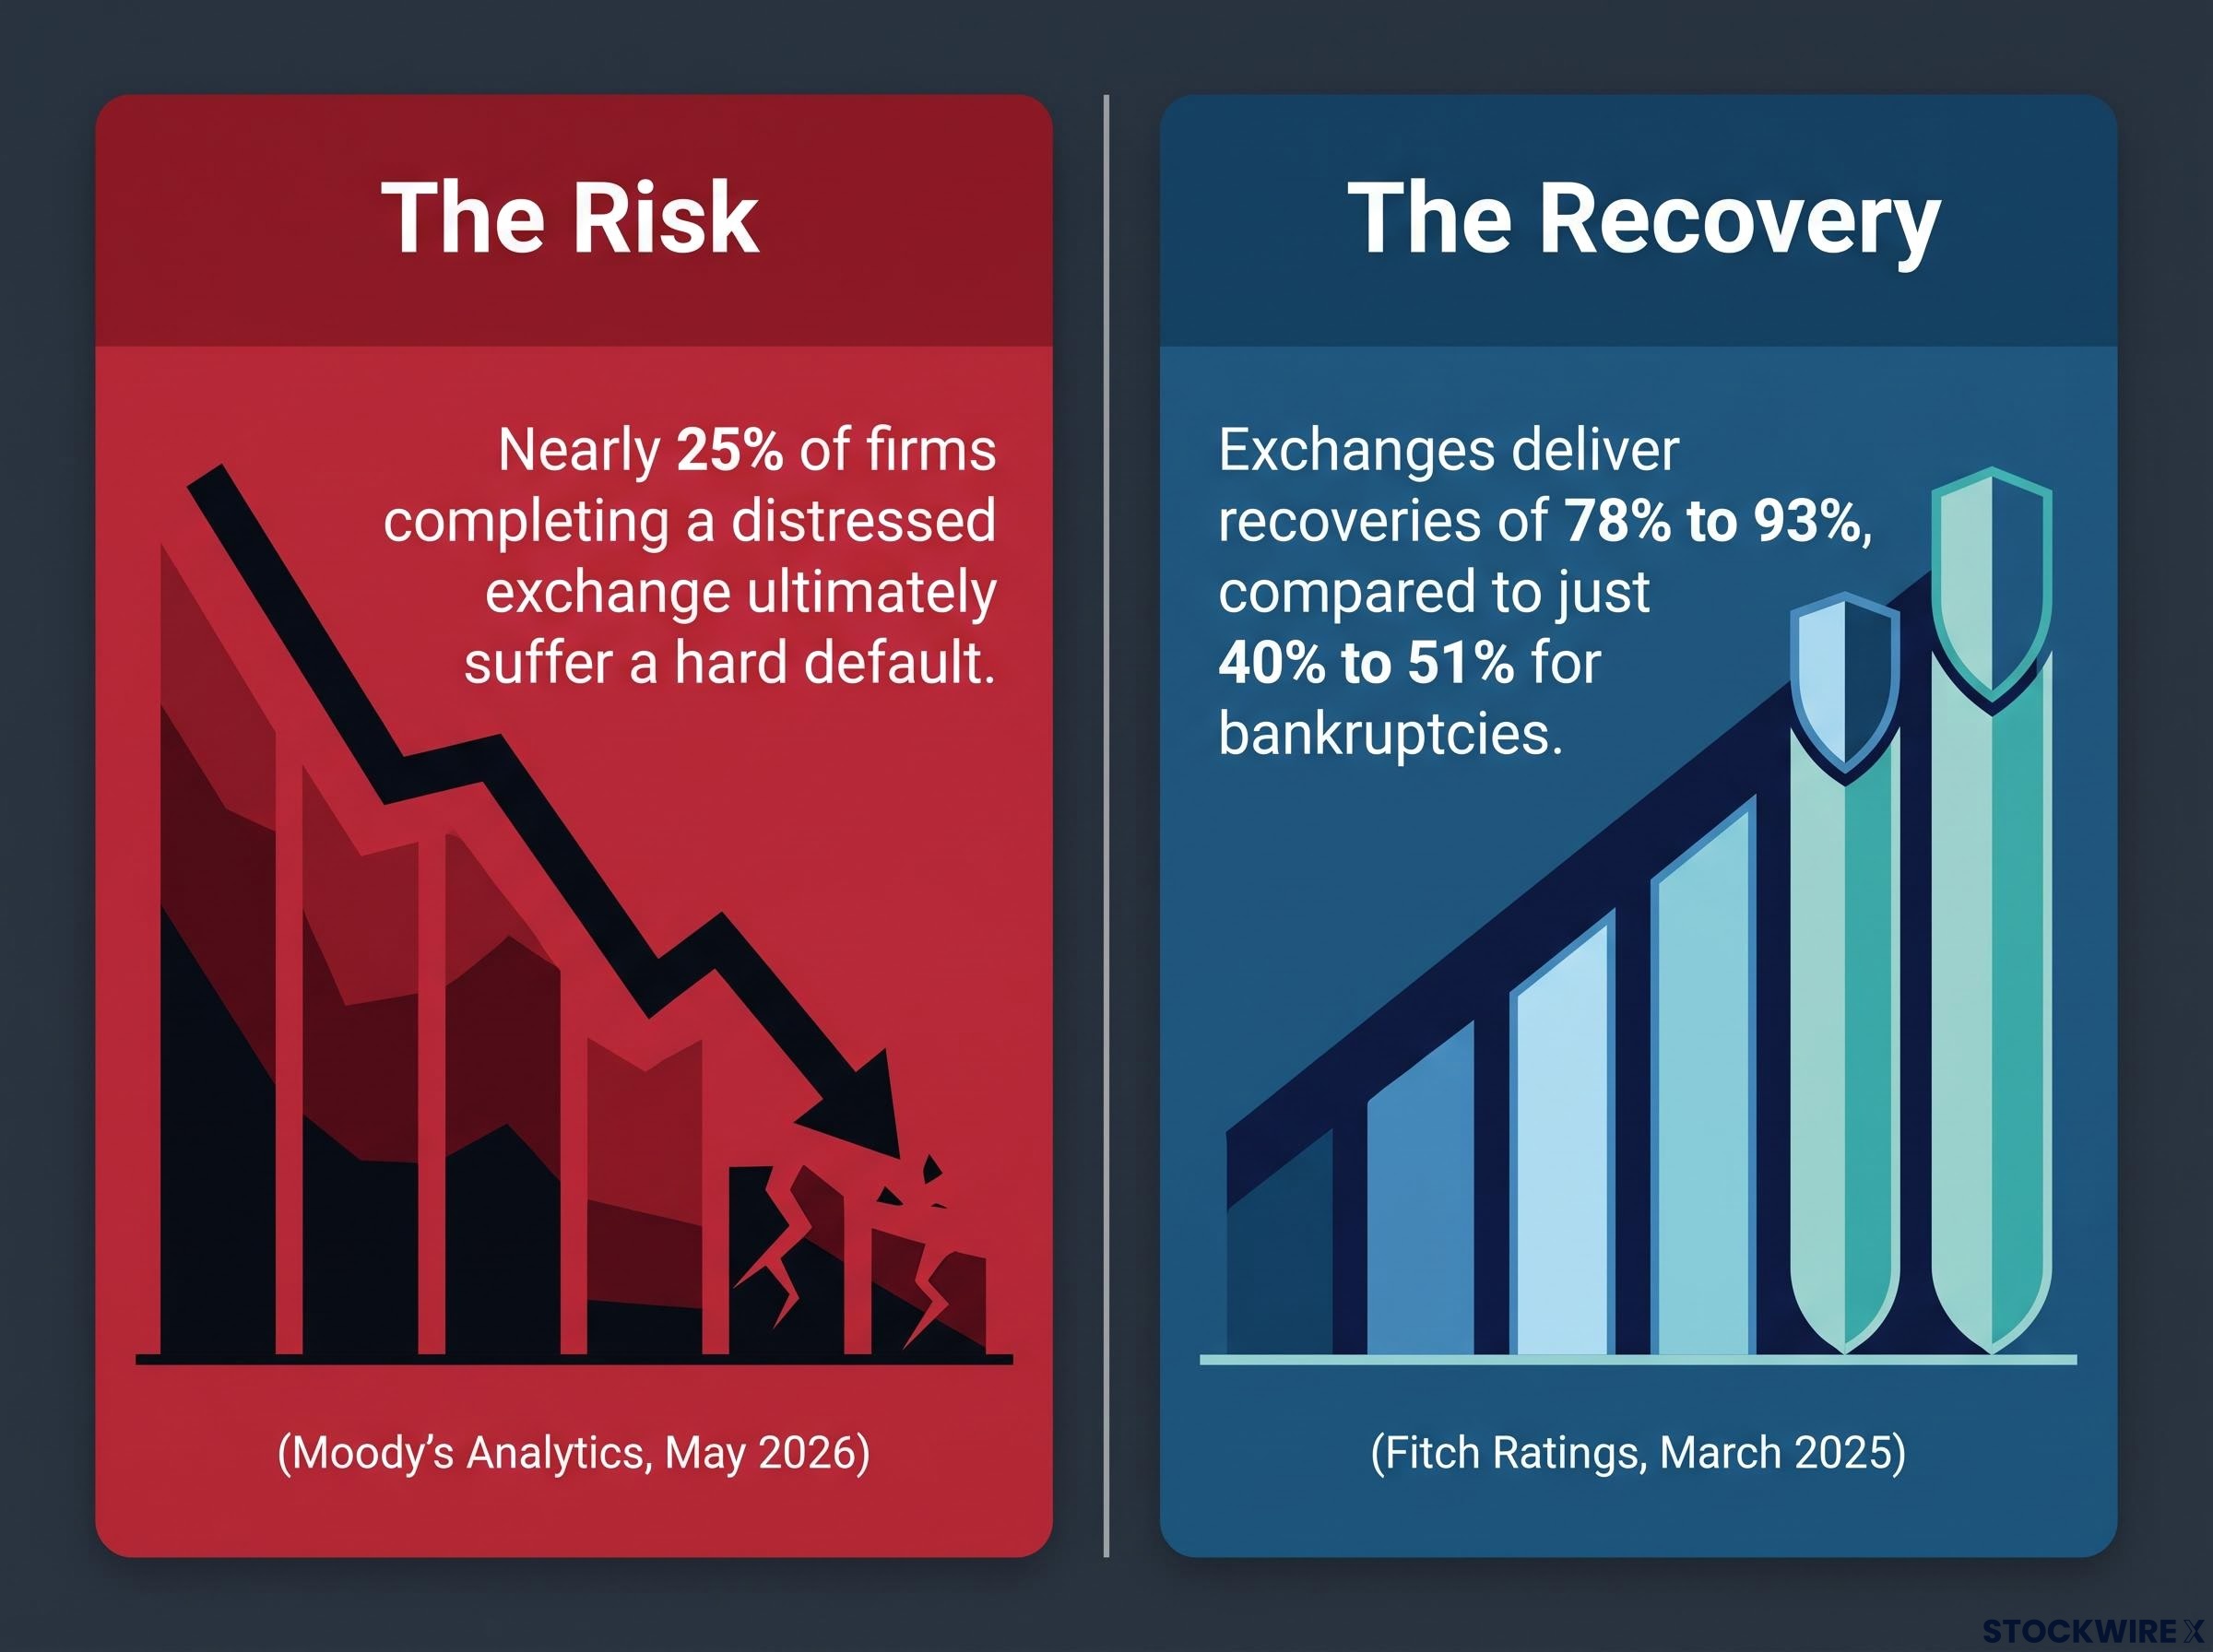
The competing frameworks come down to this: Fitch sees a cyclical tool for managing refinancing risk, while Moody’s and Altman see structural solvency stress that capital injections have merely papered over. For you, the practical takeaway is defensive. When a company you hold announces a distressed debt exchange, treat it as a serious warning about underlying solvency, not a clean fix, because roughly one in four to nearly half of these deals end in default anyway.
Tightening bank standards and the squeeze on shadow lenders
If corporate failures are the symptom, restricted capital is part of the cause. The banking system is where the tightening pressure builds, and the latest survey shows it has not let up.
The Federal Reserve’s Senior Loan Officer Opinion Survey (SLOOS) for July 2026, released in August, found that lending standards sit at the tighter end of their range since 2005 for nearly every loan category. The notable exception is commercial and industrial lending to businesses, where standards are actually easier than their historical midpoint.
The tightest restrictions fall on the categories closest to ordinary households and property:
- Household loans, held at the tighter end of the range since 2005
- Commercial real estate (CRE) lending, also flagged as elevated relative to long-run norms
There is a second transmission channel that deserves attention, because it is where the squeeze quietly spreads. According to Trepp analysis of the April 2026 SLOOS, banks tightened standards on loans to non-depository financial institutions across every category, including the consumer credit intermediaries and mortgage credit intermediaries that funnel credit to households.
These non-depository lenders, often called shadow banks because they lend without holding deposits, rely heavily on bank funding to operate. When traditional banks curb that exposure, the credit drought reaches consumers indirectly, even where a household never deals with a bank directly.
The banking pullback documented in the SLOOS connects to a wider set of rate-sensitive fault lines, including a $930 billion commercial real estate maturity wall in 2026 alone and private credit borrowers where more than one-third now have interest costs exceeding earnings, risks the aggregate resilience framing consistently understates.
What this means for your expectations is straightforward. With banks pulling back from the intermediaries that supply consumer credit, borrowing costs for the average household will stay painfully high, and that pressure should temper any assumptions you hold about retail and discretionary spending strength in the quarters ahead.
The consumer squeeze migrates up the income ladder
The headline consumer looks fine. Dig into how households are actually financing their lives, and a different reality appears, one that no longer stops at the lower end of the income scale.
Consider the mechanics of cash-out mortgage refinancing. In the second quarter, 57% of Americans who completed cash-out refinancings accepted a higher interest rate to tap their home equity, according to the original reporting. Paying more to borrow against your own house is a cash-flow distress signal, not opportunistic financial planning.
Everyday costs compound the strain. Gasoline prices were running roughly $1.20 per gallon higher than February levels at the time of reporting, and households have been trading down to cheaper proteins like chicken in place of beef.
Savings depletion is the structural fragility beneath the spending headline: the US personal savings rate sat at just 4.0% in February 2026, and when affluent households eventually pull back on discretionary outlays, the mass-market consumption propped up by buffer spending is the first casualty.
The more consequential shift is happening at the top. Bank of America Institute research shows households in the top 10% of the income distribution account for approximately 36.2% of annual discretionary spending, nearly as much as the bottom 70% combined.
That spending is tightly tethered to the stock market. Bank of America economists note a strong correlation between spending growth among the top 5% of households and the performance of the S&P 500, and estimate it typically takes a sustained equity drawdown of 20% or more to trigger a material negative wealth effect.
Here is the implication you should not miss. Because affluent spending is wired to equity performance, you should watch the stock market not only for your own asset returns but as a direct trigger for potential service-sector job losses. When wealthy households reassess their paper wealth, they cut travel, dining, and luxury before their income ever changes.
Airlines reveal the bifurcated consumer
The airline sector puts this split on clear display. Carriers including United and American have been trimming capacity in response to falling unit ticket sales, evidence that economy-cabin demand is softening even as the headline economy holds.
Premium demand has propped up revenue so far, leaving airlines increasingly reliant on business and first-class travellers. That reliance is precisely the vulnerability. Should equity markets sustain a drawdown of 20% or more, the affluent flyers holding up premium revenue are exactly the cohort likely to pull back, exposing the industry on both ends of the cabin at once.
Synthesising corporate defaults and consumer strain into a portfolio strategy
Put it together and the credit stress data is real, but it is not a guaranteed recession. Several serious caveats keep this from being a straightforward bearish call, and weighing them is the discipline that separates a measured investor from a reactive one.
- Normalisation versus insolvency. Some of the tightening and rising defaults reflect the unwinding of the extraordinarily easy 2021 to 2022 credit conditions rather than fresh distress. January and April 2026 SLOOS readings showed basically unchanged standards for most household loans and some easing on auto loans, evidence the tightening impulse has partially moderated.
- Sector concentration. As the filings data makes plain, the stress clusters in leveraged, sponsor-owned, industrial, discretionary, and tech segments. Aggregate tallies overstate how broad the underlying weakness actually is.
- Labour and consumer resilience. Bank of America Institute’s August 2026 “great convergence” report found spending growth converging across income groups, with overall household finances still solid, healthy labour markets and low delinquencies working against a broad consumer-led downturn.
The read you should take is one of calibration, not alarm. Weight these distress signals against still-resilient labour data, and adjust your defensive positions only if job losses begin accelerating in the service sectors tied to affluent spending.
Pipeline inflation pressure remains the upstream driver that keeps credit conditions tighter than corporate balance sheets can comfortably absorb: super-core PPI held at 4.7% year-over-year in August 2026, a figure that forecloses the Fed easing that overleveraged companies are implicitly relying on for refinancing relief.
The ultimate confirmation signal to monitor is employment in high-income metros and tourist hubs. That is the lagging indicator that would turn a contained, leverage-specific stress into something genuinely broad.
This article is for informational purposes only and should not be considered financial advice. Investors should conduct their own research and consult with financial professionals before making investment decisions. Past performance does not guarantee future results, and financial projections are subject to market conditions and various risk factors.