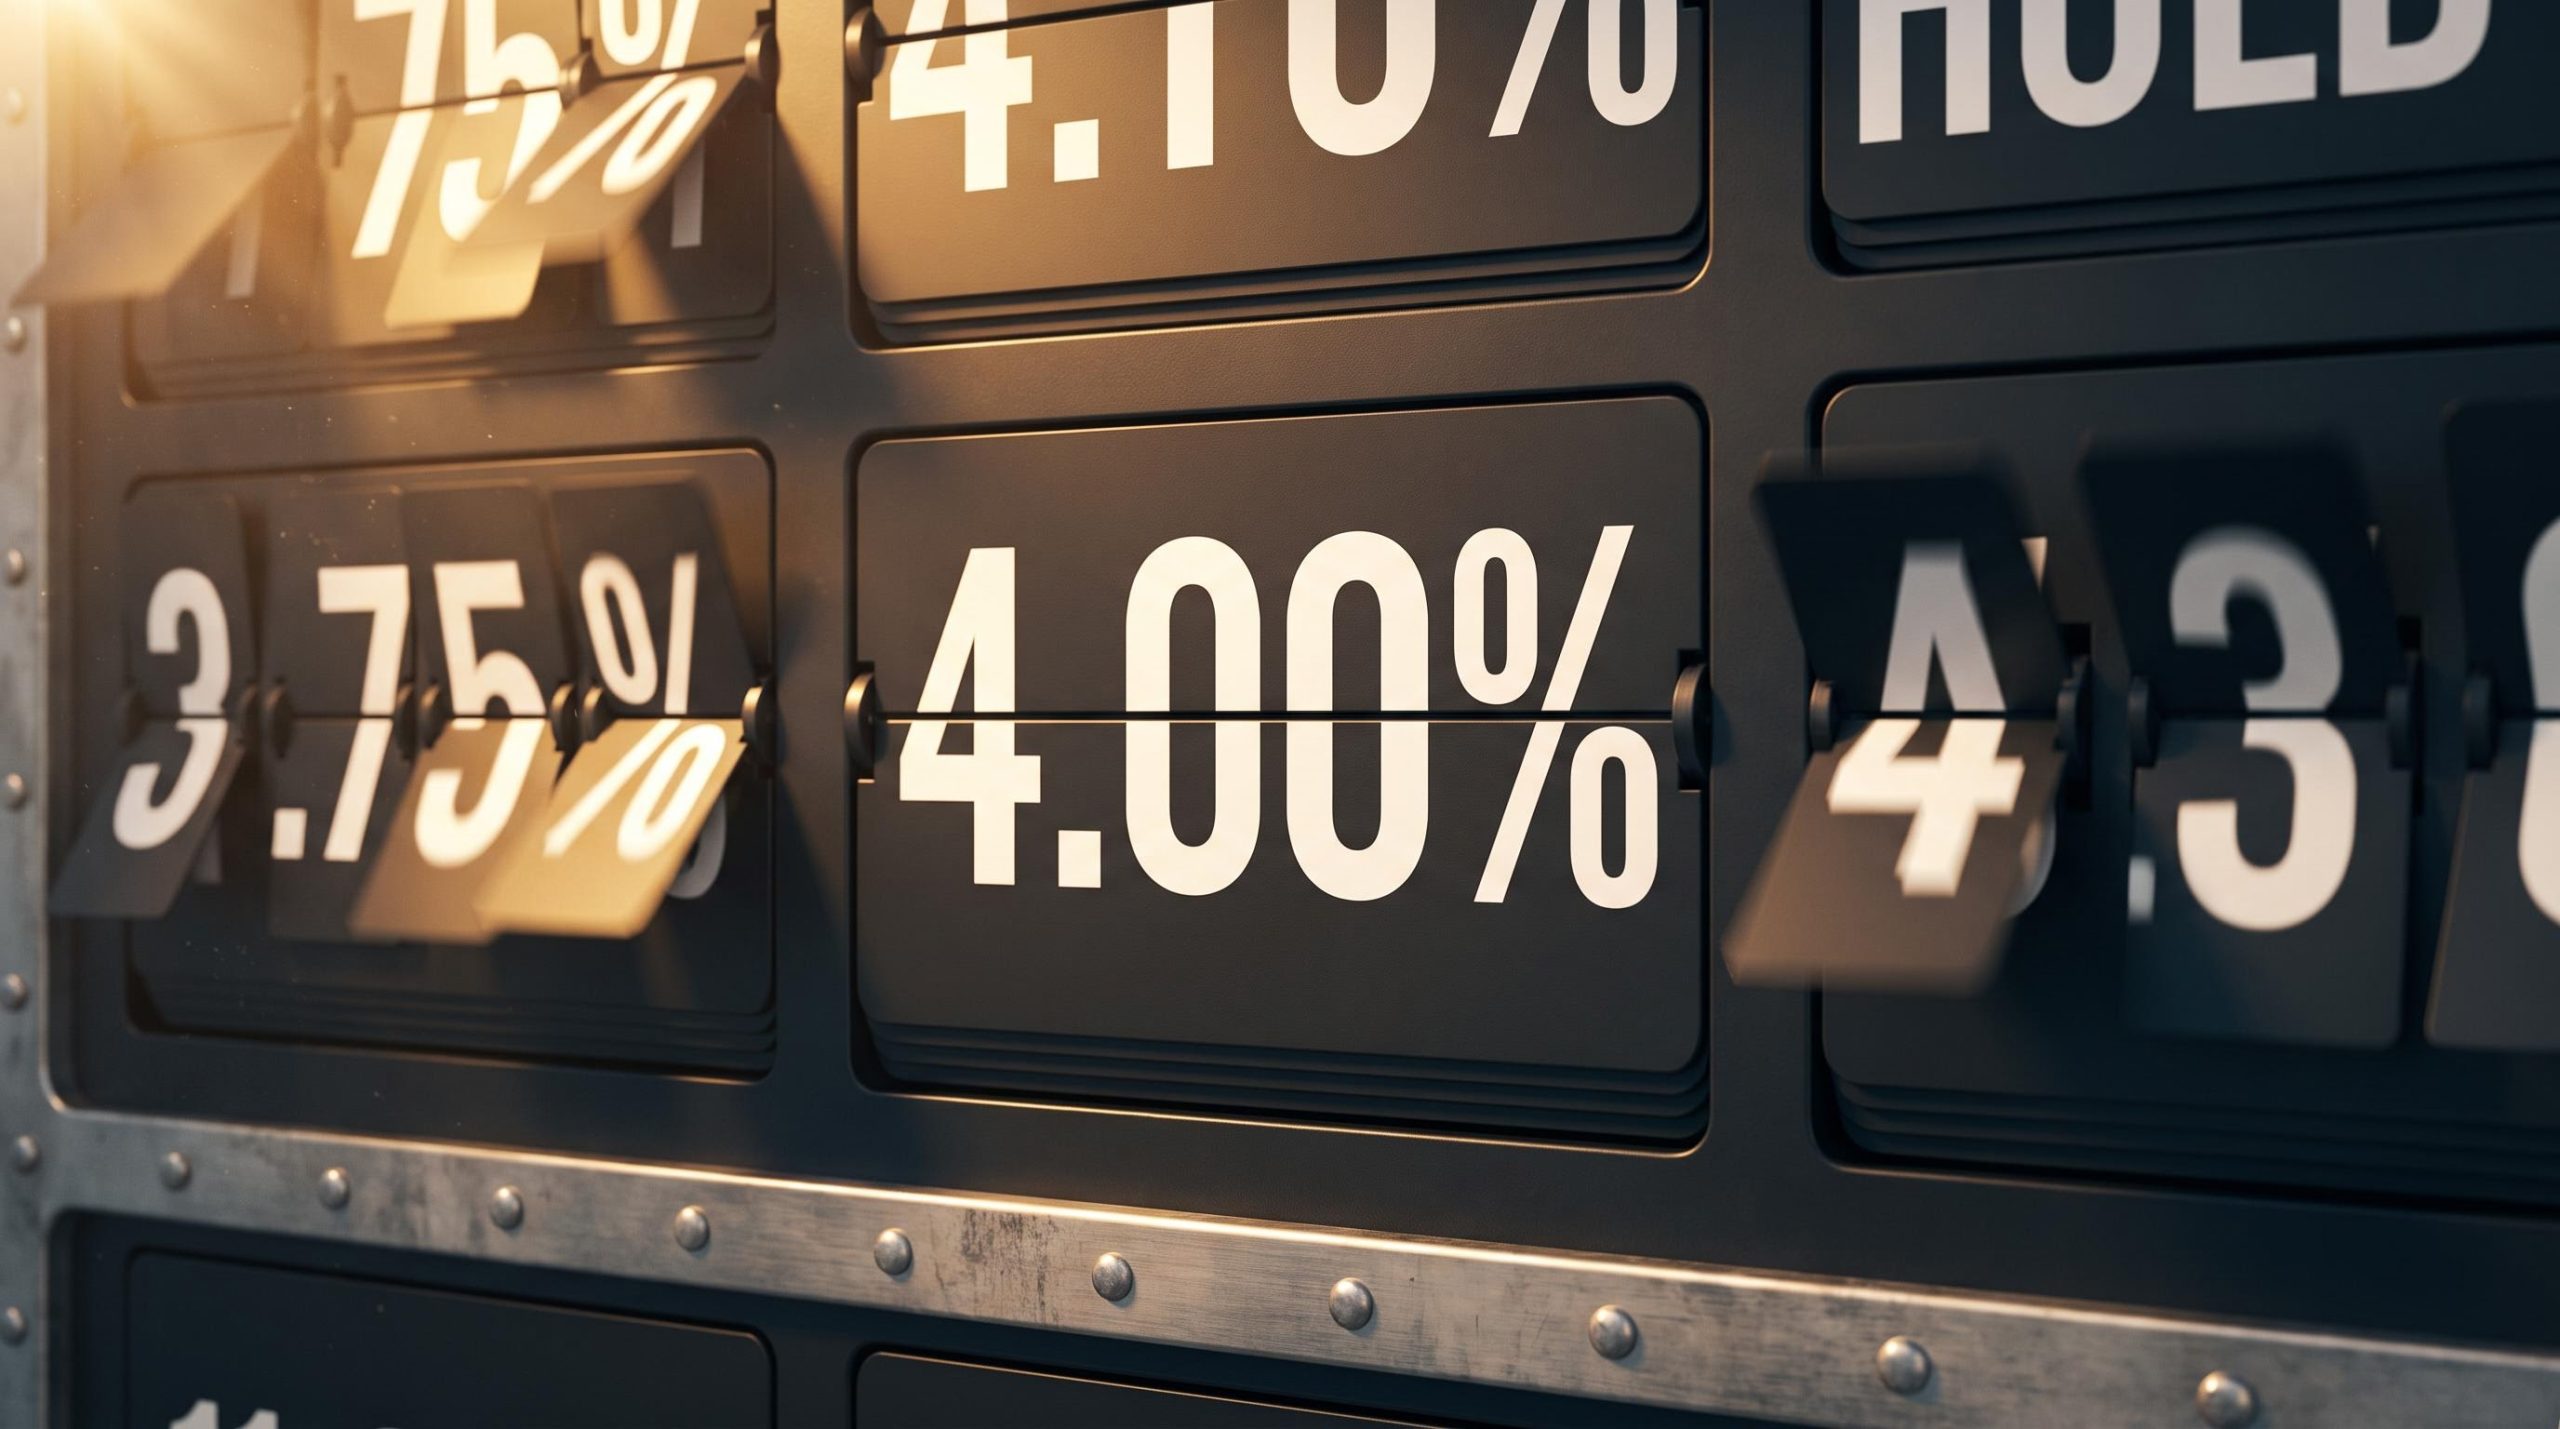
The Fed Funds Rate just crossed 4.00% for the first time in this tightening cycle, and it did so on a unanimous vote. Now Wall Street is stuck on a single question: does December bring another quarter-point, or was that the last one?
The September 16, 2026 hike did not settle that debate. It started a new one. UOB’s economics team sees two more increases coming. Goldman Sachs sees none. The distance between those two calls is exactly where your positioning decisions now live.
What follows here gives you a structured way to weigh the competing forecasts, understand what is actually driving them, and spot the three inflation forces that could push tightening further than any bank is currently willing to project.
What the Fed just decided, and why the vote being 12-0 matters
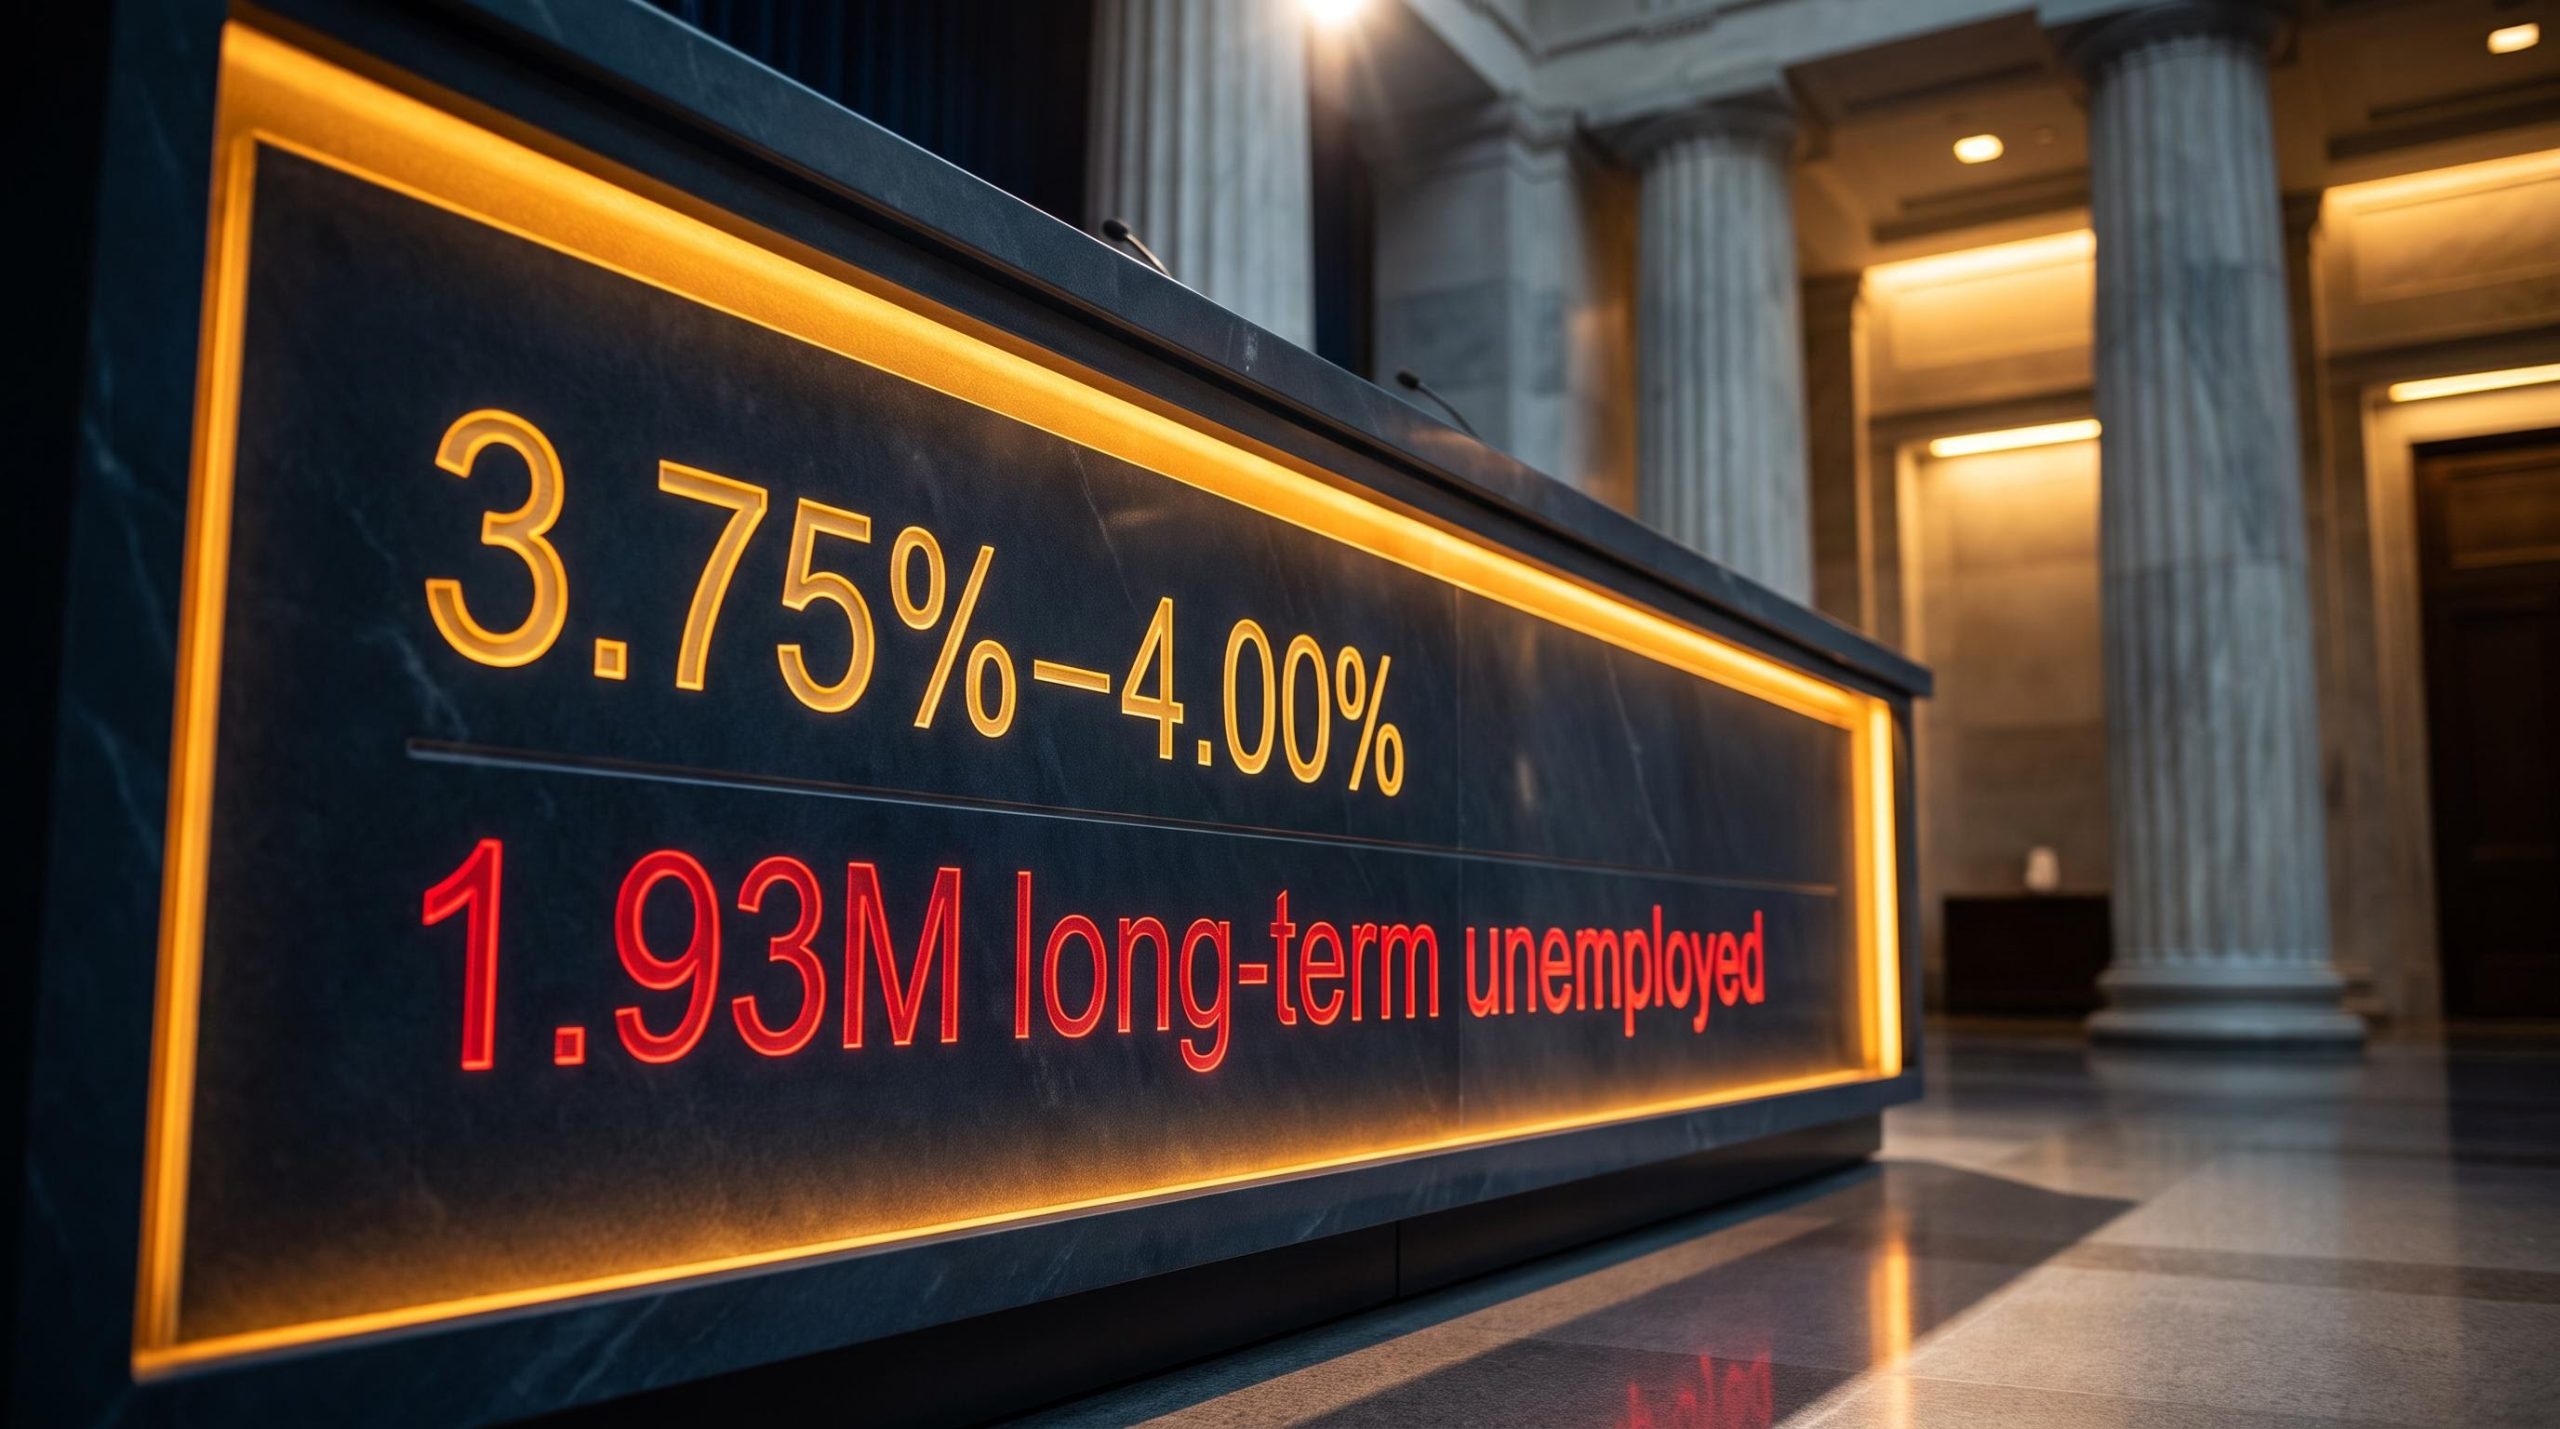
The Federal Reserve lifted its target range by 25 basis points to 3.75%-4.00%, effective September 16, 2026, and every single voting member backed it. The vote was 12-0.
That unanimity is the detail worth pausing on. A hike passed without a single dissenting voice tells you there is no internal faction inside the Federal Open Market Committee (FOMC) pulling in the dovish direction, no one holding a marker that says “slow down” if the incoming data argues for more.
FOMC vote splits carry forward-looking information that the headline rate decision does not: a unanimous hike removes the dovish brake that dissenting votes normally provide, compressing the range of near-term policy outcomes and shifting the burden of surprise entirely onto the incoming data.
For you, that removes a signal you might otherwise have leaned on. When a hike arrives with one or two dissents, investors often read those dissents as a soft brake on future action. This time there is no brake to point to.
The Fed’s own words explain why the conviction runs deep. In its statement, the Committee described economic activity as “expanding at a solid pace” and said “inflation remains elevated.”
The FOMC September 2026 press release confirmed the unanimous 12-0 vote and restated the Committee’s formal language describing economic activity as expanding at a solid pace, with inflation still elevated enough to warrant continued action toward the 2% target.
“Today’s policy action will support a timelier return to the Committee’s 2 percent goal.”
The Committee’s reasoning rested on three pillars:
- Economic conditions, with domestic spending, productivity, and capital investment all described as resilient
- Labour, with job gains keeping pace with the workforce and the unemployment rate little changed
- Inflation, still sitting well above the 2% target and, in the Fed’s view, warranting a faster path back to it
Here is the macro backdrop the Committee was staring at when it made the call.
| Indicator | Value | Period |
|---|---|---|
| CPI (all items, y/y) | 3.4% | August 2026 |
| Core CPI (y/y) | 2.4% | August 2026 |
| Core PCE (y/y) | 3.3% | July 2026 |
| WTI crude | $91.48/bbl (+17.87% m/m) | Early September 2026 |
| Brent crude | $96.28/bbl (+18.03% m/m) | Early September 2026 |
A unanimous hike with headline CPI at 3.4% and core PCE at 3.3% tells you the Fed sees no near-term reason to pause, and that the dovish signal you might have hunted for in the vote count simply is not there.
When big ASX news breaks, our subscribers know first
UOB’s two-hike forecast explained: December 2026, then Q1 2027
Suan Teck Kin and Alvin Liew at UOB view the September decision as the beginning of a brief additional tightening phase, not an isolated move. Their post-September view marks a clear revision: before the meeting, they had expected the Fed to sit still through the rest of 2026 and only begin cutting in 2027.
The first tell in their reasoning is what they ruled out. UOB does not expect a back-to-back hike at the October FOMC, and the reason is the calendar rather than the data. That meeting sits too close to the November 3 midterm elections, and the bank reads the Fed as unwilling to act in that window.
From there the logic builds toward two moves. UOB’s base case is two further 25-basis-point hikes, one in December 2026 and one in Q1 2027, which would lift the target range to 4.25%-4.50%.
After that, UOB expects the Fed to hold. The bank anticipates inflation cooling in a sustained and convincing manner through the second half of 2027, and that expectation is what underpins the hold-through-2027 call. Even in this more hawkish path, there is a defined end point.
The decision to skip October is arguably the most revealing part of the forecast. It shows UOB reading the political calendar alongside the inflation prints, not just the numbers in isolation.
How UOB’s view compares to Wall Street
Place UOB against the rest of the Street and the gap is stark. Goldman Sachs and Barclays expect the September move to be the last one this year. J.P. Morgan sees December but not Q1. UOB extends the furthest of the credibly sourced forecasts.
| Institution | December 2026 hike | Q1 2027 hike | Implied terminal rate |
|---|---|---|---|
| UOB | Yes | Yes | 4.25%-4.50% |
| J.P. Morgan | Yes | No | Long-run estimate lifted to 3.25% |
| Goldman Sachs | No | No | Hold at 3.75%-4.00% |
| Barclays | No | No | Hold at 3.75%-4.00% |
Bank of America has reportedly forecast three hikes starting in September, though that figure is not independently confirmed. The disagreement even reaches inside J.P. Morgan itself: David Kelly, Chief Global Strategist at JPMorgan Asset Management, argued markets were premature in pricing a 60% probability of a September hike, pointing to slowing job and wage growth as disinflationary forces.
This is not UOB being contrarian for its own sake. It is an honestly unsettled question, and the gap between Goldman’s stop-after-September view and UOB’s two-more-hikes view is not a modelling quibble. It is a fundamental split over how persistent inflation really is, and whichever side proves right decides whether 4.25%-4.50% becomes the ceiling or just another step up.
The three inflation forces that could push rates even higher
UOB is watching three variables for upside risk beyond its December and Q1 base case. Each looks manageable on its own. The problem is that all three are running at once, with fade timelines nobody can pin down, and that combination is precisely why UOB flags risk to its own forecast.
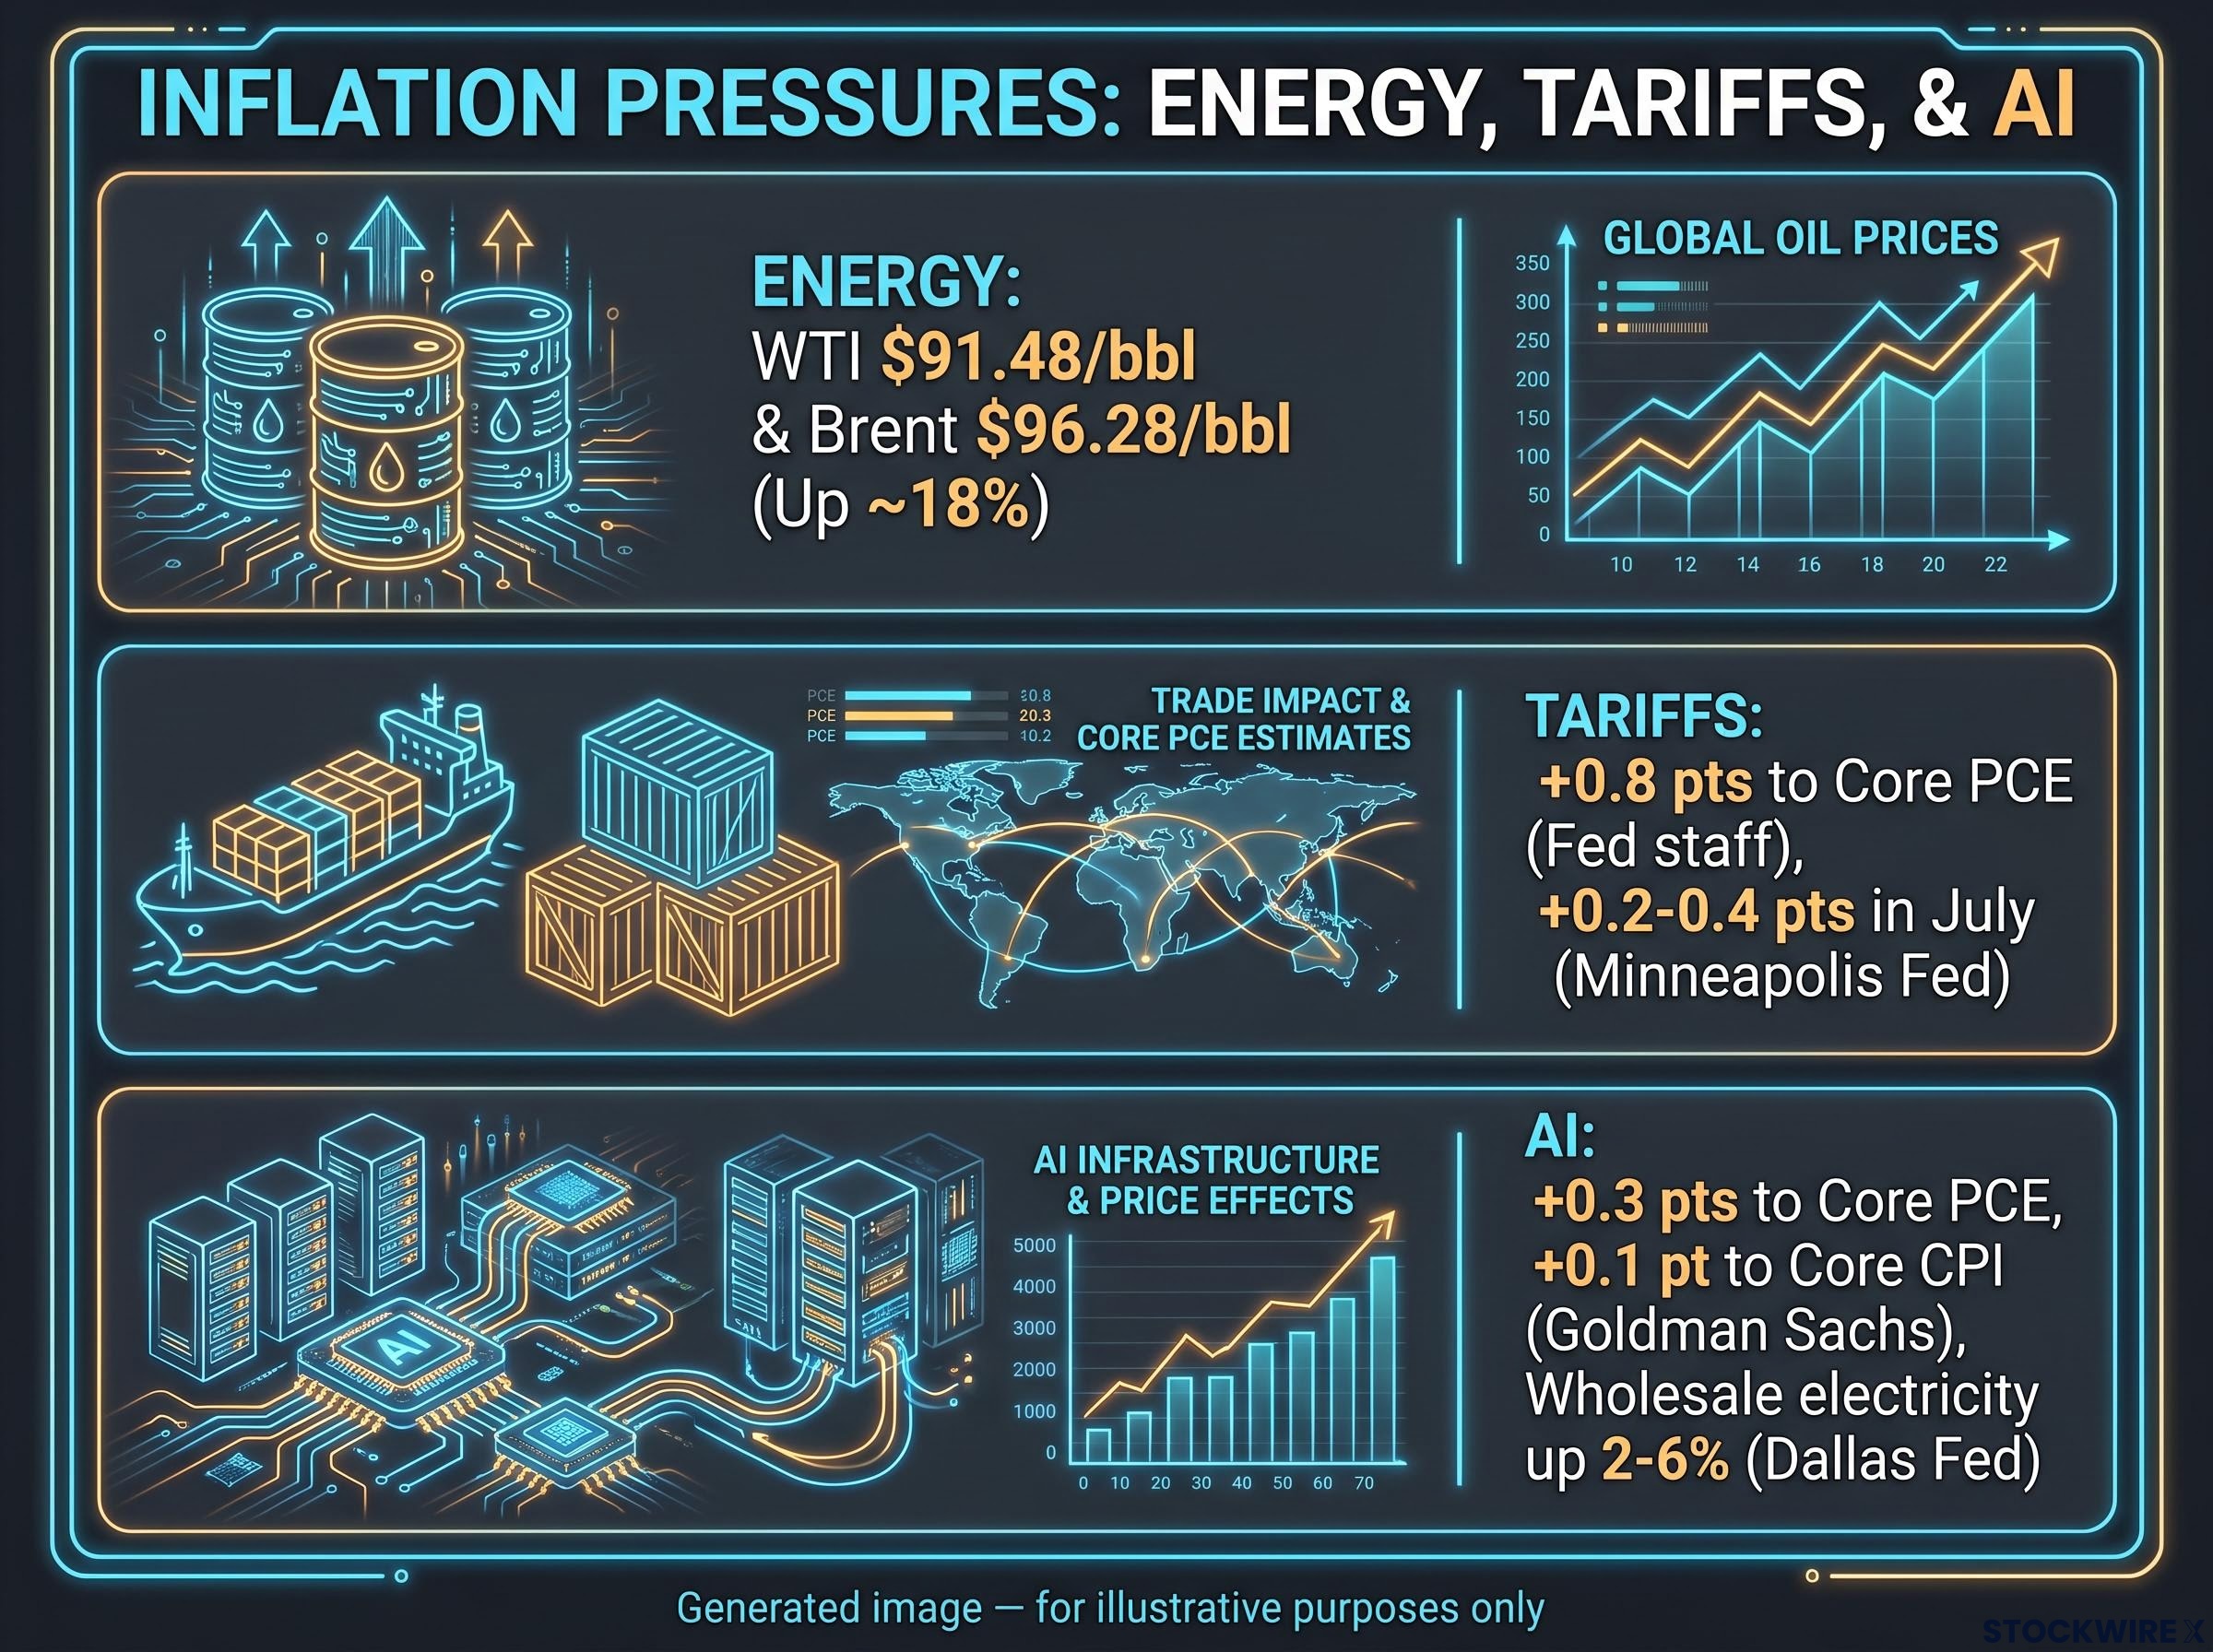
- Energy. WTI sits at $91.48 and Brent at $96.28, both up roughly 18% over the prior month, with the prolonged Strait of Hormuz standoff as the proximate cause. Sustained oil spikes feed straight into headline inflation and then bleed into core through transport, goods, and services costs. If prices do not reverse, the Fed’s own data starts to argue for more action.
- Tariffs. Fed staff research estimates tariffs raised core goods PCE prices by about 3.1% through February 2026, adding roughly 0.8 percentage points to core PCE overall. Minneapolis Fed work puts the July contribution at 0.2-0.4 percentage points, while Allianz Research pegs the full-year 2026 contribution near 0.3 percentage points and expects it to fade toward zero in the second half. Whether that fade actually arrives on schedule is the live debate.
- AI. The inflation contribution here is small in absolute terms but concentrated. Goldman Sachs estimates AI-related pressures have added about 0.3 percentage points to annual core PCE and 0.1 percentage point to core CPI, largely through electricity and data-centre demand. The Dallas Fed finds AI has pushed average wholesale electricity prices up 2-6%.
The AI risk is one of timing: investment demand arriving before the productivity gains that would eventually offset it.
The AI inflation debate extends beyond electricity and data-centre demand: BCA Research’s Peter Berezin argues that even under AI’s most optimistic productivity scenario the equilibrium real interest rate would likely rise rather than fall, meaning the Fed may be calibrating its terminal rate on a structurally flawed premise.
“The AI Capex Boom is inflationary.”
That line, from Deutsche Bank strategist George Saravelos, captures the near-term concern. Productivity may cool inflation later, but the buildout is landing first.
Here is what this means for you. If energy prices hold and tariff pass-through proves stickier than Allianz projects, the Fed’s own numbers will compel action beyond UOB’s Q1 2027 call. In that scenario, two hikes is a floor, not a ceiling, and the releases to watch closest are oil inventories and geopolitics for energy, goods PPI for the tariff fade, and electricity and data-centre pricing for AI spillover.
What history says about Fed tightening at this stage of the cycle
Two tightening cycles get invoked whenever the Fed hikes into already-elevated inflation, and they point in uncomfortably different directions.
The first is 1994-95. Under Alan Greenspan, the Fed raised the funds rate from 3.0% to 6.0%, roughly 300 basis points, in just over a year, moving ahead of inflation rather than chasing it. It is the only tightening cycle in the last 35 years that did not precede a recession, which is why it carries soft-landing status.
But the soft landing came with damage. The speed and surprise of the 1994 hikes pushed real rates roughly 200 basis points above neutral at the peak and triggered losses across equities, mortgage-backed bonds, and emerging markets, with Mexico hit especially hard.
The second precedent is 2004-06, the “measured pace” cycle of 25 basis points per meeting. Gradualism reduced the surprise, which markets liked, but it also gave leverage and risk-taking room to build, feeding imbalances that later contributed to the conditions ahead of the financial crisis.
Two lessons fall out of these cases:
- Preemptive, fast hikes can dodge recession but still deliver serious market stress, as 1994 showed
- Gradual hikes reduce surprise but let vulnerabilities accumulate quietly, as 2004-06 showed
| Cycle | Rate move and pace | Key risk or outcome |
|---|---|---|
| 1994-95 | 3.0% to 6.0% (~300 bps), fast and preemptive | Only non-recession tightening in 35 years, but broad market stress |
| 2004-06 | 25 bps per meeting, measured | Low surprise, but leverage and imbalances built up |
| Current (2026) | 3.75%-4.00%, potentially toward 4.25%-4.50% | 30-year yields near 5.2%-5.34%, highest since 2007 |
Here is the calibration point for you. If this cycle extends to UOB’s projected 4.25%-4.50% on the back of energy and AI pressure, the pace of the added hikes will matter more than the destination. A 1994-style burst of speed would compress bond and equity prices in a way the slower 2004 analogy does not prepare you for, which is why duration risk deserves attention now rather than after the fact.
The pace of Fed hikes separates mild tightening cycles, where the S&P 500 has returned as much as 18% over four months, from aggressive ones, where losses approached 6%, a 24-percentage-point spread that makes classifying the cycle’s character the more consequential analytical task than identifying its direction.
Positioning through the rate plateau: what the December and Q1 decisions will actually settle
December 2026 is the first real test of which forecast is right. If the inflation data between now and then supports UOB’s thesis, a second hike becomes the base case for most of the Street. If it cools, Goldman and Barclays are vindicated and the September move stands as the last.
That makes the coming data the actual signal, not background noise. Three releases carry the most weight:
- October CPI
- November CPI
- October core PCE
Watch those with UOB’s December trigger in mind, because they are the mechanism by which the institutional forecast gap closes. The reader tracking them is positioned to act before the market fully prices the outcome, rather than after.
Two portfolio scenarios follow from the split:
- Hike scenario (UOB base case): Two or more further increases lift the range toward 4.25%-4.50%. With 30-year yields already near 5.2%-5.34%, duration warrants defensive management and rate-sensitive equity sectors face further multiple compression. Historically, equities have posted a median -2% return in the three months around hiking onset before often recovering, which is a calibration tool rather than a forecast.
Duration risk becomes the central portfolio variable when 30-year yields sit near 5.2%-5.34%: a 100-basis-point rise from that level produces roughly a 24-26% capital loss on a 30-year zero-coupon bond, meaning long-dated fixed income can destroy more capital than equities in the same window if the UOB scenario materialises.
- Pause scenario (Goldman, Barclays): If the Fed holds after September, the case for adding duration strengthens and the urgency of defensive rotation fades.
Even in the hawkish path, UOB expects inflation to subside in the latter part of 2027, giving the tightening a defined end point rather than an open-ended climb.
This article is for informational purposes only and should not be considered financial advice. Investors should conduct their own research and consult with financial professionals before making investment decisions. Past performance does not guarantee future results, and these forward-looking forecasts are speculative and subject to change based on market developments and incoming data.