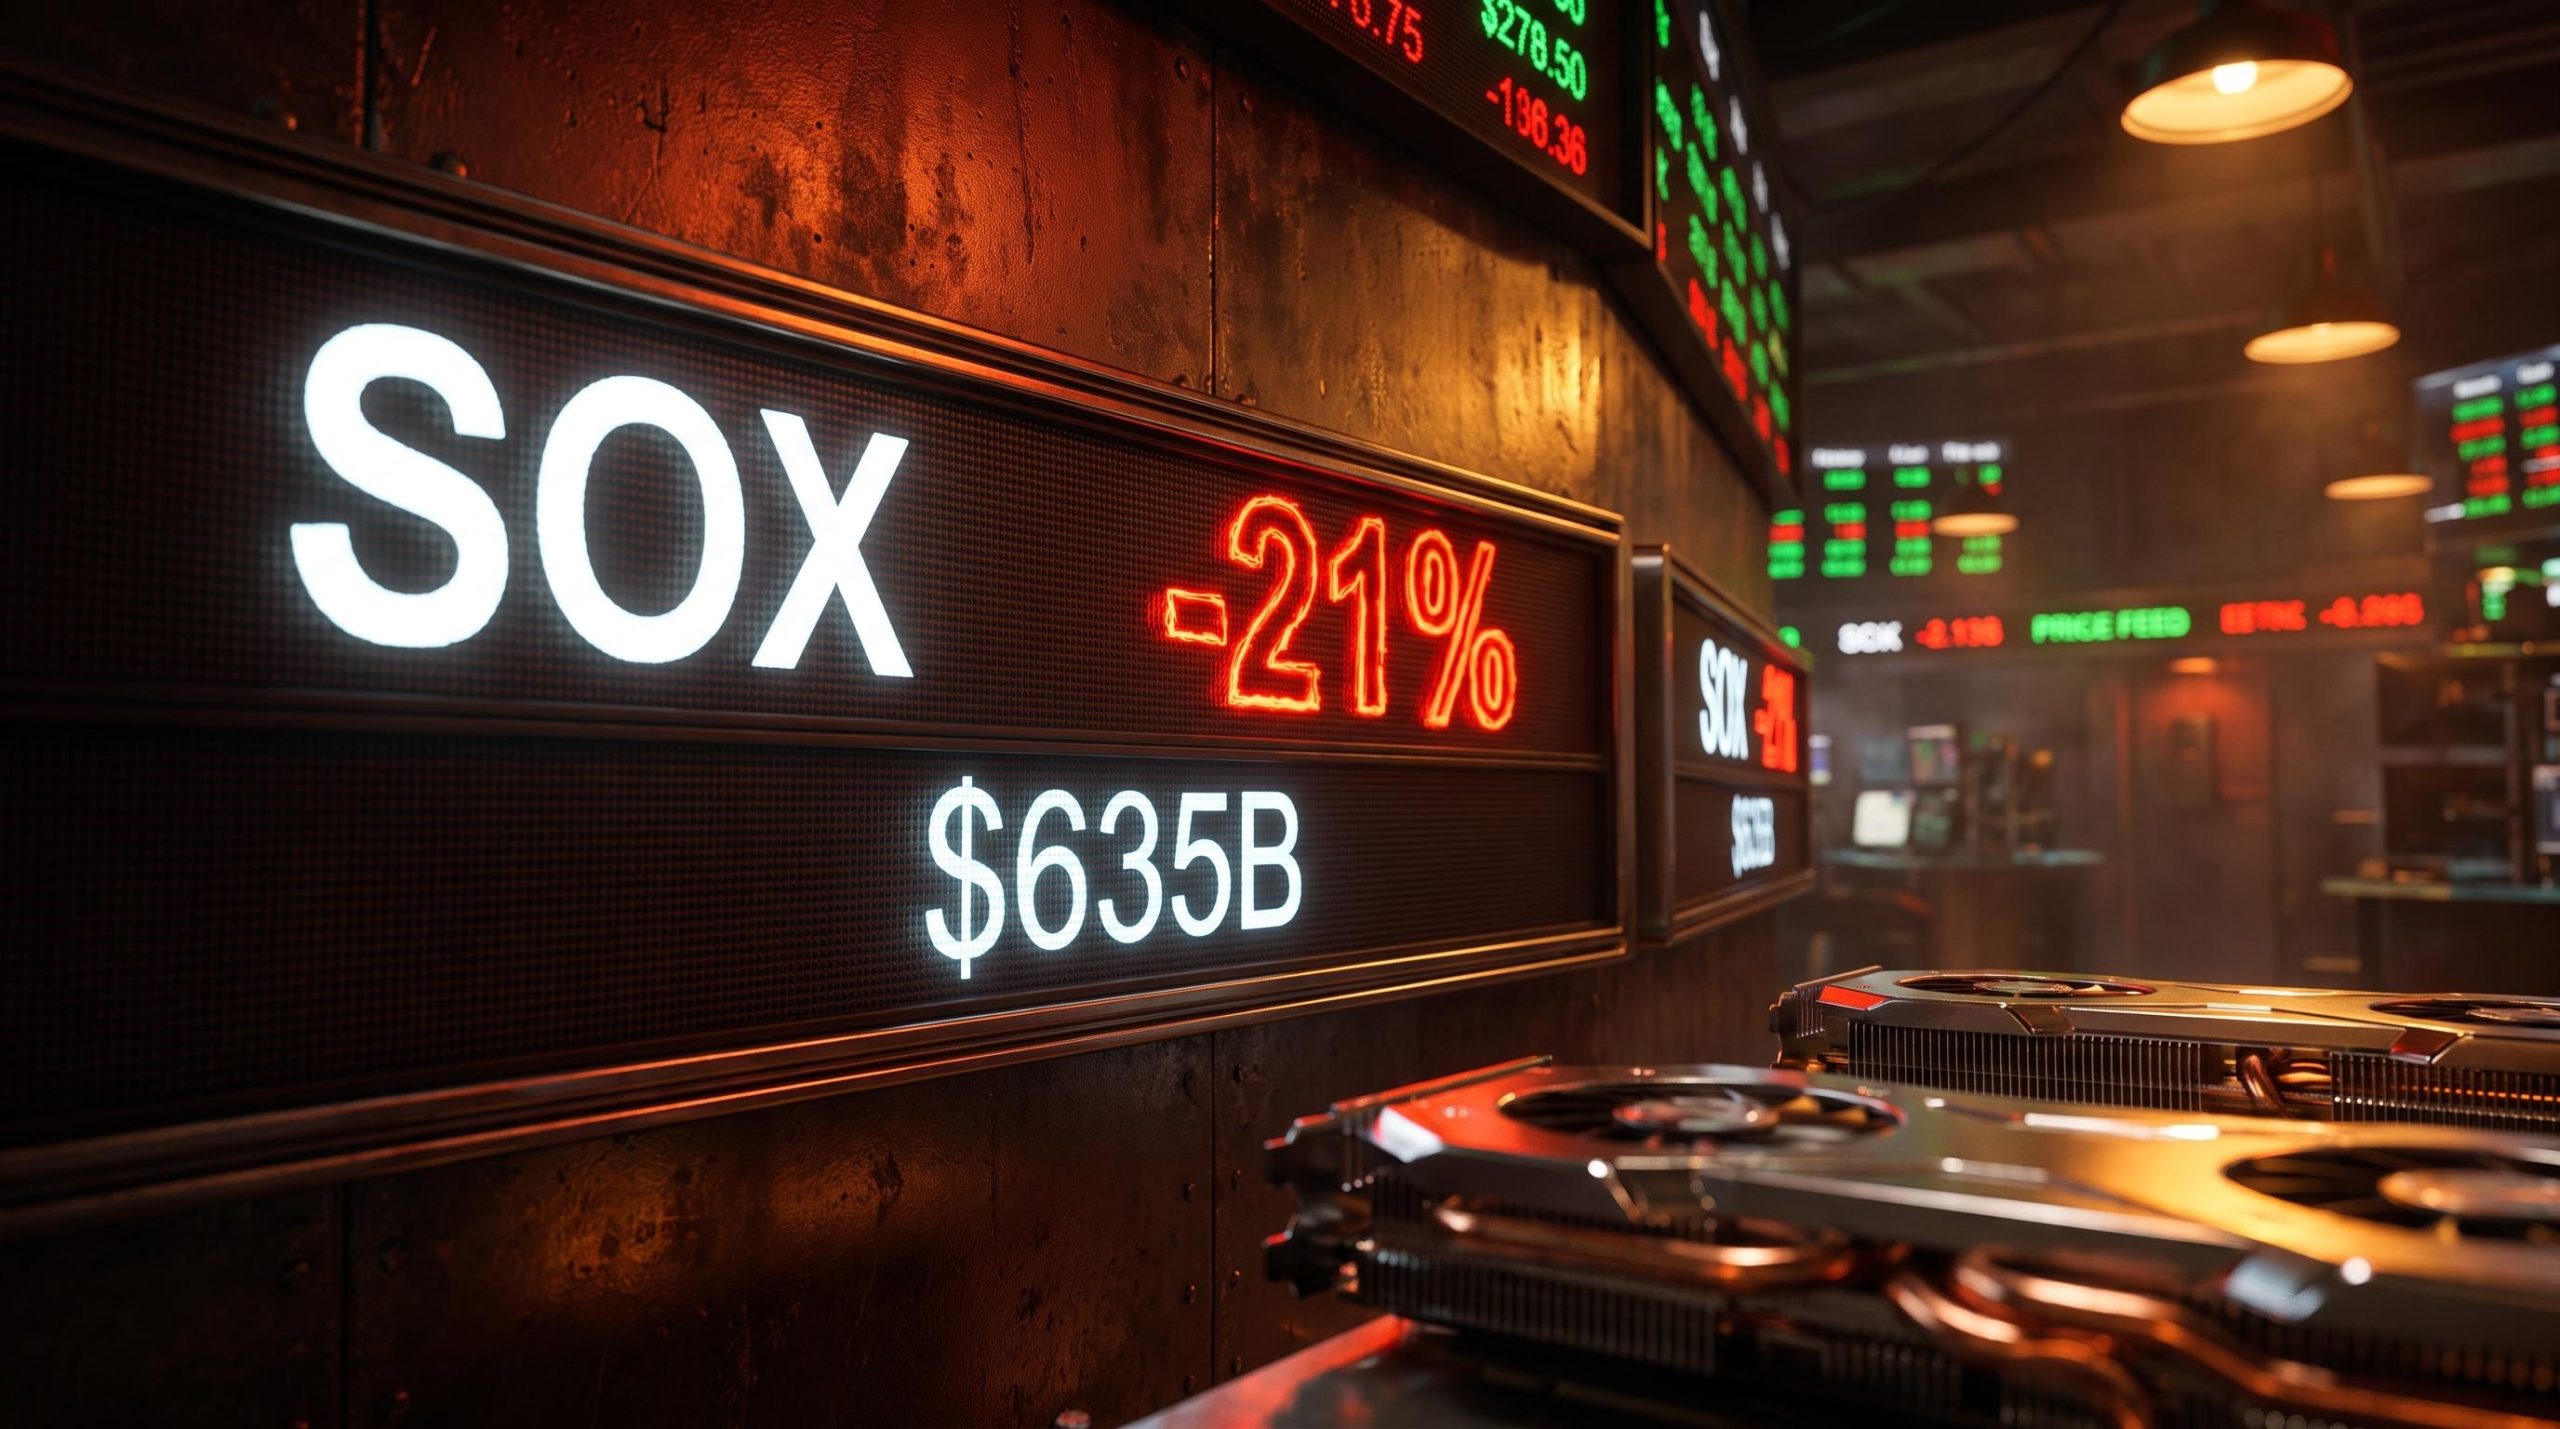
At 8:30 AM on 10 September 2026, the US Bureau of Labor Statistics released its Producer Price Index for August. Within minutes, the US Dollar Index pushed back above 99.00, and gold, silver, and Bitcoin all turned sharply lower in near-perfect lockstep.
Four assets that look unrelated on the surface moved together, all pulled by a single number about wholesale prices. That is what makes this session worth studying.
The PPI market reaction offered a rare, clean case study in how inflation data ripples across asset classes in real time. The causal chain from producer prices to the dollar to Treasury yields to non-yielding assets was visible as it happened, not reconstructed afterwards by analysts.
What follows here traces each link in that chain, so the next time an inflation print lands, the sequence is one you can recognise as it unfolds rather than one you piece together from the wreckage. The value is the mechanism, not the recap.
One inflation print, four markets moved in minutes
Start with the number, because the reaction only makes sense once the data does. Headline PPI for final demand rose 0.4% month-over-month in August on a seasonally adjusted basis, a clear beat on expectations.
The annual figure is where the research splits. The original source reported the August index climbing 2.4% on an annual basis, while subsequent data put wholesale inflation at 5.4% year-over-year, up from 4.8% in July and ahead of the 5.3% consensus.
A live data conflict, not a rounding issue Sources disagree on the annual PPI reading, ranging from 2.4% to 5.4% year-over-year. The exact figure is contested. The direction of the surprise is not: on every measure, the print came in hotter than the market expected.
The strength ran deeper than the headline. The sub-components confirmed that this was a broad beat rather than one volatile category dragging the index higher:
- Super-core PPI (final demand less foods, energy, and trade services): 0.3% month-over-month, 4.7% year-over-year
- Ex-food-and-energy PPI: 0.2% month-over-month, 4.6% year-over-year
- Headline PPI: 0.4% month-over-month (August 2026)
That breadth is what gave the print its power. A single hot category can be waved away as noise, seasonal distortion, or a one-off. Elevation across the core and super-core sub-indices tells you something harder to dismiss: pipeline inflation pressure has not broken, and the cost pressure sitting upstream of consumer prices is still building.
Core PPI persistence at 4.7% year-over-year was a feature of multiple 2026 prints, not just September: the June release saw headline PPI fall 0.3% month-over-month while core held at 4.7%, confirming that the structural pressure visible in August’s sub-components had been building for months.
For anyone tracking PPI at the sub-index level, that distinction is the whole game. It is what separates a knee-jerk reaction from an informed one, and it lets you read durable pressure before the crowd finishes pricing it in.
Attention shifted almost immediately to the next data points. Traders turned to Friday 11 September for the Consumer Price Index, expected to hold near 2.4% on the headline rate, alongside the preliminary University of Michigan consumer sentiment reading. This PPI print set the tone for a high-stakes week of data, and the market spent the session positioning for what came next.
When big ASX news breaks, our subscribers know first
Why the dollar surged and yields followed
A wholesale price index has no obvious connection to currency markets. The link runs through a sequence, and once you can see the steps, the dollar’s move stops looking arbitrary.
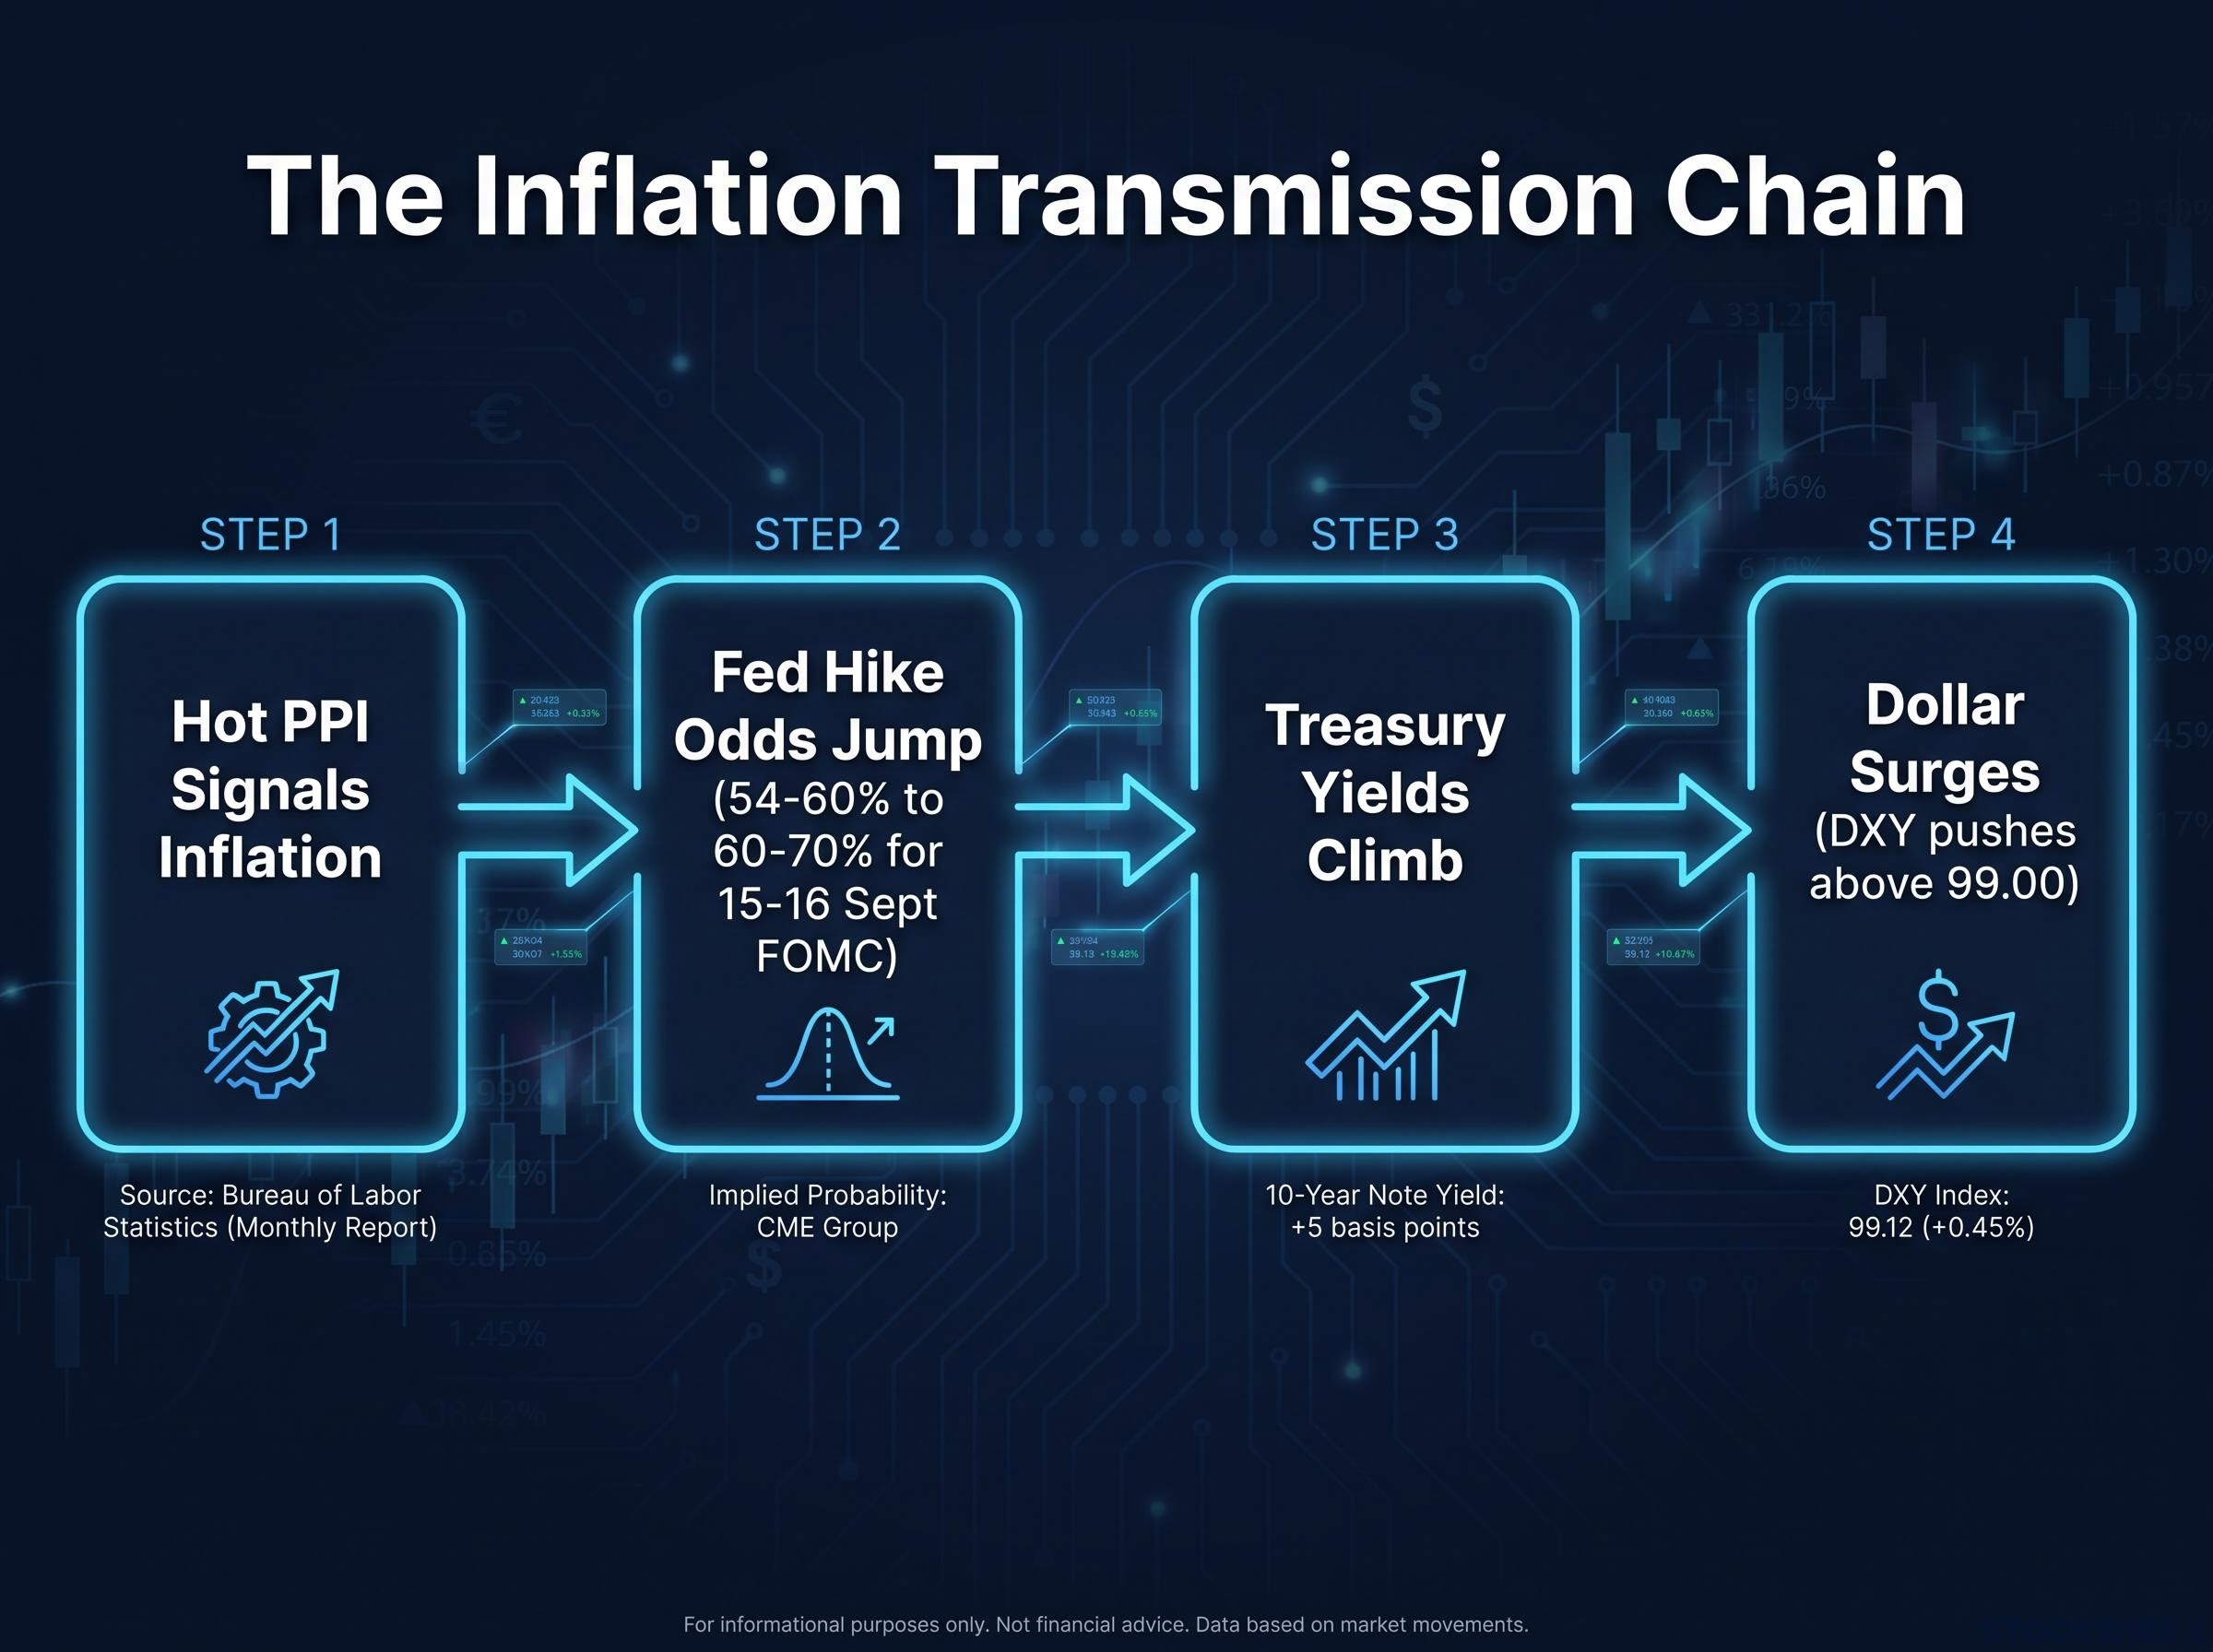
It works like this. Hot PPI signals that supply-side inflation is persisting. Persistent inflation delays expectations for Federal Reserve rate cuts, which pushes US Treasury yields higher. Higher yields make dollar-denominated assets more attractive relative to everything else, which bids up the dollar. Each step follows from the one before it.
The Fed expectations shift was immediate. Before the release, market indicators reflected roughly 54-60% odds of a rate hike at the 15-16 September FOMC meeting. After the print, CME FedWatch and Polymarket data showed the probability of a quarter-point (25 basis points) increase climbing to around 60-70%.
Fed rate pricing has shown a consistent pattern of violent single-session lurches on hot PPI prints: the April 2026 release moved cut odds from 42% to 4% in one session, a compression that mirrors the September repricing in magnitude if not direction.
The dollar responded in kind. The US Dollar Index reclaimed ground above 99.00, and the greenback posted its strongest daily gains where rate differentials mattered most.
| Currency Pair | Dollar Move (%) | Direction |
|---|---|---|
| AUD/USD | 0.85% | Dollar stronger |
| USD/JPY | 0.52% | Dollar stronger |
| GBP/USD | 0.27% | Dollar stronger |
| EUR/USD | 0.20% | Dollar stronger |
For context on how far this pattern can run, similar inflation shocks across 2025-2026 pushed the DXY toward 103.10 and lifted 10-year Treasury yields to 4.28%. The September move was the early stage of a well-worn sequence.
The gap between market pricing and economist consensus
Here is where the session gets interesting. While futures and prediction markets repriced aggressively, the professional forecasting community barely flinched.
A Reuters poll conducted between 4-9 September 2026 found that roughly 70% of the 93 economists surveyed still expected the federal funds rate to hold in the 3.50-3.75% range.
Reaction versus reality CME FedWatch pushed hike odds up by roughly 10 percentage points in minutes. The Reuters economist panel hardly moved. That gap is the difference between how markets trade and how policy is actually set.
Futures markets react faster and more violently to a single data point because their participants are paid to price surprises instantly. Economists wait for a body of evidence: labour market data, CPI confirmation, and multiple prints pointing the same way before they call a policy turn.
That divergence tells you something you can use. Markets punish surprises in real time, but a durable Fed pivot needs more than one number. Throughout June-August 2026, hike odds oscillated between 30-60%, which means the market was primed to lurch on any surprise, and it did. Knowing that transmission sequence means you do not need to wait for the commentary to understand what is happening to your currency-exposed holdings in the minutes after a release.
What rising yields actually do to gold and silver
Picture the choice a gold holder faces the moment yields jump. A Treasury bond now pays more, while the gold bar in the vault pays nothing at all. That gap in forgone income is the opportunity cost, and it rises every time yields climb.
Gold and silver pay no interest and are priced in dollars. So a hot PPI print hits them twice: rising yields make the income you give up by holding metal more expensive, and a stronger dollar makes the metal itself pricier for every foreign buyer. Both headwinds arrived at once.
The May 2026 session offered an earlier working example of yield and dollar pressure on gold acting simultaneously, with silver futures dropping more than 4% and platinum slipping below $1,973 as 10-year yields neared 4.60%, a precedent that maps closely onto the September mechanics.
The price action followed. Gold had been trading near the $2,680-$2,700 range with upside resistance around $2,720. After the PPI data, it slid toward roughly $2,650 per troy ounce, with choppy, indecisive moves as the market braced for Friday’s CPI. Silver took an even steeper intraday hit than gold, the more rate-sensitive of the two metals absorbing the sharper blow.
Yet the selling is only half the story. Two forces pull on bullion in opposite directions during an event like this:
- Headwinds (short-term): rising Treasury yields lift the opportunity cost of holding metal, and a stronger dollar raises the price for overseas buyers
- Tailwinds (long-term): persistent above-target inflation eventually strengthens the case for gold and silver as a store of value
A pattern repeating, not a new one In March 2026, a hot PPI print sent gold futures sliding below $5,000 and silver sharply lower. The September session ran the same script. Hot data, immediate metal selloff, then the question of whether it holds.
This is the read that matters for your position. The session’s selloff tells you that short-term macro traders dominate precious metals during data events, and they were selling the rate story, not the inflation hedge. It does not invalidate the long-run case for bullion as protection against persistent inflation.
Before reacting, work out which time horizon your position actually serves. If you hold metal as a rate-sensitivity trade, the signal to trim came fast. If you hold it as a multi-year inflation hedge, a single hot print is not the moment to sell. Confusing the two is how investors exit at exactly the wrong point in the cycle.
Bitcoin’s PPI problem: risk asset, not digital gold
Bitcoin dropped roughly $1,000 within minutes of the print, falling as much as 2.1% in early New York trading and touching a session low of $76,663.54. The move triggered more than $190 million in long liquidations as leveraged and algorithmic positions were forced out.
The mechanical violence of the repricing More than $190 million in long positions were liquidated in the move. That is not sentiment shifting. That is leverage being torn out of the market by force as the macro data turned.
If Bitcoin were behaving as digital gold, a safe haven, you would not expect it to crater on the same data that lifts the dollar. It cratered anyway, and that is the tell.
Bitcoin’s inflation hedge credentials received their most significant stress test in 2022, when the asset lost approximately 77% of its value during the highest inflation in four decades while gold held broadly stable, a divergence that the 2026 correlation data extends rather than reverses.
When Bitcoin and gold move together, and when they do not
The reason sits in the correlation data, which shows a structural shift rather than a one-day coincidence.
| Time Period | Bitcoin-Gold Correlation | Bitcoin-S&P 500 Correlation |
|---|---|---|
| Late 2025 | +0.29 | Rising |
| Early 2026 | As low as -0.88 | As high as +0.86 |
| 1-year rolling | Around -0.17 | Strongly positive |
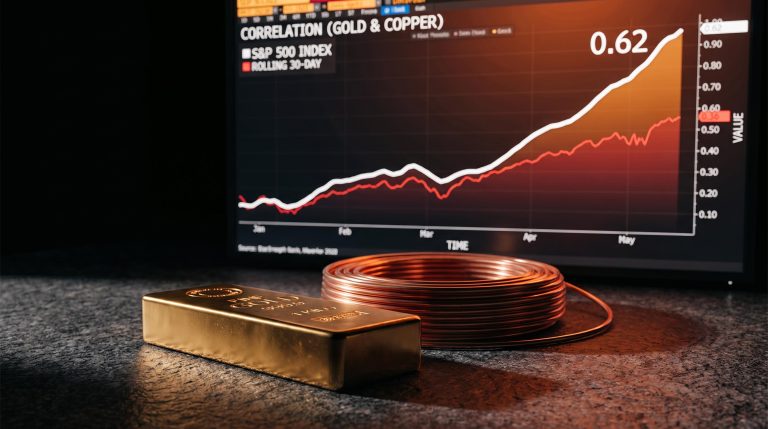
Bitcoin’s relationship with gold swung from mildly positive in late 2025 to deeply negative by early 2026, while its tie to the S&P 500 climbed toward +0.86. Through 2025 and 2026, Bitcoin traded less like a hard-asset hedge and more like a high-beta institutional risk asset, moving with tech-equity sentiment and liquidity conditions.
The capital flows confirm it. Gold ETFs absorbed 801 tonnes in 2025 as pure safe-haven demand, while Bitcoin ETFs saw around $6 billion in outflows. Institutional investors treated the two as fundamentally different instruments when the market turned risk-off, buying gold and selling Bitcoin alongside equities.
Positive Bitcoin-gold correlation does return at times, but it is driven by shared macro narratives such as geopolitical risk or fiat debasement fear, not by an identical investor base. An earlier stretch saw both rally together, and the relationship is regime-dependent, not fixed. The current negative correlation is not permanent, but neither is it evidence that the digital gold thesis has been vindicated.
For anyone holding Bitcoin as a portfolio hedge, this is a direct challenge. The liquidation cascade shows that a broadened institutional ownership base has made Bitcoin more exposed to macro data events, not less. This was Bitcoin’s fourth consecutive losing session at the time of publication, and a position sized for a safe-haven asset will behave nothing like one when the market treats it as a leveraged growth proxy. Your portfolio construction should reflect the asset it actually is right now.
What the September 10 session tells you about the next inflation print
Pull the four links together and a repeatable playbook emerges. A PPI surprise lands, futures reprice the Fed path, yields and the dollar surge, and non-yielding or high-beta assets sell off. Each link was visible in real-time data on 10 September.
| Asset Class | Immediate Reaction | Mechanism | Key Variable |
|---|---|---|---|
| US Dollar | DXY above 99.00 | Higher yields lift dollar demand | Rate-cut timing |
| Gold | Toward $2,650 | Rising opportunity cost | Time horizon of holder |
| Silver | Steeper drop than gold | Rate sensitivity plus stronger dollar | CPI confirmation |
| Bitcoin | To $76,663.54 low | High-beta risk-off selling | Equity correlation |
This session was not new. It sat inside a run of precedents that traced the same chain earlier in the year:
- March 2026: hot PPI sent gold futures below $5,000 and silver sharply lower
- July 2026: a hotter July PPI report saw Bitcoin fall more than 3%, below $119,000
- 2025 episode: strong PPI pushed the DXY to 103.10, 10-year yields to 4.28%, and gold below $3,340
The pattern tells you where your next decision point actually sits. It is not today’s PPI reaction. It is Friday’s CPI print, expected near 2.4% on 11 September. If CPI confirms the PPI signal, the repricing deepens, and anyone holding non-yielding assets should have a plan before that number lands.
A single PPI print rarely resolves the macro debate. What it does is set the priors for every release that follows, which is a framework for managing your positions rather than a reason to react impulsively to one session.
This article is for informational purposes only and should not be considered financial advice. Investors should conduct their own research and consult with financial professionals before making investment decisions.
Past performance does not guarantee future results. Financial projections are subject to market conditions and various risk factors. Some figures cited are noted as unverified in the underlying research and should be treated with appropriate caution.