
Two exchange-traded funds built on selling call options, JEPI and JEPQ, have together pulled in more net investor cash since 2021 than the two largest legacy dividend funds combined, and by a margin that is hard to dismiss as noise.
That demand signal did not go unnoticed on Wall Street. Goldman Sachs has now committed more than $4 billion in acquisitions to buy its way into the same category retail investors have been chasing, a category that has grown from a niche derivatives product into one of the fastest-expanding corners of a $9 trillion industry. When a firm with Goldman’s resources pays a premium to own what individuals are already buying, the demand shift has crossed from trend into structural fact.
This piece maps the capital flow data, dissects Goldman’s strategic logic, and lays out the structural trade-offs every investor should weigh before treating a high headline yield as the whole story. By the end, you will know what the institutional land grab signals about where demand is heading, and what the critics argue the inflow numbers quietly obscure.
The numbers that Wall Street could not ignore
Start with the flow data, because the flow data is what asset managers saw first.
Since its 2021 launch, the JPMorgan Equity Premium Income ETF (JEPI) has gathered more than $45 billion in net inflows and now holds roughly $46 billion in assets. Its Nasdaq-focused sibling, the JPMorgan Nasdaq Equity Premium Income ETF (JEPQ), has pulled in close to $38 billion since mid-2022 and sits at approximately $42 billion in assets as of early September 2026.
Set those figures against the legacy dividend funds, and the divergence becomes the whole point.
| Fund | Net Inflows Since 2021 | Current AUM (Sept 2026) |
|---|---|---|
| SCHD | ~$68 billion | ~$111 billion |
| JEPI | ~$45 billion | ~$46 billion |
| JEPQ | ~$38 billion (from mid-2022) | ~$42 billion |
| VIG | ~$15 billion | Traditional dividend benchmark |
| VYM | Under $12 billion (from mid-2022) | Long-established high-dividend fund |
JEPI and JEPQ have together attracted more than $83 billion in net inflows. VIG and VYM combined have taken in under $27 billion over comparable windows. That is roughly a three-to-one gap in favour of the options-income products.
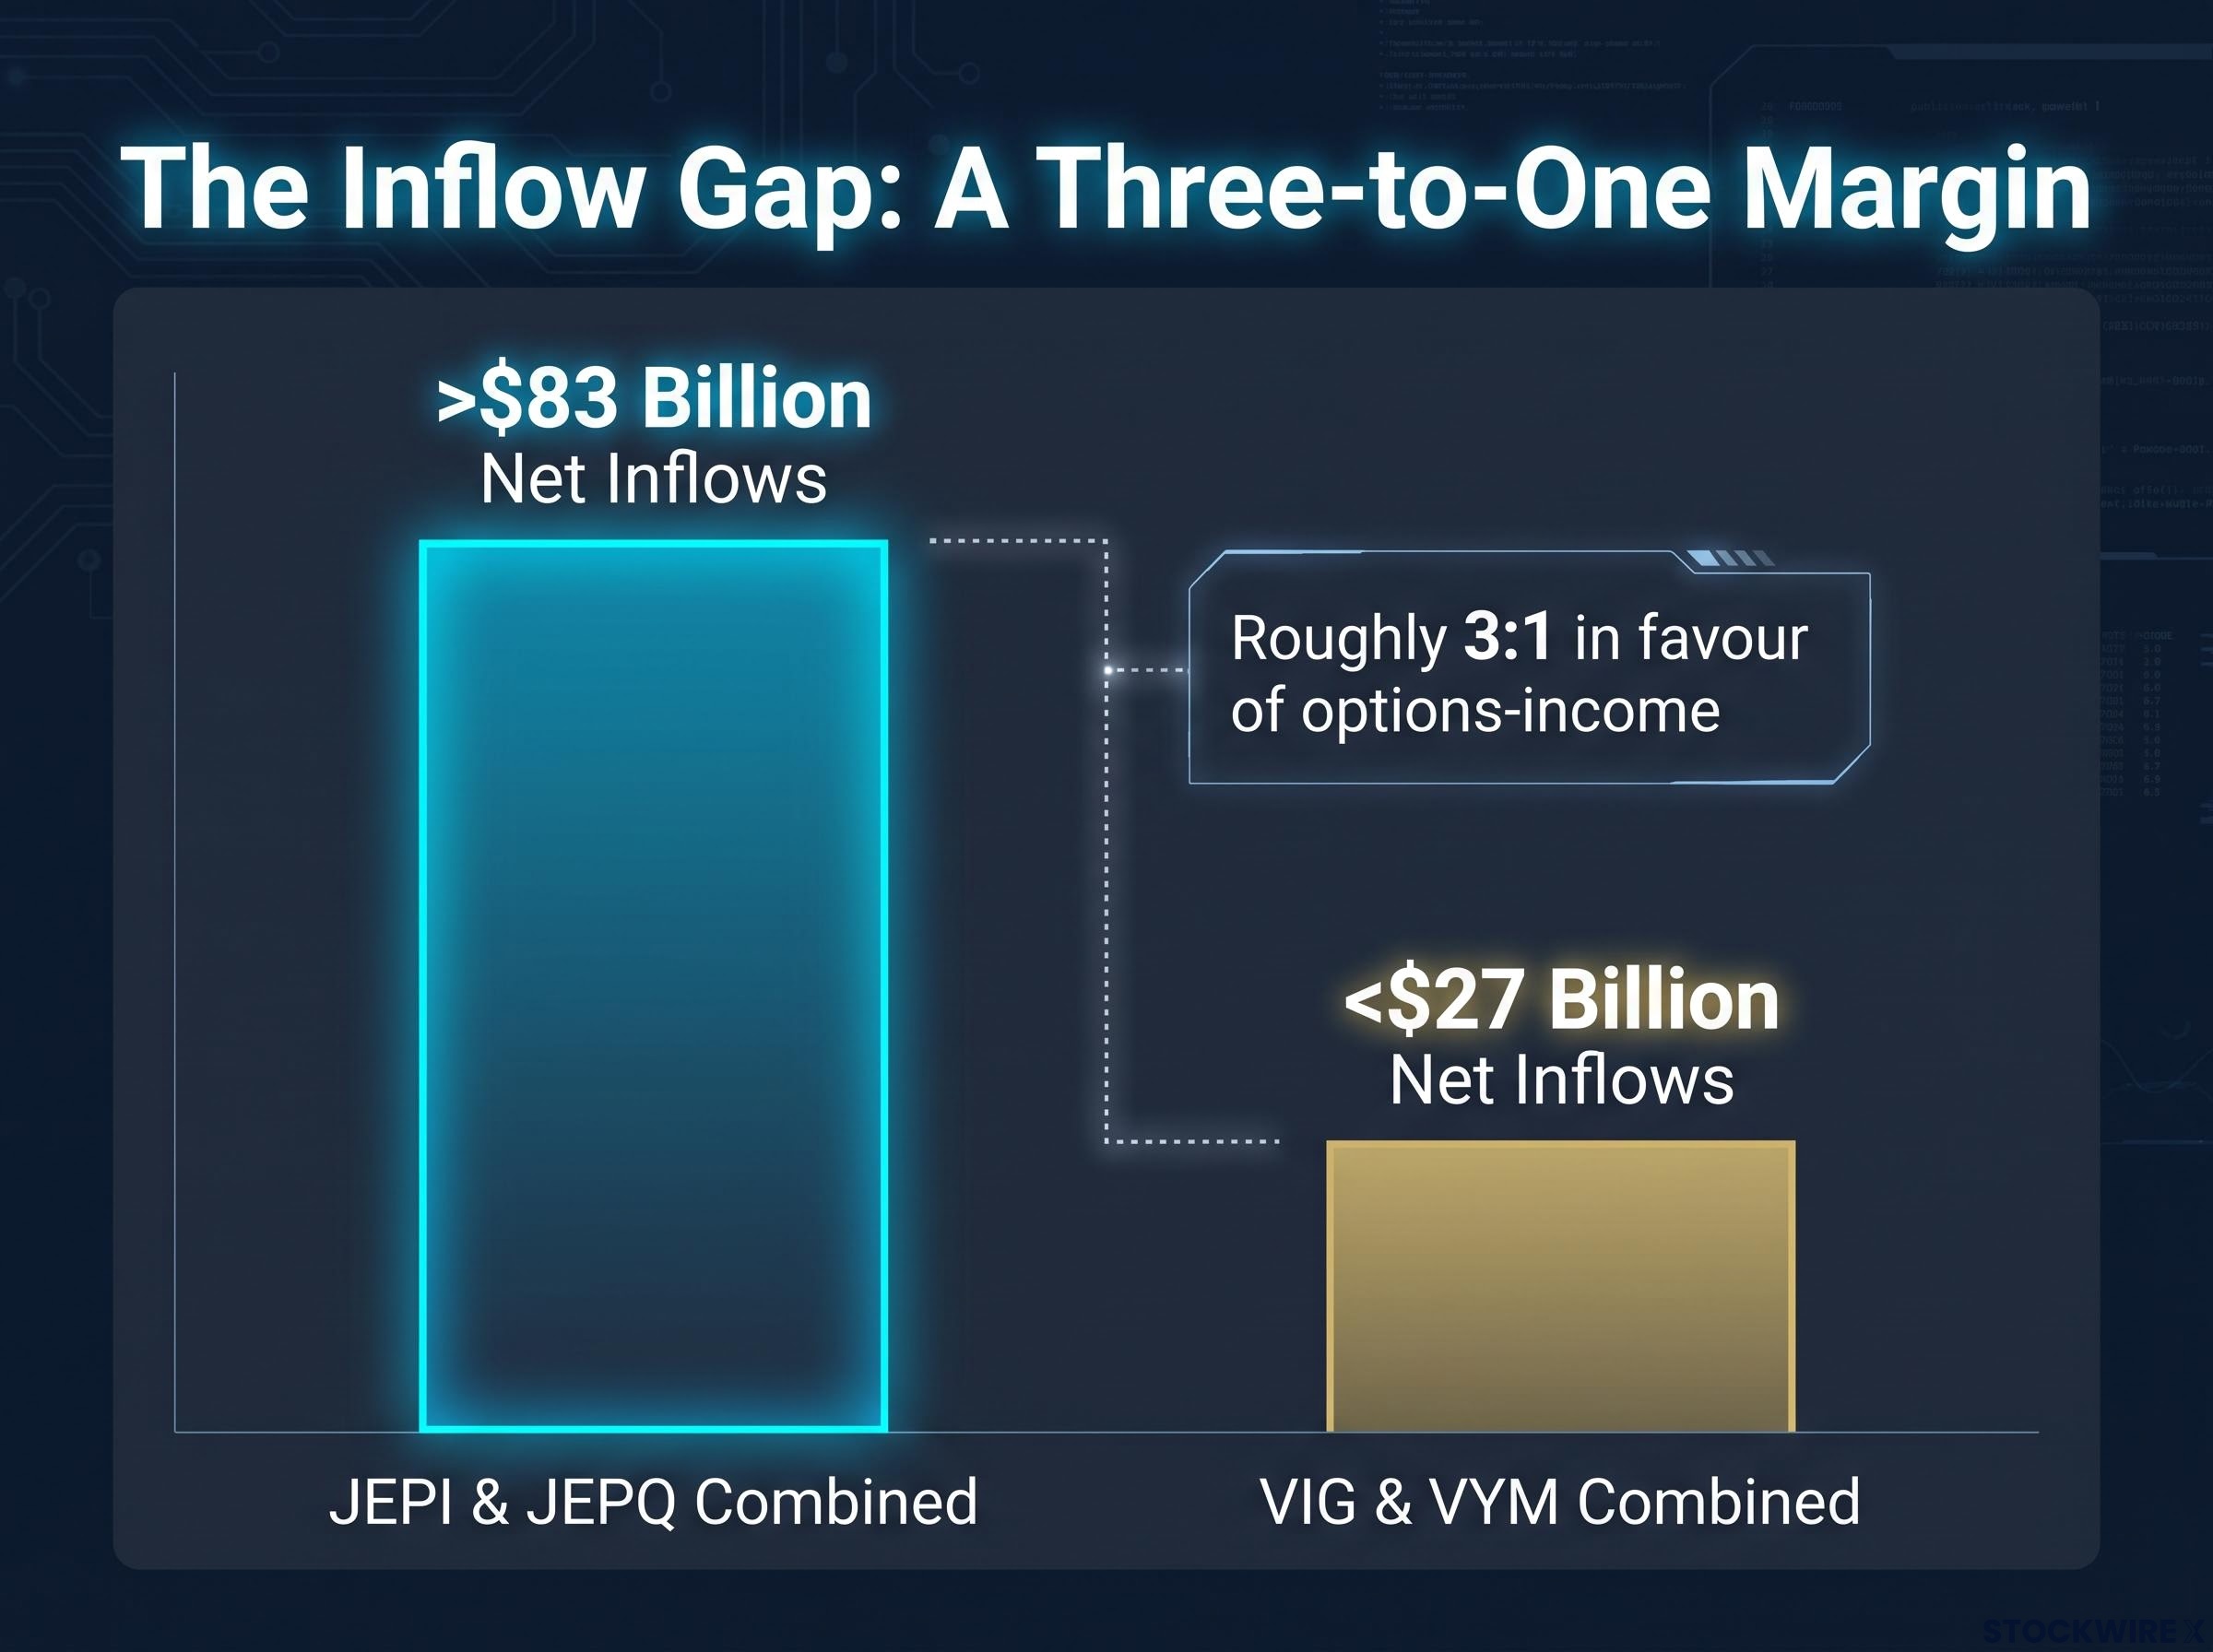
That gap is not a statistical curiosity. It tells you a meaningful cohort of investors has already made a deliberate choice, prioritising monthly cash distributions over the long-term total return that dividend-growth funds are built to deliver.
The supply side has responded exactly as you would expect. There are now more than 5,000 ETFs listed on U.S. markets, exceeding the number of publicly traded companies, and according to research by Robert Yanovitz of Nasdaq, roughly 25% of the approximately 1,000 new ETFs launched in 2025 were options-based or options-focused.
Read together, the flows and the launches say the same thing. A durable pool of demand appeared, and the industry moved to meet it. Goldman’s cheque-writing is the logical next chapter, not a departure from the plot.
When big ASX news breaks, our subscribers know first
What covered call ETFs actually do, and why that matters to income-hungry investors
The mechanics are simpler than the acronyms suggest.
A covered-call ETF holds a portfolio of stocks, then sells call options against those holdings. A call option gives the buyer the right to purchase a stock at a set price by a set date. In exchange for selling that right, the fund collects a premium in cash, which it then passes to investors, usually every month. The trade-off is fixed: the fund keeps most of the downside risk but caps how much upside it can capture, because if the stock rises past the option’s strike price, those gains go to the option buyer.
The upside cap mechanics are where covered-call funds diverge most sharply from their benchmarks: the Cboe S&P 500 BuyWrite Index captured approximately 64% of the S&P 500’s upside but absorbed around 70% of its downside over ten years, a compounding asymmetry that widens quietly across full market cycles.
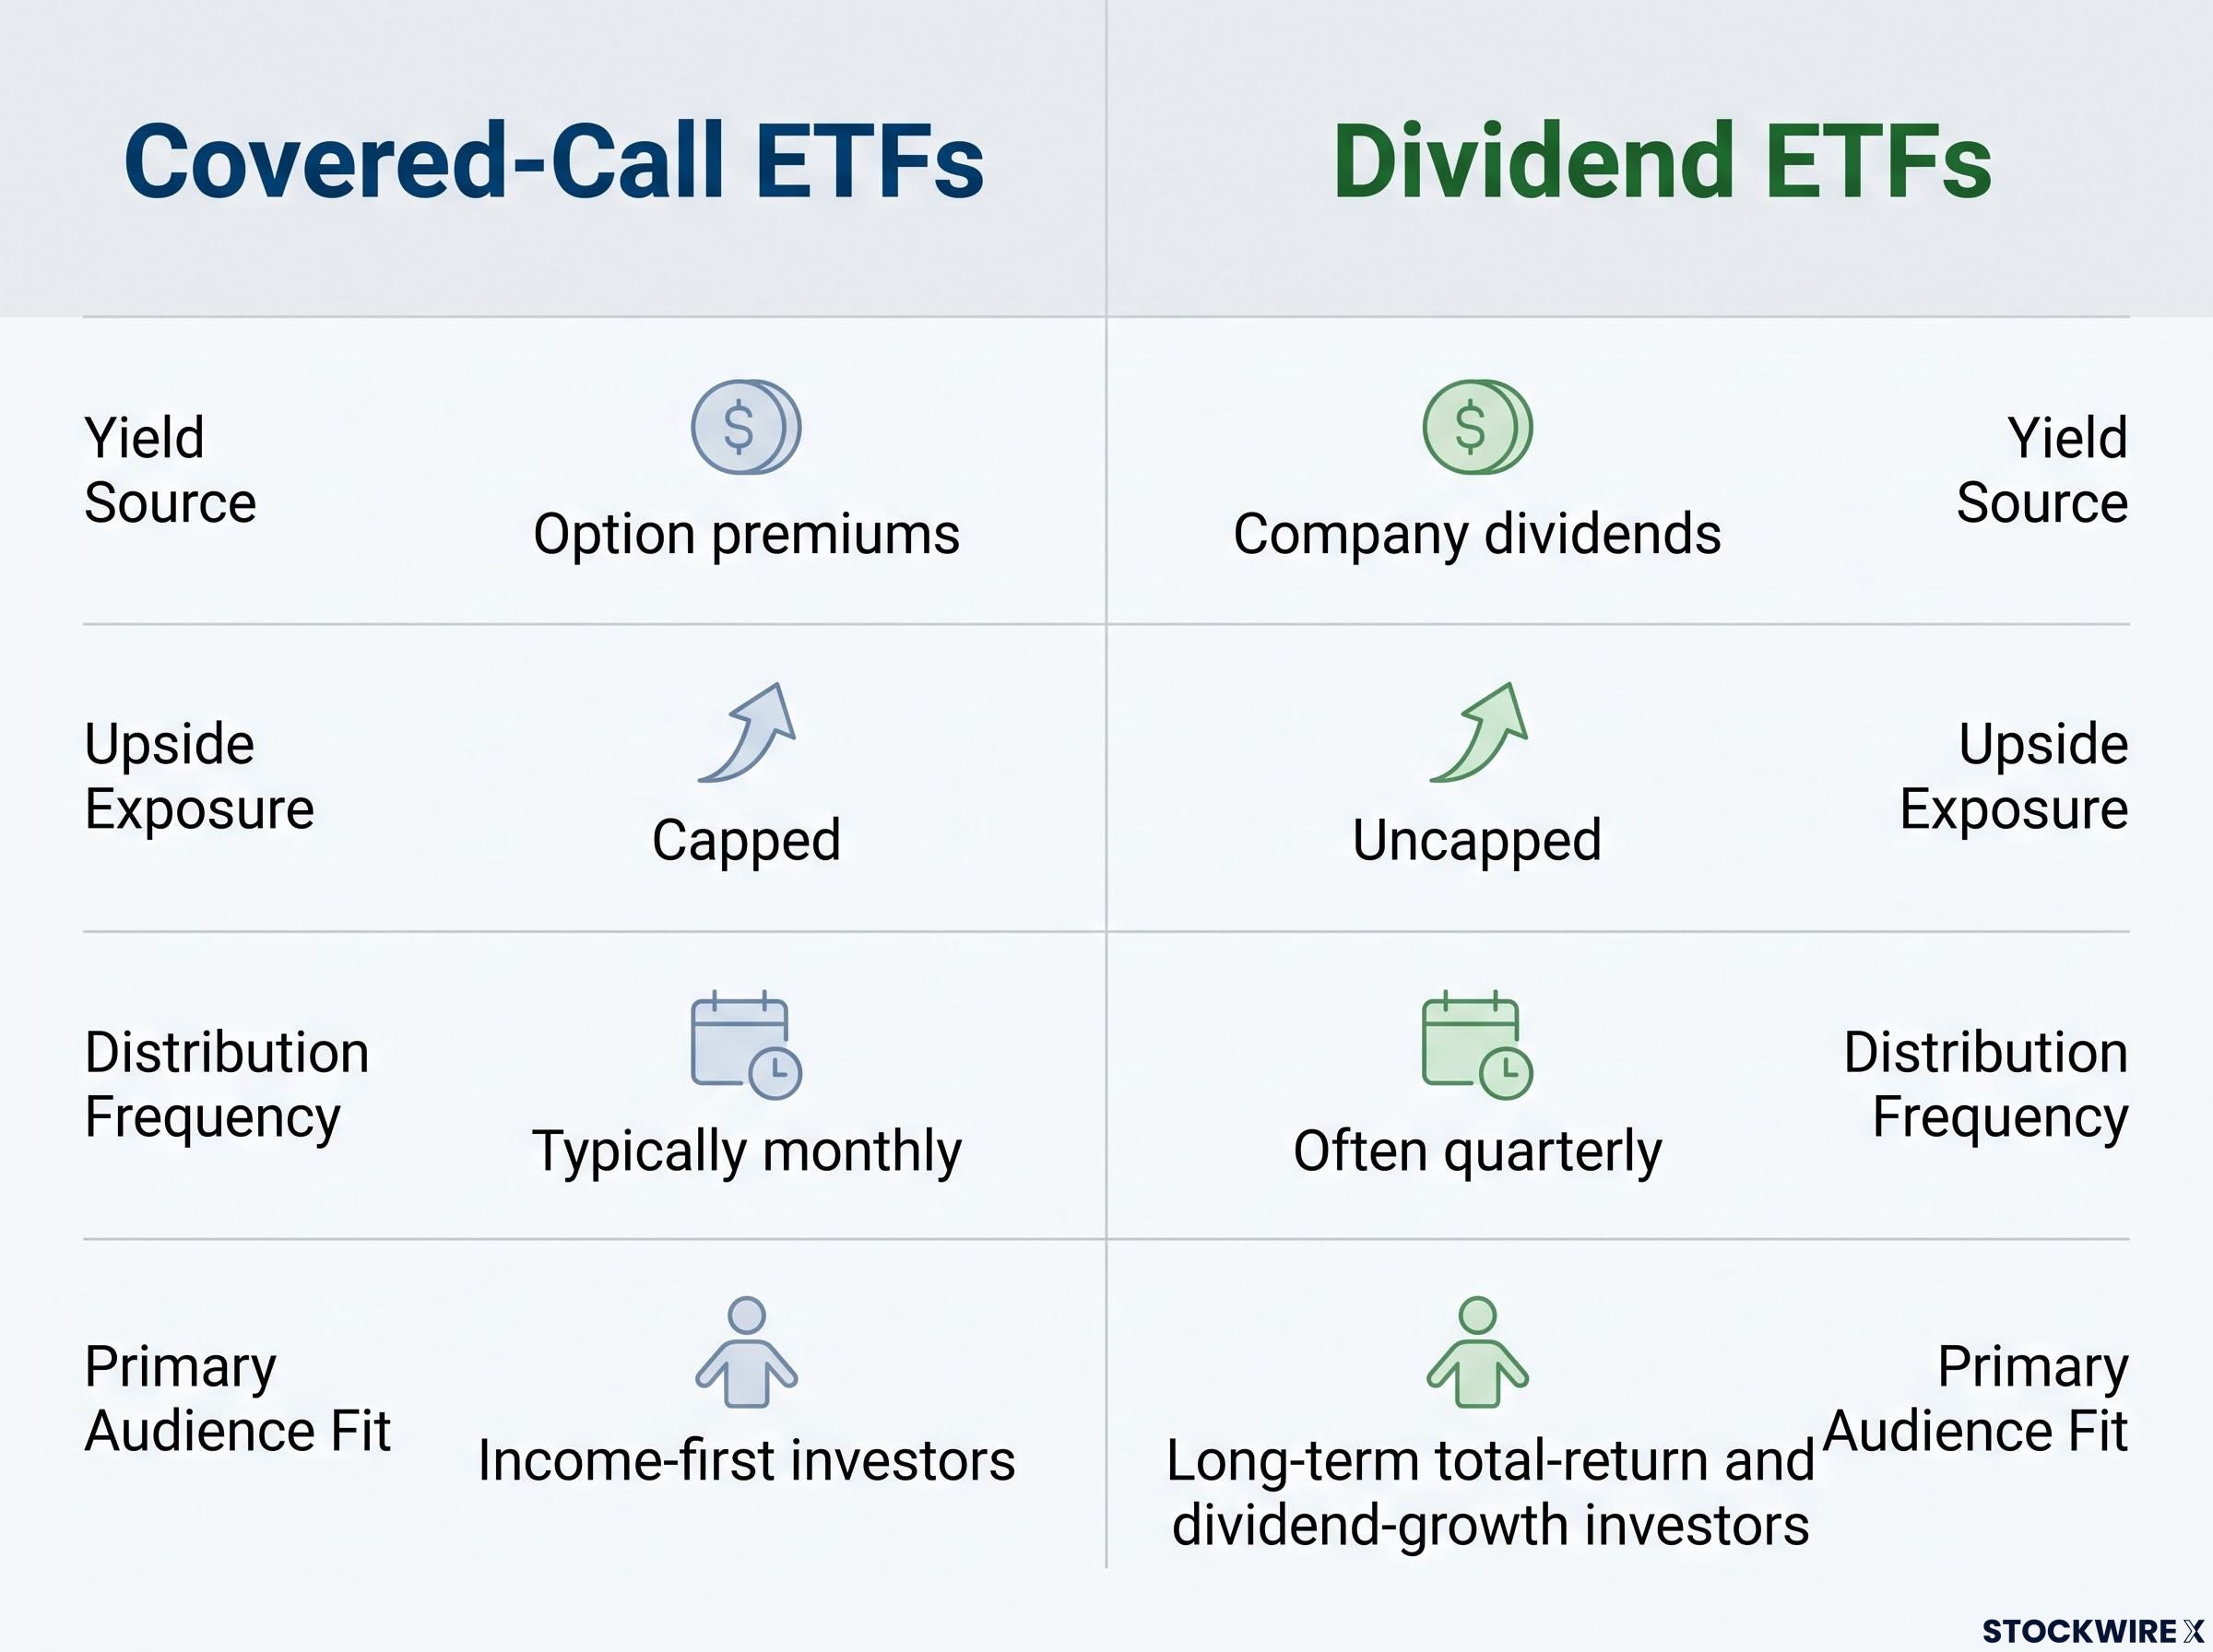
Here is how that structure compares with a traditional dividend fund:
- Yield source: Covered-call ETFs earn income from option premiums; dividend ETFs earn it from company dividends.
- Upside exposure: Covered-call ETFs cap it; dividend ETFs leave it uncapped.
- Distribution frequency: Covered-call ETFs typically pay monthly; dividend ETFs often pay quarterly.
- Primary audience fit: Covered-call ETFs suit income-first investors; dividend ETFs suit long-term total-return and dividend-growth investors.
Morningstar’s Elizabeth Armour describes the natural audience as pre-retirees and retirees seeking income and smoother returns, investors who value predictable cash flow and lower volatility over maximising capital appreciation. In practice, that means people in their 50s and 60s who want a portfolio that behaves like a paycheck rather than a growth engine.
The post-pandemic backdrop sharpened the appeal. Elevated volatility and a rate environment that left conventional fixed income insufficient for many savers made an equity-plus-income compromise attractive: stay invested in stocks, harvest option premium, and sit somewhere between the risk of pure equity and the yield of bonds.
Why the behavioural pull of monthly distributions is a product feature, not a side effect
The financial case is only half the story. The other half is psychological.
Regular, predictable cash payouts create a comfort that investors often treat as “income” even when those payments simply re-package total return. Morningstar’s Daniel Sotiroff put it plainly in a 2025 podcast: funds like JEPI appeal to investors who “crave distributions.” That craving is the product feature.
Research summarised by the Rational Reminder podcast frames this as a “Devil’s Bargain”: investors may knowingly, or unknowingly, trade long-term growth for the near-term comfort of a steady payout. The design of these funds makes that trade frictionless, which is precisely why understanding the distinction matters. If you know the monthly cheque is partly your own capital coming back to you, you can judge for yourself whether the emotional satisfaction is worth the structural cost.
Goldman’s $4 billion bet and what it reveals about institutional conviction
Goldman did not enter this market quietly. It bought its way in, twice.
On 1 December 2025, Goldman Sachs announced the acquisition of Innovator Capital Management, a pioneer in defined-outcome and buffer ETFs, for roughly $2.0 billion. The deal closed on 2 April 2026, adding approximately $31 billion in assets under supervision across 171 defined-outcome ETFs and lifting Goldman’s global ETF count to around 240. Then, on 12 August 2026, Goldman agreed to acquire NEOS Investments, a specialist in options-income ETFs, for up to $2.25 billion, with closing expected in Q1 2027.
| Acquisition | Consideration | AUM/AUS at Deal | ETF Count | Expected Close |
|---|---|---|---|---|
| Innovator Capital | ~$2.0 billion | ~$31 billion AUS | 171 | Closed April 2026 |
| NEOS Investments | Up to $2.25 billion | ~$30-32 billion AUM | ~19 | Q1 2027 |
Taken separately, each looks opportunistic. Taken together, they read as deliberate platform-building. Goldman CEO David Solomon framed the goal as giving investors a “diverse toolkit for different market environments” across buffer, managed-outcome, and income strategies. Reuters estimates the NEOS deal pushes Goldman’s active ETF assets to around $80 billion, with a total ETF platform near $130 billion.
The analyst layer explains why Goldman would pay these prices. These products generate higher-margin active fees than low-cost index funds, and the assets tend to stay put.
Reuters Breakingviews describes the NEOS deal as part of Goldman’s effort to build steadier asset-management fees, paying up for options-income capabilities to complement its more cyclical investment-banking revenues.
Goldman’s broader market positioning provides context for why the firm is simultaneously bullish on equities over a 12-month horizon and acquiring options-income capabilities: the Risk Appetite Indicator above 1.1 signals elevated near-term positioning, precisely the environment where income-smoothing products absorb retail demand that would otherwise chase momentum.
Bloomberg framed the twin purchases as a “new front in Wall Street’s ETF battle,” where large firms buy specialist issuers that have grown beyond the reach of low-fee index giants. The signal for you sits in the choice to buy rather than build. Goldman concluded that the window for organic product development in this space had narrowed, and that first-mover specialists had accumulated advantages worth paying a premium to own.
That is the read worth holding onto. Goldman committing more than $4 billion across two options-ETF firms tells you institutional capital has judged this category to be a structurally durable demand cohort, not a passing yield chase. Whether that conviction should shape your own allocation is a separate question, and it depends on what the inflow data leaves out.
The structural trade-offs that the inflow data does not show
Here is where the critics earn a hearing, because their case is specific and it is serious.
The most important critique is structural and mathematical. Covered-call strategies capture most of the downside while surrendering the upside, which means long-term total return systematically lags broad equity indexes even when the distribution yield looks generous. A 2026 Yahoo Finance analysis noted that many funds capture nearly all of the downside but only a fraction of the upside, an asymmetry that can quietly shrink a portfolio until it can no longer sustain the same dollar income, even if the percentage yield holds steady.
The four structural trade-offs, in order of how much they matter:
- Asymmetric payoff. The fund keeps most losses but caps gains, so total return trails the underlying index over long horizons. Robert Huebscher, in an essay titled “Covered-Call ETFs are Weapons of Wealth Destruction,” argues the surrendered upside is not fully compensated by option income, especially after costs.
- Tax inefficiency. Option-premium distributions are often taxed as ordinary income rather than at the lower qualified-dividend rate, making these funds materially less efficient for taxable investors than the headline yield implies. Schwab’s own comparison notes dividend ETFs are more likely to produce qualified dividend income.
- Fee drag. Covered-call ETFs carry management expense ratios several times higher than plain-vanilla index funds, plus elevated trading costs from constant option writing. Mackenzie Investments flags both as structural headwinds to competitive returns.
- NAV decay and return of capital. Some funds pay investors back their own principal to hit distribution targets, eroding the asset base over time and making an apparently stable yield misleading.
Fund structure and tax treatment interact in ways the headline yield obscures: ELN-based funds like JEPI generate predominantly ordinary income taxed immediately, while FLEX options structures can classify distributions as return of capital, deferring taxation until sale, a distinction that can shift after-tax returns by more than the headline yield difference between competing funds.
Matching the product to the investor, not the yield to the need
The trade-offs are not an argument against these funds existing. They are an argument about who should own them.
For an income-dependent retiree with a short time horizon and a genuine need for monthly cash flow, the trade is defensible. That investor is deliberately exchanging long-term growth for present income, and the capped upside costs them less because their horizon is short.
For an accumulation-phase investor, the maths runs the other way. Daniel Sotiroff of Morningstar is explicit that covered-call ETFs are not ideal vehicles for investors still building wealth, and Morningstar’s Lan Anh Tran warns that many buyers are “lured by double-digit yields,” treating a high payout as a proxy for low risk. That is the mismatch to be honest with yourself about. The investors most drawn to these products are frequently the ones least able to afford what they give up.
What the institutional land grab means for the category’s next chapter
Pull the four threads together, and a competitive picture emerges that will decide how this story unfolds.
Goldman is buying scale where JPMorgan built it organically through JEPI and JEPQ. Around them, Global X, Roundhill, YieldMax, and NEOS (now Goldman) have flooded the product shelf, part of the roughly 25% of 2025’s new ETF launches that were options-focused. Combined, Goldman’s options-related ETF assets after the NEOS close reach an estimated $61-63 billion. The structural implication is consolidation: smaller issuers face mounting distribution pressure as a handful of large platforms absorb the category.
The variables worth watching:
- Option premium sustainability: whether the premium levels that fund these distributions hold up through changing volatility regimes.
- Investor behaviour through an extended rally: how covered-call holders react during a prolonged bull market that caps their gains against a soaring index.
- Vanguard’s stance: the firm has not yet entered the covered-call space meaningfully, and some read its absence as a comment on the category’s long-term legitimacy.
- Consolidation among smaller issuers: whether independents specialise, differentiate, or sell to larger platforms.
One characteristic tilts the odds toward durability. Industry observers note that assets in covered-call products tend to be sticky, with investors rarely exiting once invested, which sustains issuer fee revenue even through underperformance cycles.
That stickiness is exactly where your interests and the issuer’s diverge. Asset managers earn on assets under management regardless of whether the product maximises investor outcomes, so institutional appetite tells you about fee economics and demographic demand, not about whether the fund is right for you. Before allocating, the information you need is not Goldman’s conviction. It is your own time horizon, your tax situation, and your tolerance for capped upside.
Reading Goldman’s move as a market signal, not a product endorsement
The tension at the centre of this story does not resolve cleanly, and it should not.
On one side sits institutional conviction: Goldman paying more than $4 billion to own options-income and defined-outcome capabilities, a market-based vote of confidence in the category’s staying power. On the other sits the structural critique from Morningstar, from Huebscher, and from the Rational Reminder “Devil’s Bargain” framing: asymmetric payoff, tax drag, fee burden, and NAV erosion that a headline yield hides.
Both things are true at once. The category can be durable and the products can still be wrong for a given investor, because institutional conviction and investor suitability are two different questions.
Goldman’s spend is a signal about fee economics and demographic demand. The stickiness of covered-call AUM confirms the fee logic, but stickiness benefits the issuer, not necessarily the holder. The question to carry into any covered-call ETF headline or marketing sheet you encounter is a single one: does your income need justify the structural cost, given your time horizon, your tax position, and your tolerance for capped upside?
For investors who have decided the income case applies to their situation, our dedicated guide to covered call ETF selection covers the specific metrics to screen — including organic income ratio thresholds and distribution streak requirements — that separate defensible income positions from funds quietly returning principal as yield.
This article is for informational purposes only and should not be considered financial advice. Investors should conduct their own research and consult with financial professionals before making investment decisions. Past performance does not guarantee future results, and financial projections are subject to market conditions and various risk factors.