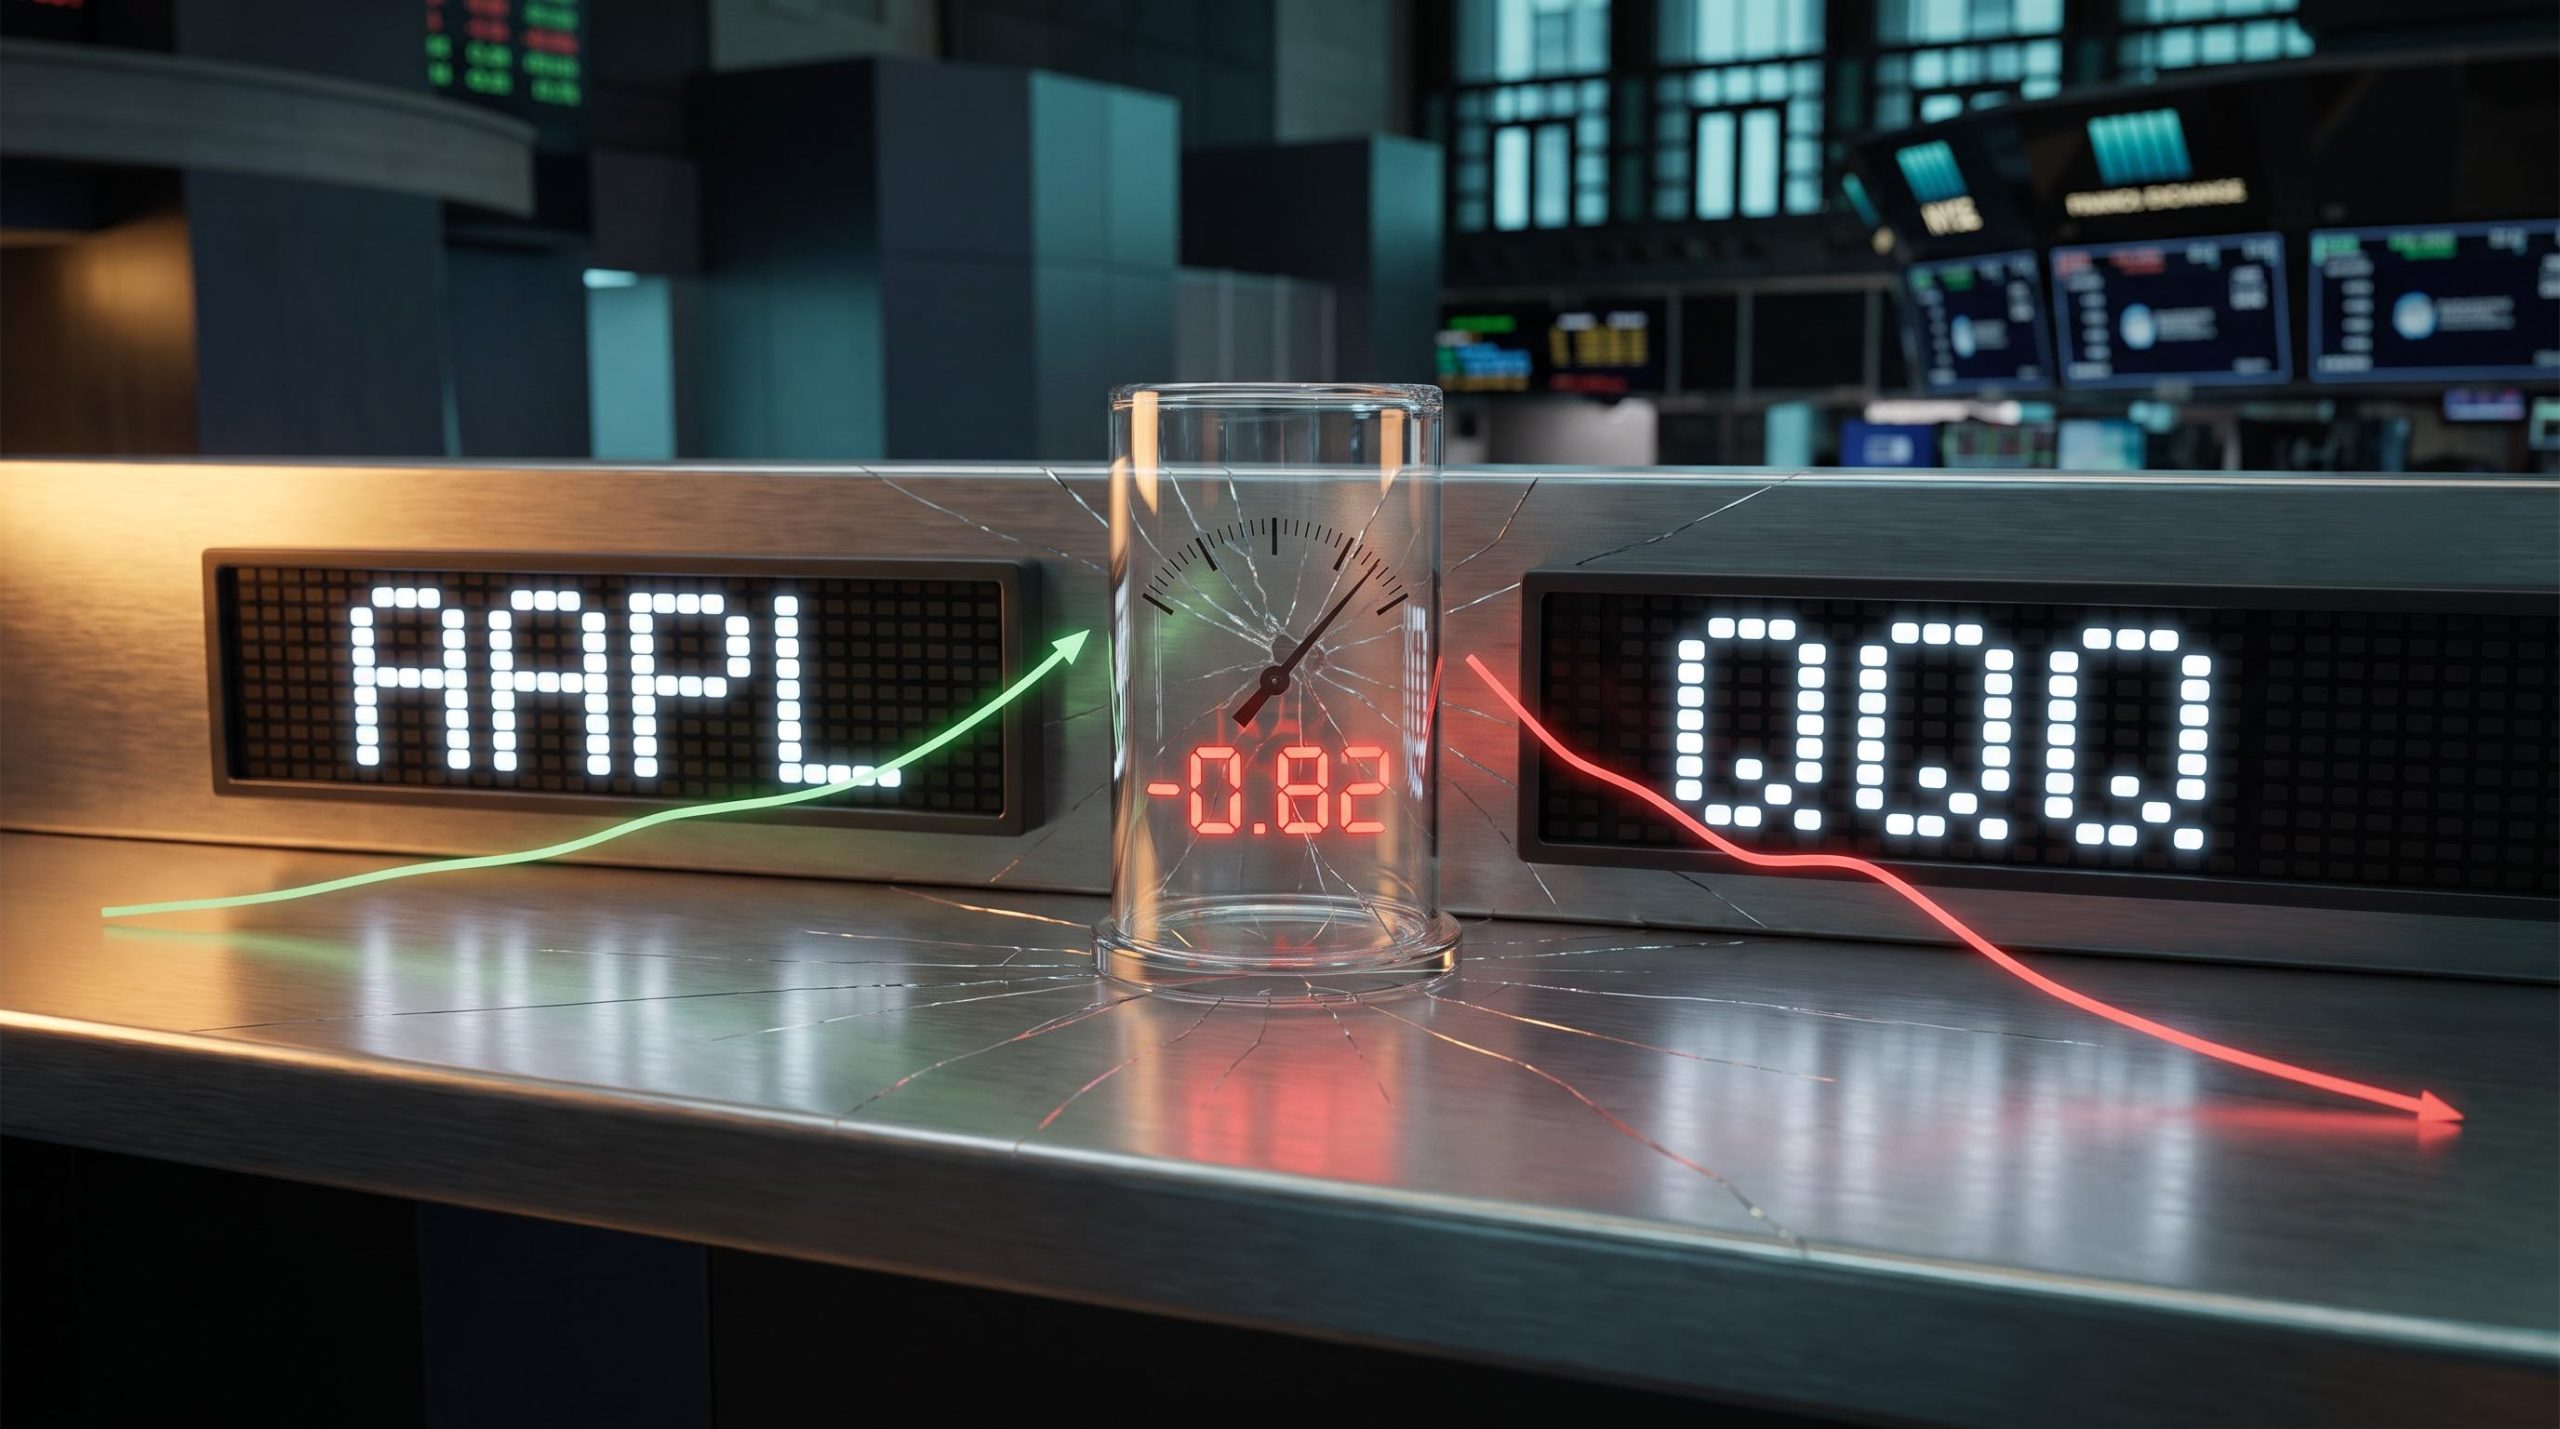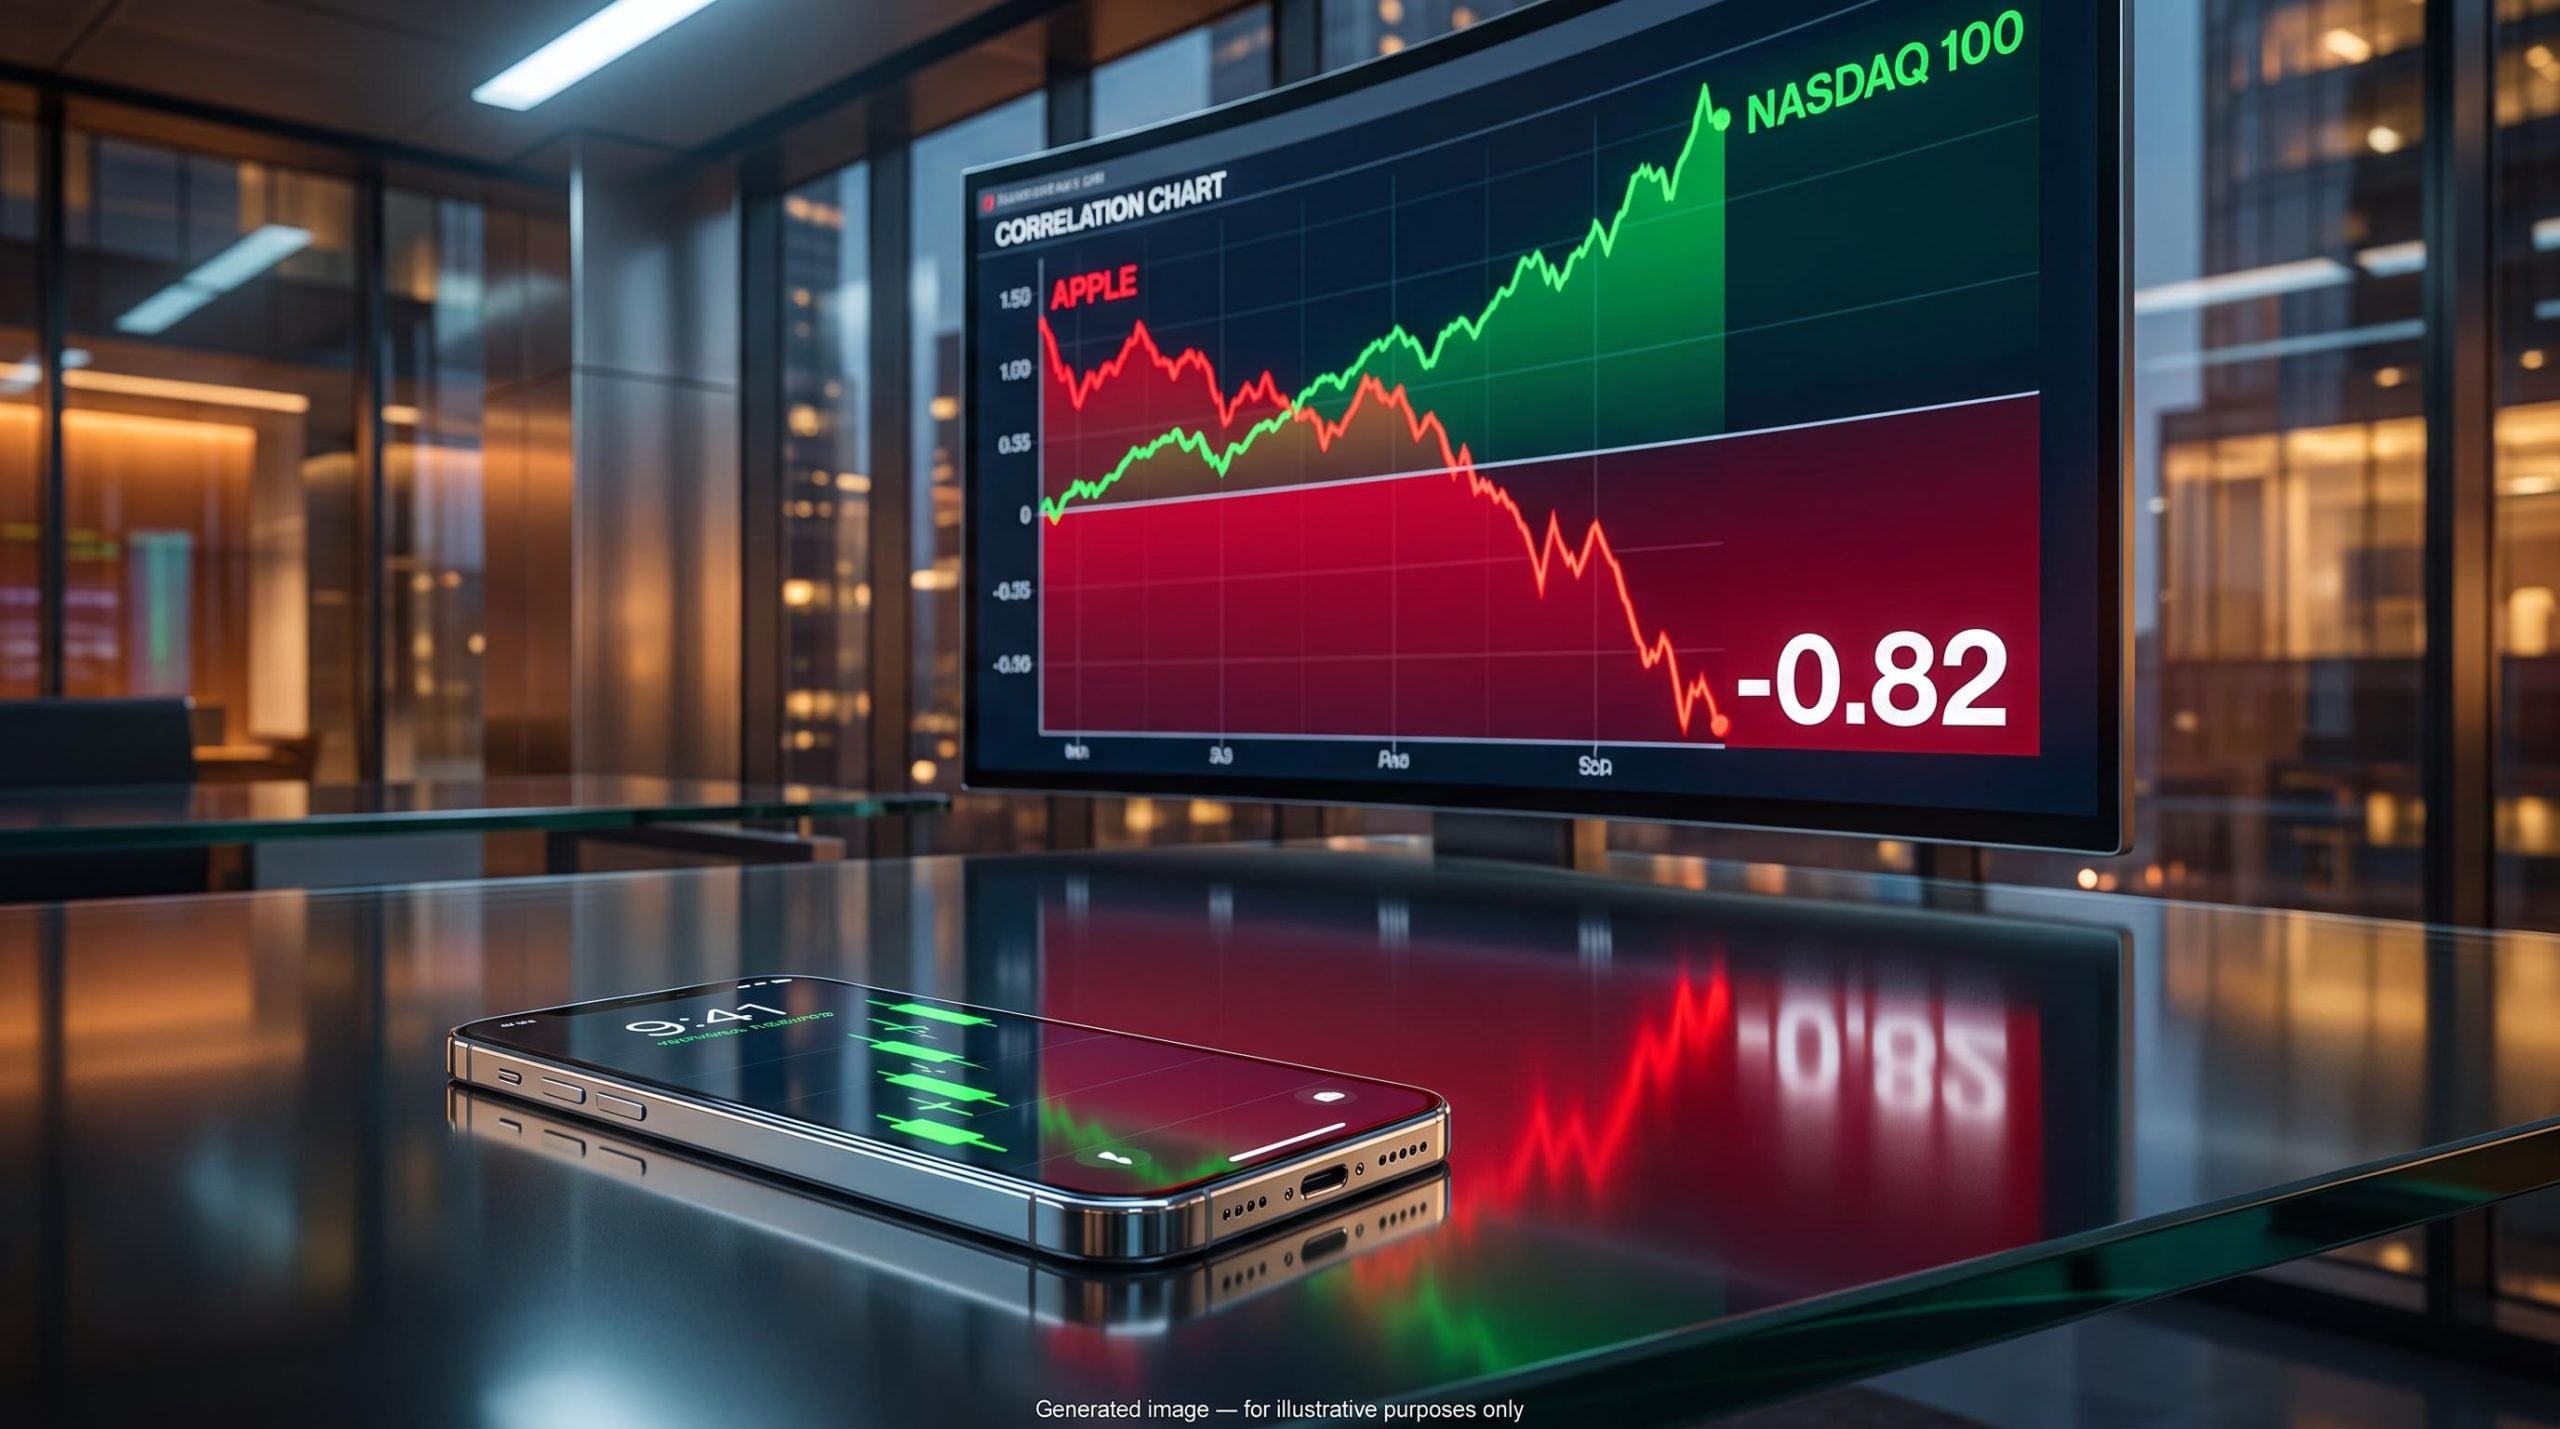
Apple, one of the two heaviest components of the NASDAQ 100, is currently moving in the opposite direction from the index it anchors. Its 30-day price correlation with the benchmark sits at -0.82.
Read that again. A stock that accounts for roughly 7% of QQQ, the exchange-traded fund that tracks the NASDAQ 100, has become that index’s mirror image.
Most investors have quietly assumed Apple and the NASDAQ 100 move together. That assumption has just been empirically broken, and the break has clear precedent only four times before in the last 35 years.
This piece unpacks what that statistical rupture actually reveals about how Apple is being priced right now, what it means for portfolios built on the assumption that mega-cap tech moves as a bloc, and whether the decoupling is a signal worth acting on or a short-term artifact worth ignoring.
A statistical rupture 21 years in the making
The numbers are worth walking through slowly, because their strangeness accumulates. According to CNBC and Yahoo Finance, citing ThinkOrSwim data, Apple’s 30-day price correlation with the NASDAQ 100 fell to a low of -0.86, before settling at -0.82 at the time of reporting in early September 2026.
The anchor figure Apple’s 30-day price correlation with the NASDAQ 100 reached -0.86 on 24 August 2026, a level not seen since around 2005.
To put the scale in context, here are the five figures that define the divergence:
The NASDAQ 100 as a benchmark has itself been shifting in character, with roughly 82% of its options open interest sitting in contracts expiring within five days, meaning short-dated hedging flows routinely amplify intraday price swings that long-term investors can misread as fundamental signals.
- 30-day price correlation trough of -0.86 on 24 August 2026
- 30-day price correlation of -0.82 at the time of reporting
- 30-day return correlation of approximately -0.15, close to zero
- Long-term typical correlation range of 0.5 to nearly 1.0 since 1990
- Only five occurrences of this level of negativity since 1990
That last figure is the one to sit with. A correlation of -1.0 means two assets move in perfectly opposite directions; a correlation of +1.0 means they move in lockstep. Apple and the NASDAQ 100 have lived in the positive half of that scale for most of 35 years. The current reading is a genuine outlier, not a routine wobble. On the day the original analysis aired, Apple could be watched rising in real time while the index it helps constitute slid lower.
Price correlation versus return correlation: why the distinction matters
There are two different correlations in play here, and the gap between them changes how you should read the whole picture. Price correlation tracks whether Apple’s daily price and the NASDAQ 100’s daily price move in the same direction on any given day. Return correlation tracks whether the two produce similar cumulative gains over the full 30-day window.
The price correlation is deeply negative at -0.82. The return correlation is only about -0.15, barely below zero.
Here is what that spread means for you as an investor. Apple can zigzag upward on individual days while the NASDAQ 100 zigzags downward, yet both can still finish a 30-day stretch with roughly comparable total gains. The divergence is dramatic in the daily price path and far milder in period-level performance. That matters because it tells you the decoupling shows up most vividly in intraday behaviour, which is where a hedging assumption breaks first, rather than in the cumulative returns that drive long-horizon portfolio outcomes.
When big ASX news breaks, our subscribers know first
What structurally broke the correlation
A correlation this rare invites a search for causes, and there are several, stacked from the mechanical to the fundamental. Start with the most concrete: Apple simply does not weigh on the index the way it once did.
Apple’s share of QQQ has fallen to roughly 7.31% as of 12 September 2026, according to MarketBeat, down from approximately 20% around 2011. It remains the second-largest holding, but a stock at 7% can rise or fall without dragging the index nearly as forcefully as one at 20%. That alone loosens the mechanical link that once kept the two in step.
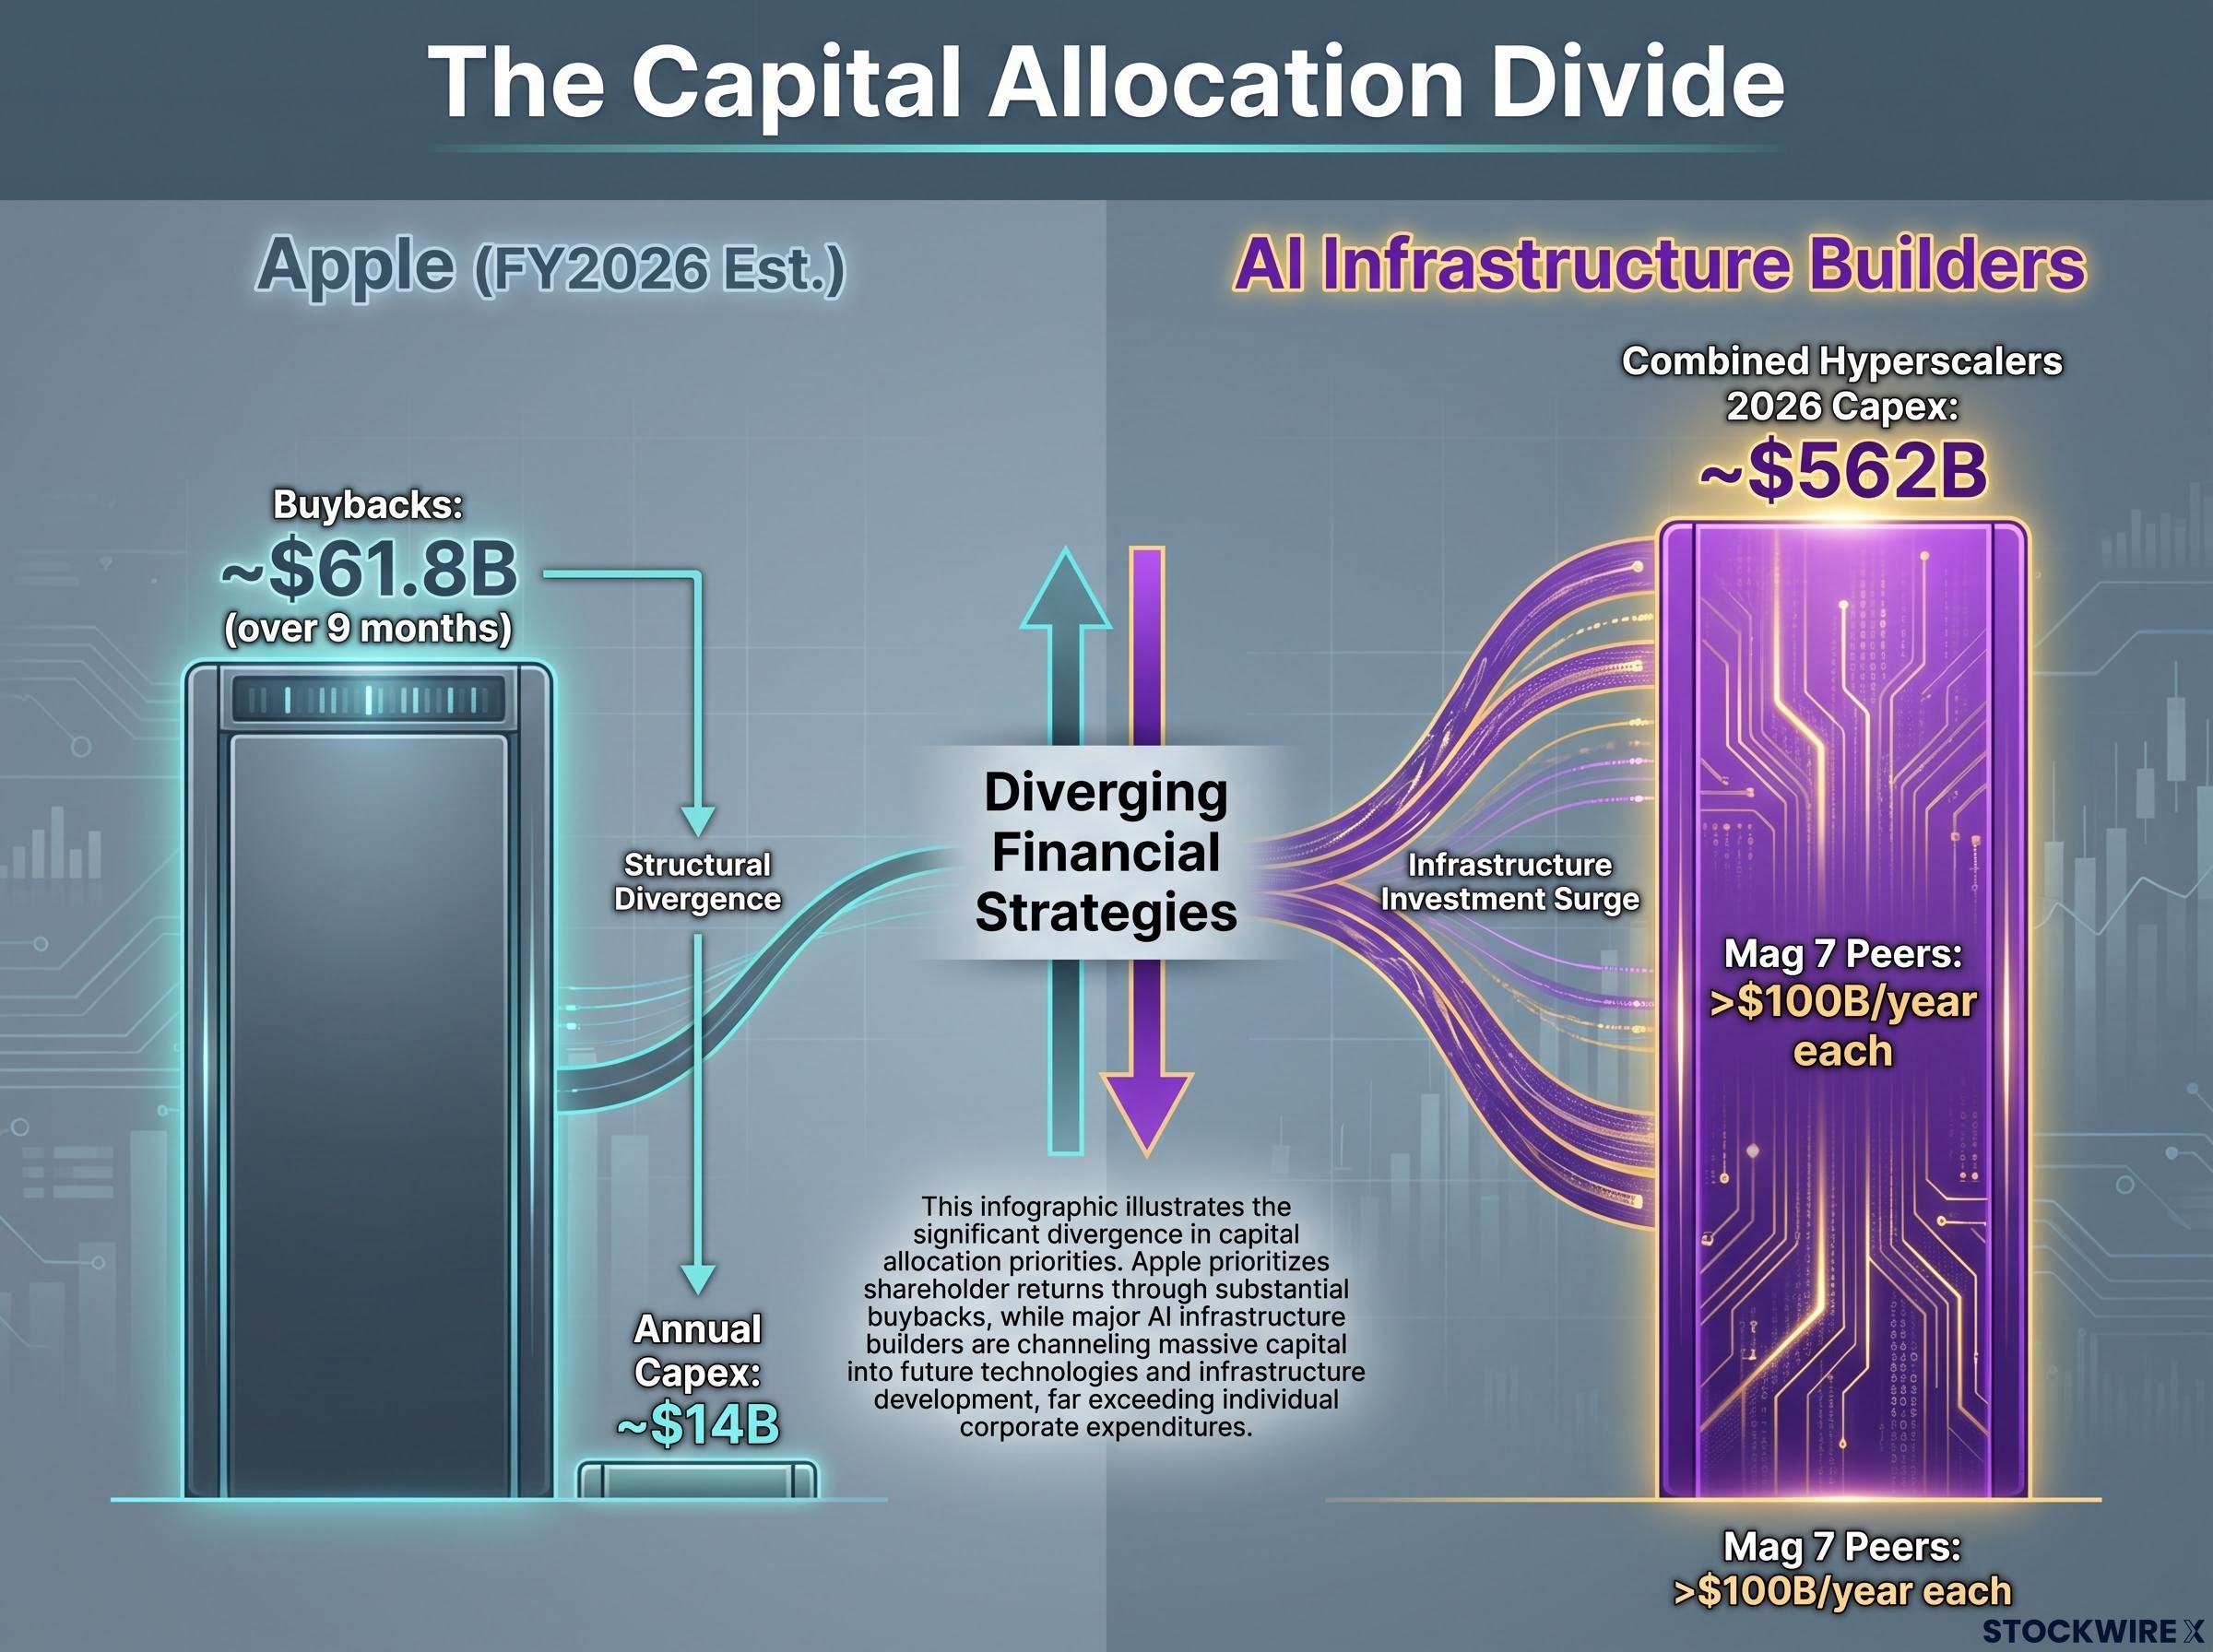
The deeper cause sits in how Apple spends its money relative to the rest of mega-cap tech. Apple’s total capital expenditure was $12.72 billion in fiscal 2025, with an estimate of roughly $14 billion for fiscal 2026. Its peers are individually guiding to figures many times that on artificial intelligence (AI) infrastructure alone.
The contrast sharpens further when you look at what Apple does with its cash instead. The company directed approximately $61.8 billion to share buybacks over nine months, according to ThirdPole Markets, against that roughly $14 billion annual capex line. Research and development did rise 33% to $11.4 billion in fiscal 2026, so Apple is not standing still. But the shape of its spending marks it as a cash-returning consumer and services business, not an AI infrastructure builder.
| Company / Group | Annual AI-Related Capex | Capital Allocation Priority | Index Role |
|---|---|---|---|
| Apple | ~$14B (FY2026 est.) | Buybacks (~$61.8B over 9 months) | 2nd-largest QQQ holding, ~7.31% |
| Combined hyperscalers (RBC) | ~$562B (2026), up from ~$427B (2025) | AI data-centre build-out | Growing share of index returns |
| Magnificent 7 peers (individually) | Well above $100B per year each | AI infrastructure and cloud | Core AI-capex names in the index |
Combined hyperscaler capex reached roughly $427 billion in 2025 and is expected near $562 billion in 2026, according to RBC Wealth Management. What this gap means for you is straightforward: the NASDAQ 100 is increasingly priced as an AI infrastructure index, while Apple is priced as an ecosystem and hardware company. Two different news flows, two different earnings drivers, two prices that no longer need to move together.
The broader AI infrastructure buildout driving hyperscaler capex toward $562 billion in 2026 is not a single spending category but a stack of binding physical constraints, including power availability, cooling density, and grid interconnection timelines, each of which shapes which companies within the NASDAQ 100 are being repriced most aggressively.
The index composition shift behind the numbers
The mechanics deserve one more layer. As semiconductor and memory companies have grown within the NASDAQ 100, they now drive a larger share of the index’s daily movement, which shrinks Apple’s proportional contribution further still. Ergen.AI noted in July 2026 that market leadership has rotated toward chip and memory names, reducing the Magnificent 7’s influence over index returns.
The 2023 NASDAQ 100 special rebalance, implemented to curb the dominance of the largest members, offers a structural precedent for how index concentration can force correlation shifts among mega-caps. The takeaway here is narrow but useful: Apple and the index can diverge without either doing anything unusual on its own. The composition changed underneath both of them.
Three readings of what the divergence actually signals
So what is the negative correlation telling you? There are three credible answers, and they are best held in ascending order of complexity rather than treated as competing verdicts.
- Defensive rotation. Investors are treating Apple as a shelter within technology, buying it as they trim exposure to AI-capex-heavy names. Apple rose roughly 7% over one month while the NASDAQ 100 gained only about 1%, according to Quartz and Yahoo Finance coverage from September 2026. On days when the index edged lower, Apple has climbed, including a 3.2% rise on one such session in February 2026.
- Fundamental repricing. Apple is being valued on iPhone cycles, services revenue, and buybacks, while the NASDAQ 100 is increasingly valued on AI infrastructure expectations. Those are simply different earnings engines, so their prices respond to different catalysts.
Apple’s services revenue trajectory is the lens most relevant to how the stock is being priced relative to the index: services hit an all-time record of $30.98 billion in fiscal Q2 2026, a recurring-revenue base that responds to different catalysts than the AI infrastructure spending cycles driving semiconductor and hyperscaler names higher.
- Index composition artifact. As semiconductor and memory companies drive more of the index’s returns, legacy mega-caps like Apple mechanically diverge regardless of anything Apple-specific. The 40-day correlation fell to 0.21 in February 2026, the lowest since 2006, per Bloomberg data via Yahoo Finance.
The wider dispersion In the referenced 2026 period, the Magnificent 7 index gained roughly 1.1% while the NASDAQ 100 rose about 18%. Apple’s correlation with its Magnificent 7 peers has collapsed from a historical average of 0.4 to 0.5 down to a range of 0 to -0.5.
The most honest read is that all three are probably partly true at once. The 100-day correlation between the Magnificent 7 and the S&P 500 Equal Weight Index fell to -0.27 in 2026, the most negative since June 2023, according to Nationwide, which supports the artifact thesis without excluding the other two. What this tells you is that correlation alone cannot decide whether Apple is a buy, a hedge, or simply a company being priced by a different set of investors. Which interpretation fits your own thesis on Apple should shape how you use the number.
What investors who own Apple, QQQ, or both should actually do with this
Before drawing implications, locate yourself. The negative correlation means something different depending on what you hold:
- QQQ-only holders may not realise they carry indirect Apple exposure that is now moving against the index rather than with it.
- Apple-and-QQQ holders who assumed they owned a concentrated, correlated pair may actually be holding a partial hedge right now.
- Investors reconsidering Apple as an AI play need to weigh the “sleeping giant” case against the “falling behind” case before repositioning.
With that orientation in place, the first discipline is caution against over-reading a short window. A 30-40 day correlation can be driven by clusters of events: earnings, macro surprises, sector rotations. Each of the prior episodes of this correlation level eventually re-converged. ConvexTrade noted in July 2026 that over longer lookback windows, Apple and QQQ remain weakly positively correlated, which reframes the current reading as a notable short-term anomaly rather than a settled new state.
The second consideration is Apple’s emerging AI ramp. Apple’s newsroom announced in February 2025 a plan to spend and invest more than $500 billion in the United States over four years, later expanded to $600 billion across 2025 to 2029, according to Enki.AI. DatacenterDynamics reported in July 2026 that Apple planned up to $1 billion in purchases of Nvidia GB300 NVL72 systems, alongside that 33% jump in R&D. This is the “sleeping giant” case: a delayed but potentially substantial infrastructure push that would change Apple’s risk profile if it materialises.
Here is the reasoning error to avoid. Treating the negative correlation as a durable portfolio condition, without accounting for the strong odds of re-convergence and Apple’s building AI commitments, is exactly the mistake the data invites. The reading tells you something real about how Apple is priced today. It does not license you to bank on that pricing holding.
Variables that would signal re-convergence
Rather than watch the correlation number in isolation, watch for the specific conditions that would pull Apple and the index back together:
- A major Apple AI product or infrastructure announcement that reprices the stock as an AI participant
- A semiconductor-led NASDAQ 100 correction that strips the AI-capex premium out of the index
- A material upward shift in Apple’s QQQ weighting
- A broad risk-off event that collapses cross-asset correlations and drags all mega-caps together
Any one of these would tell you the decoupling is normalising, and it would do so before the headline correlation figure fully catches up.
Apple’s decoupling in historical perspective: what the FAANG era teaches
None of this is without precedent, and the most instructive parallel is the FAANG era. AllianceBernstein’s 2022 “FAANG Is Dead” analysis documented how the original group of Alphabet, Amazon, Apple, Meta, and Netflix experienced sharply diverging performance and correlations, with some names collapsing while others held their ground.
The precedent that matters AllianceBernstein’s 2022 work showed that mega-cap tech cohesion is always provisional and cycle-dependent. Groups that look monolithic fragment when their members’ earnings drivers pull apart.
The lesson applies directly to the Magnificent 7. The group that appeared unified through 2023 and 2024 is now fragmenting along AI-capex lines, and the three historical parallels worth holding together are these:
- FAANG dispersion (2018-2022): proved mega-cap groups splinter when fundamentals diverge, then re-converge under a new shared narrative.
- Magnificent 7 fragmentation (2026): the group’s roughly 1.1% gain versus the NASDAQ 100’s 18% in the referenced period, with peer correlation falling from 0.4 to 0.5 down to 0 to -0.5.
- 2023 NASDAQ 100 special rebalance: a structural precedent for how extreme index concentration forces correlation shifts among the largest members.
Here is the calibration. Five occurrences in 35 years makes this rare, not unprecedented, and every prior episode eventually resolved. The FAANG precedent tells you these groups fragment when earnings drivers diverge and re-converge when a fresh shared narrative appears. For Apple, that narrative may be its AI ramp, or it may not arrive at all, and that uncertainty is precisely what the correlation is pricing.
For investors wanting to situate Apple’s decoupling within the broader rotation away from US tech, our full explainer on US tech valuation spreads examines how MSCI EAFE’s roughly 50-55% forward P/E discount to the S&P 500 IT sector is shaping institutional reallocation decisions across the cycle.
What the correlation break changes, and what it does not
Pulling the threads together, some conclusions are durable and some are not, and it helps to keep them separate.
What this changes:
- Apple is structurally distinct from the AI-capex cohort inside the NASDAQ 100 and the Magnificent 7.
- Investors who treated Apple as a proxy for broad tech exposure have been holding a different risk profile than they assumed, closer to a defensive, cash-returning mega-cap than an AI infrastructure play.
- The full picture (price correlation of -0.82 to -0.86, return correlation near -0.15, peer correlation of 0 to -0.5) confirms the decoupling is real across multiple measures.
What this does not change:
- Whether Apple’s $600 billion investment plan and Nvidia GB300 purchases will re-converge it with the index remains unresolved.
- Whether this is a new regime or a temporary divergence like the prior four is unknown; history favours re-convergence.
- The correlation is not, by itself, a buy signal, a hedge signal, or a sell signal.
The most useful thing this data does is force you to re-examine what you actually own when you hold Apple, not predict where the stock goes next.
This article is for informational purposes only and should not be considered financial advice. Investors should conduct their own research and consult with financial professionals before making investment decisions.
Past performance does not guarantee future results. Correlation readings and financial projections are subject to market conditions and various risk factors, and forward-looking statements about Apple’s AI investment remain speculative and subject to change.