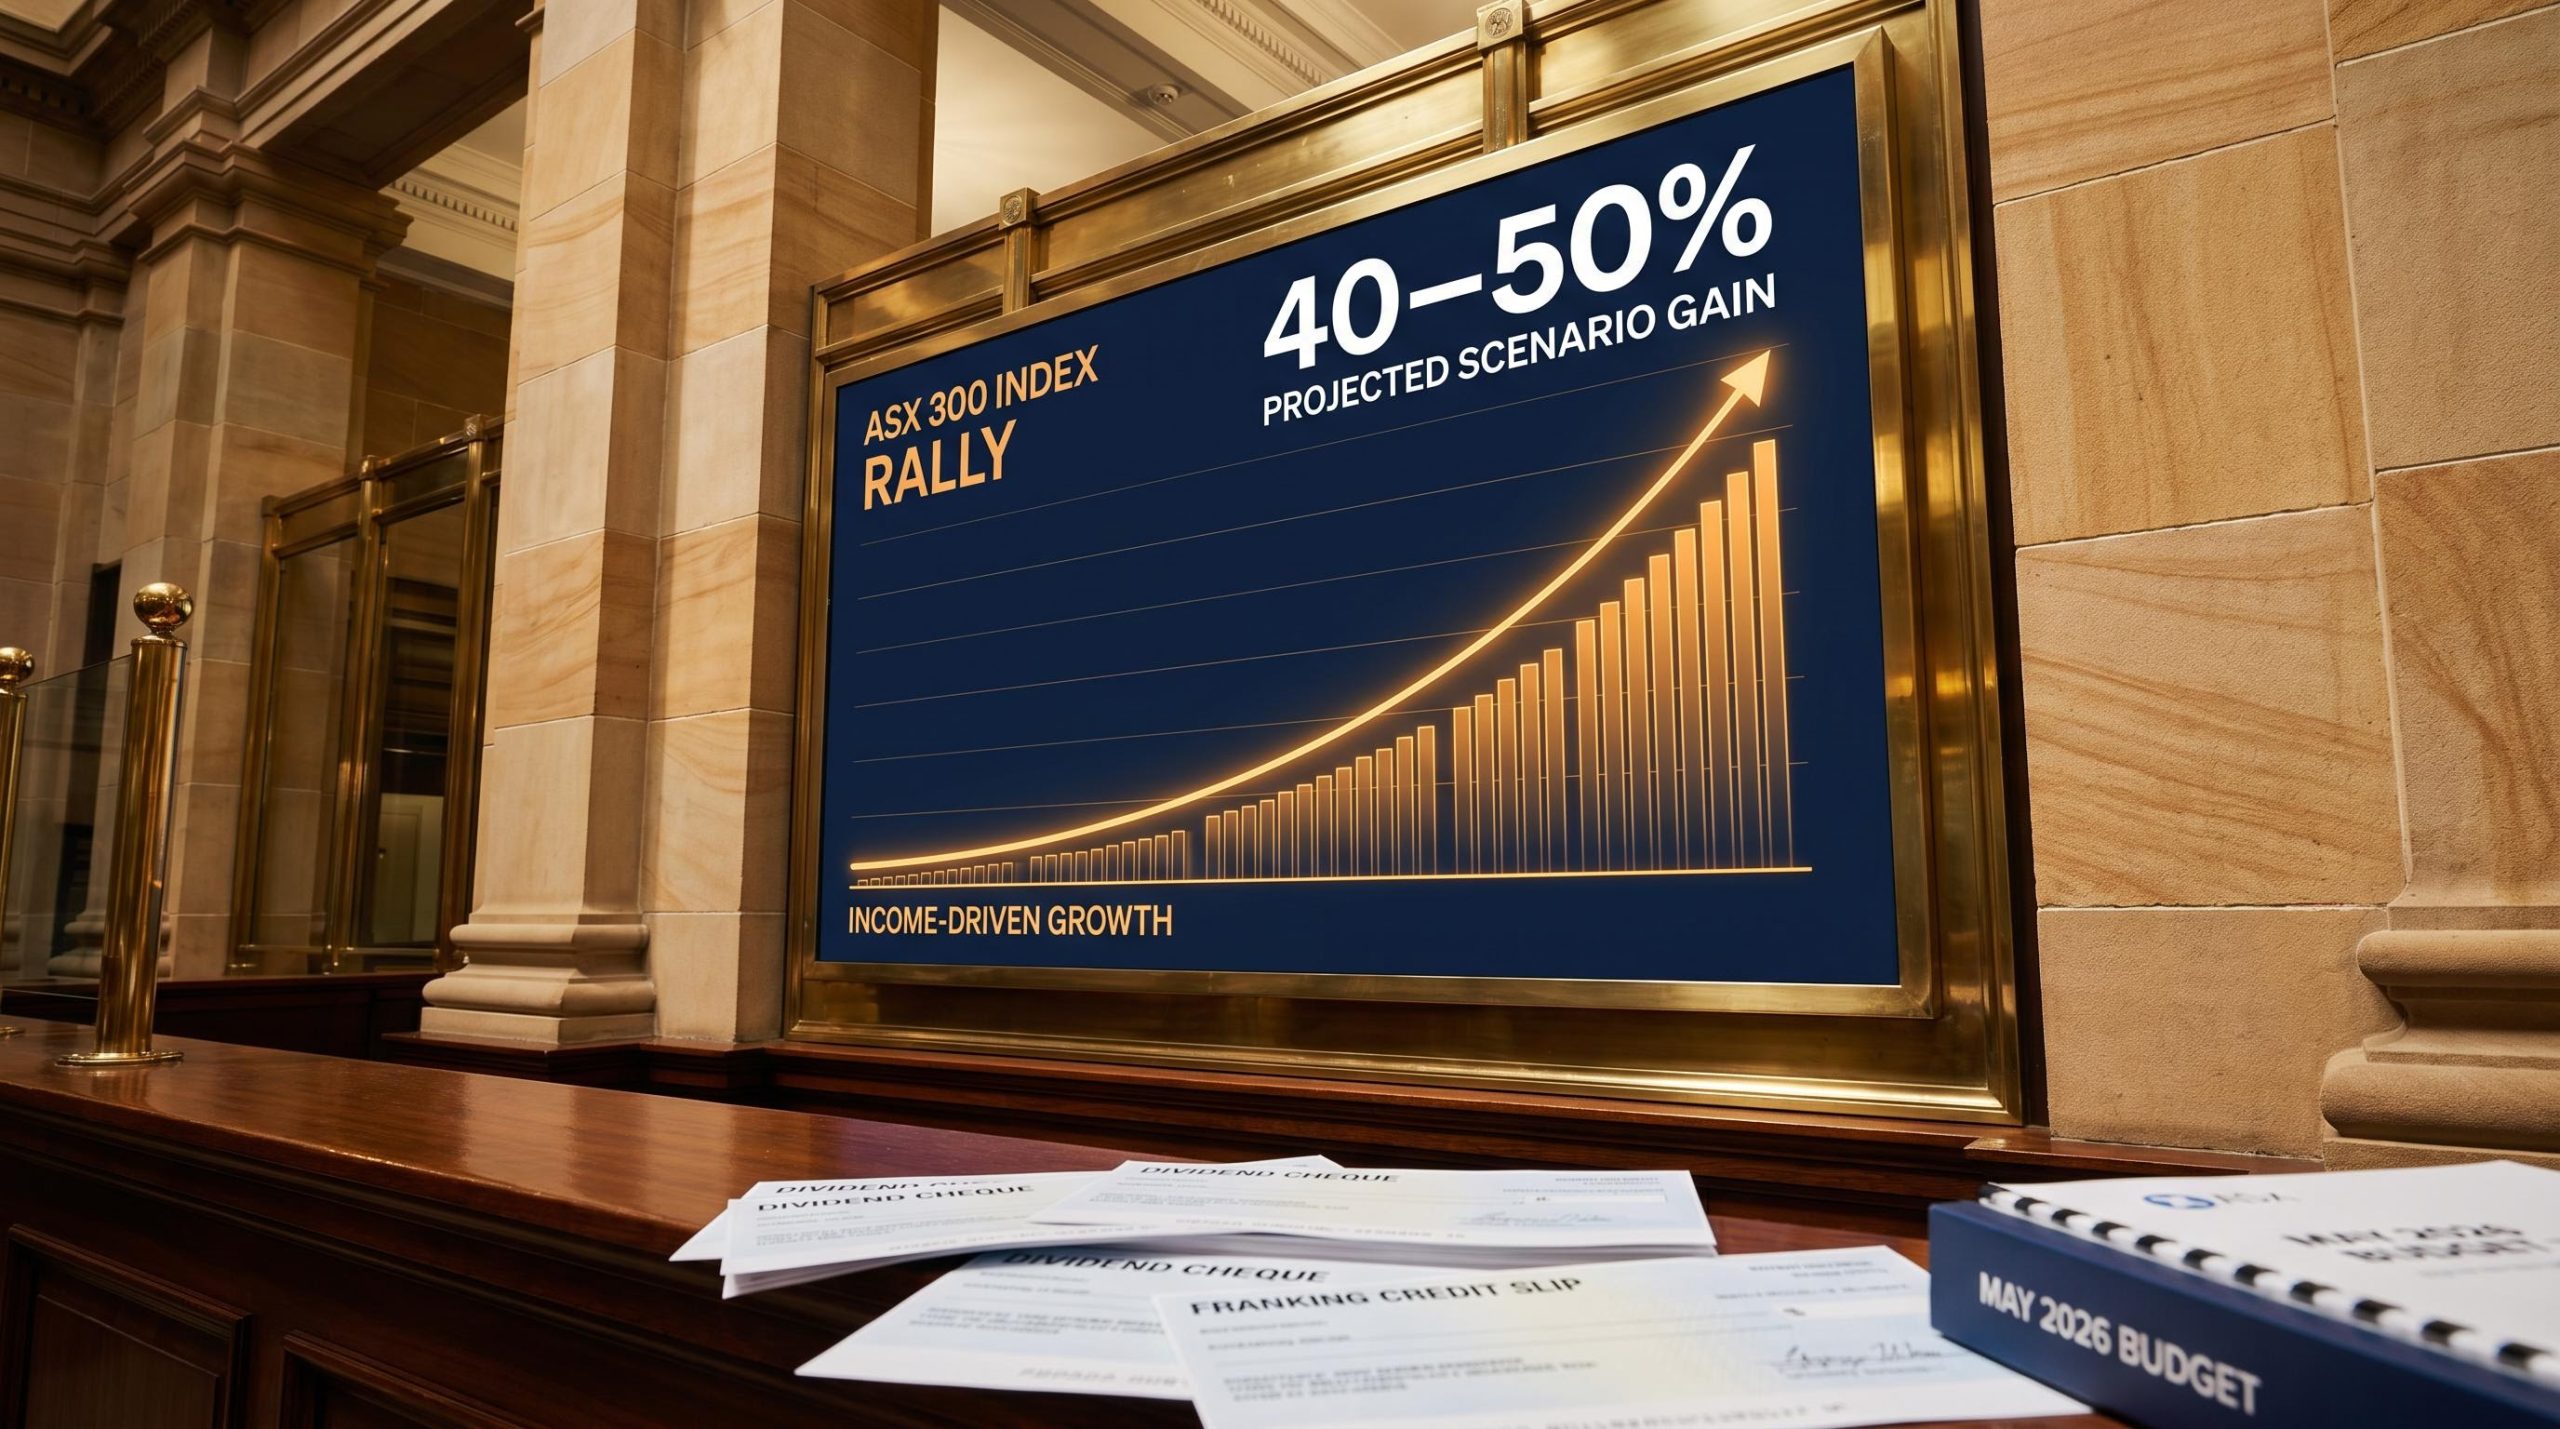
The ASX 300 could plausibly be 40-50% higher within a few years, yet that gain might reflect almost nothing about whether Australian businesses have grown stronger, more innovative, or better managed. That is the paradox sitting inside the proposed capital gains tax reforms announced in the May 2026 Budget.
The reforms are not yet law, but their mechanics are already legible. Two compounding forces, one driven by dividend behaviour and one by interest rates, could arithmetically push ASX 300 valuations substantially higher from 1 July 2027 onwards. What follows unpacks exactly how that works, step by step, separating the arithmetic from the speculation at each stage.
By the end of this piece, you will understand the precise financial mechanics behind the scenario, know which assumptions have to hold for it to materialise, and be able to distinguish a tax-driven re-rating from a genuine signal of economic strength. That distinction is going to matter more than headline index levels for every positioning decision you make after the reforms take effect.
What the proposed CGT changes actually do
The Treasury Laws Amendment (Tax Reform No. 1) Bill 2026, announced as part of the May 2026 Budget, proposes two structural changes to how capital gains are taxed in Australia, both effective from 1 July 2027 and applying only to gains arising after that date:
- Reform one: The existing 50% CGT discount is replaced by inflation-based cost base indexation. Treasury frames this as restoring the original intent of taxing only real gains after inflation, adjusting the purchase price of an asset upward for inflation before calculating the taxable gain.
- Reform two: A minimum 30% effective tax rate on capital gains is introduced for relevant investors, applying to post-July 2027 gains regardless of marginal rate or holding period.
The Parliament of Australia’s Bill digest for the Treasury Laws Amendment (Tax Reform No. 1) Bill 2026 confirms both structural changes: the replacement of the 50% CGT discount with inflation-based cost base indexation and the introduction of a minimum 30% effective tax rate on capital gains, both operative from 1 July 2027.
For many investors who currently benefit from the 50% discount, the practical effect is a higher effective tax rate on capital gains in most realistic holding-period scenarios. That changes the fundamental trade-off between holding an asset for capital growth and receiving franked income. The tax advantage of deferring returns into capital gains is substantially reduced, making income-producing strategies relatively more attractive.
The CGT changes from 1 July 2027 split gains at the reform date, applying the existing 50% discount to pre-reform accruals and subjecting only post-reform gains to indexation and the new minimum rate floor, a transitional structure whose precise calculation methodology has not yet been legislated and will affect the after-tax arithmetic for every asset held across that date.
That shift in the growth-versus-income calculus is the engine behind everything that follows.
When big ASX news breaks, our subscribers know first
How higher payout ratios compress dividend yields and lift prices
Australia’s dividend imputation system, the mechanism that attaches franking credits to dividends so investors receive credit for corporate tax already paid, makes fully franked dividends especially valuable to retirees, superannuation funds, and lower-rate taxpayers. These investors can use those credits to offset their personal tax, and in some cases receive refunds. It is a distinctly Australian feature that already biases the market toward higher payouts than you see in other developed markets.
The grossed-up dividend yield is the correct measure for comparing income across Australian equities, converting a $70 cash dividend into $100 of total value at the 30% corporate tax rate, and it is that grossed-up figure, not the face cash yield, that investors use when estimating where share prices must move to restore yield equilibrium after a payout ratio shift.
When the CGT reforms reduce the after-tax advantage of capital gains, that bias intensifies. Investors who can use franking credits will prefer companies that distribute earnings as fully franked dividends rather than reinvesting them. Corporate boards, accountable to those shareholders, face pressure to lift payout ratios accordingly.
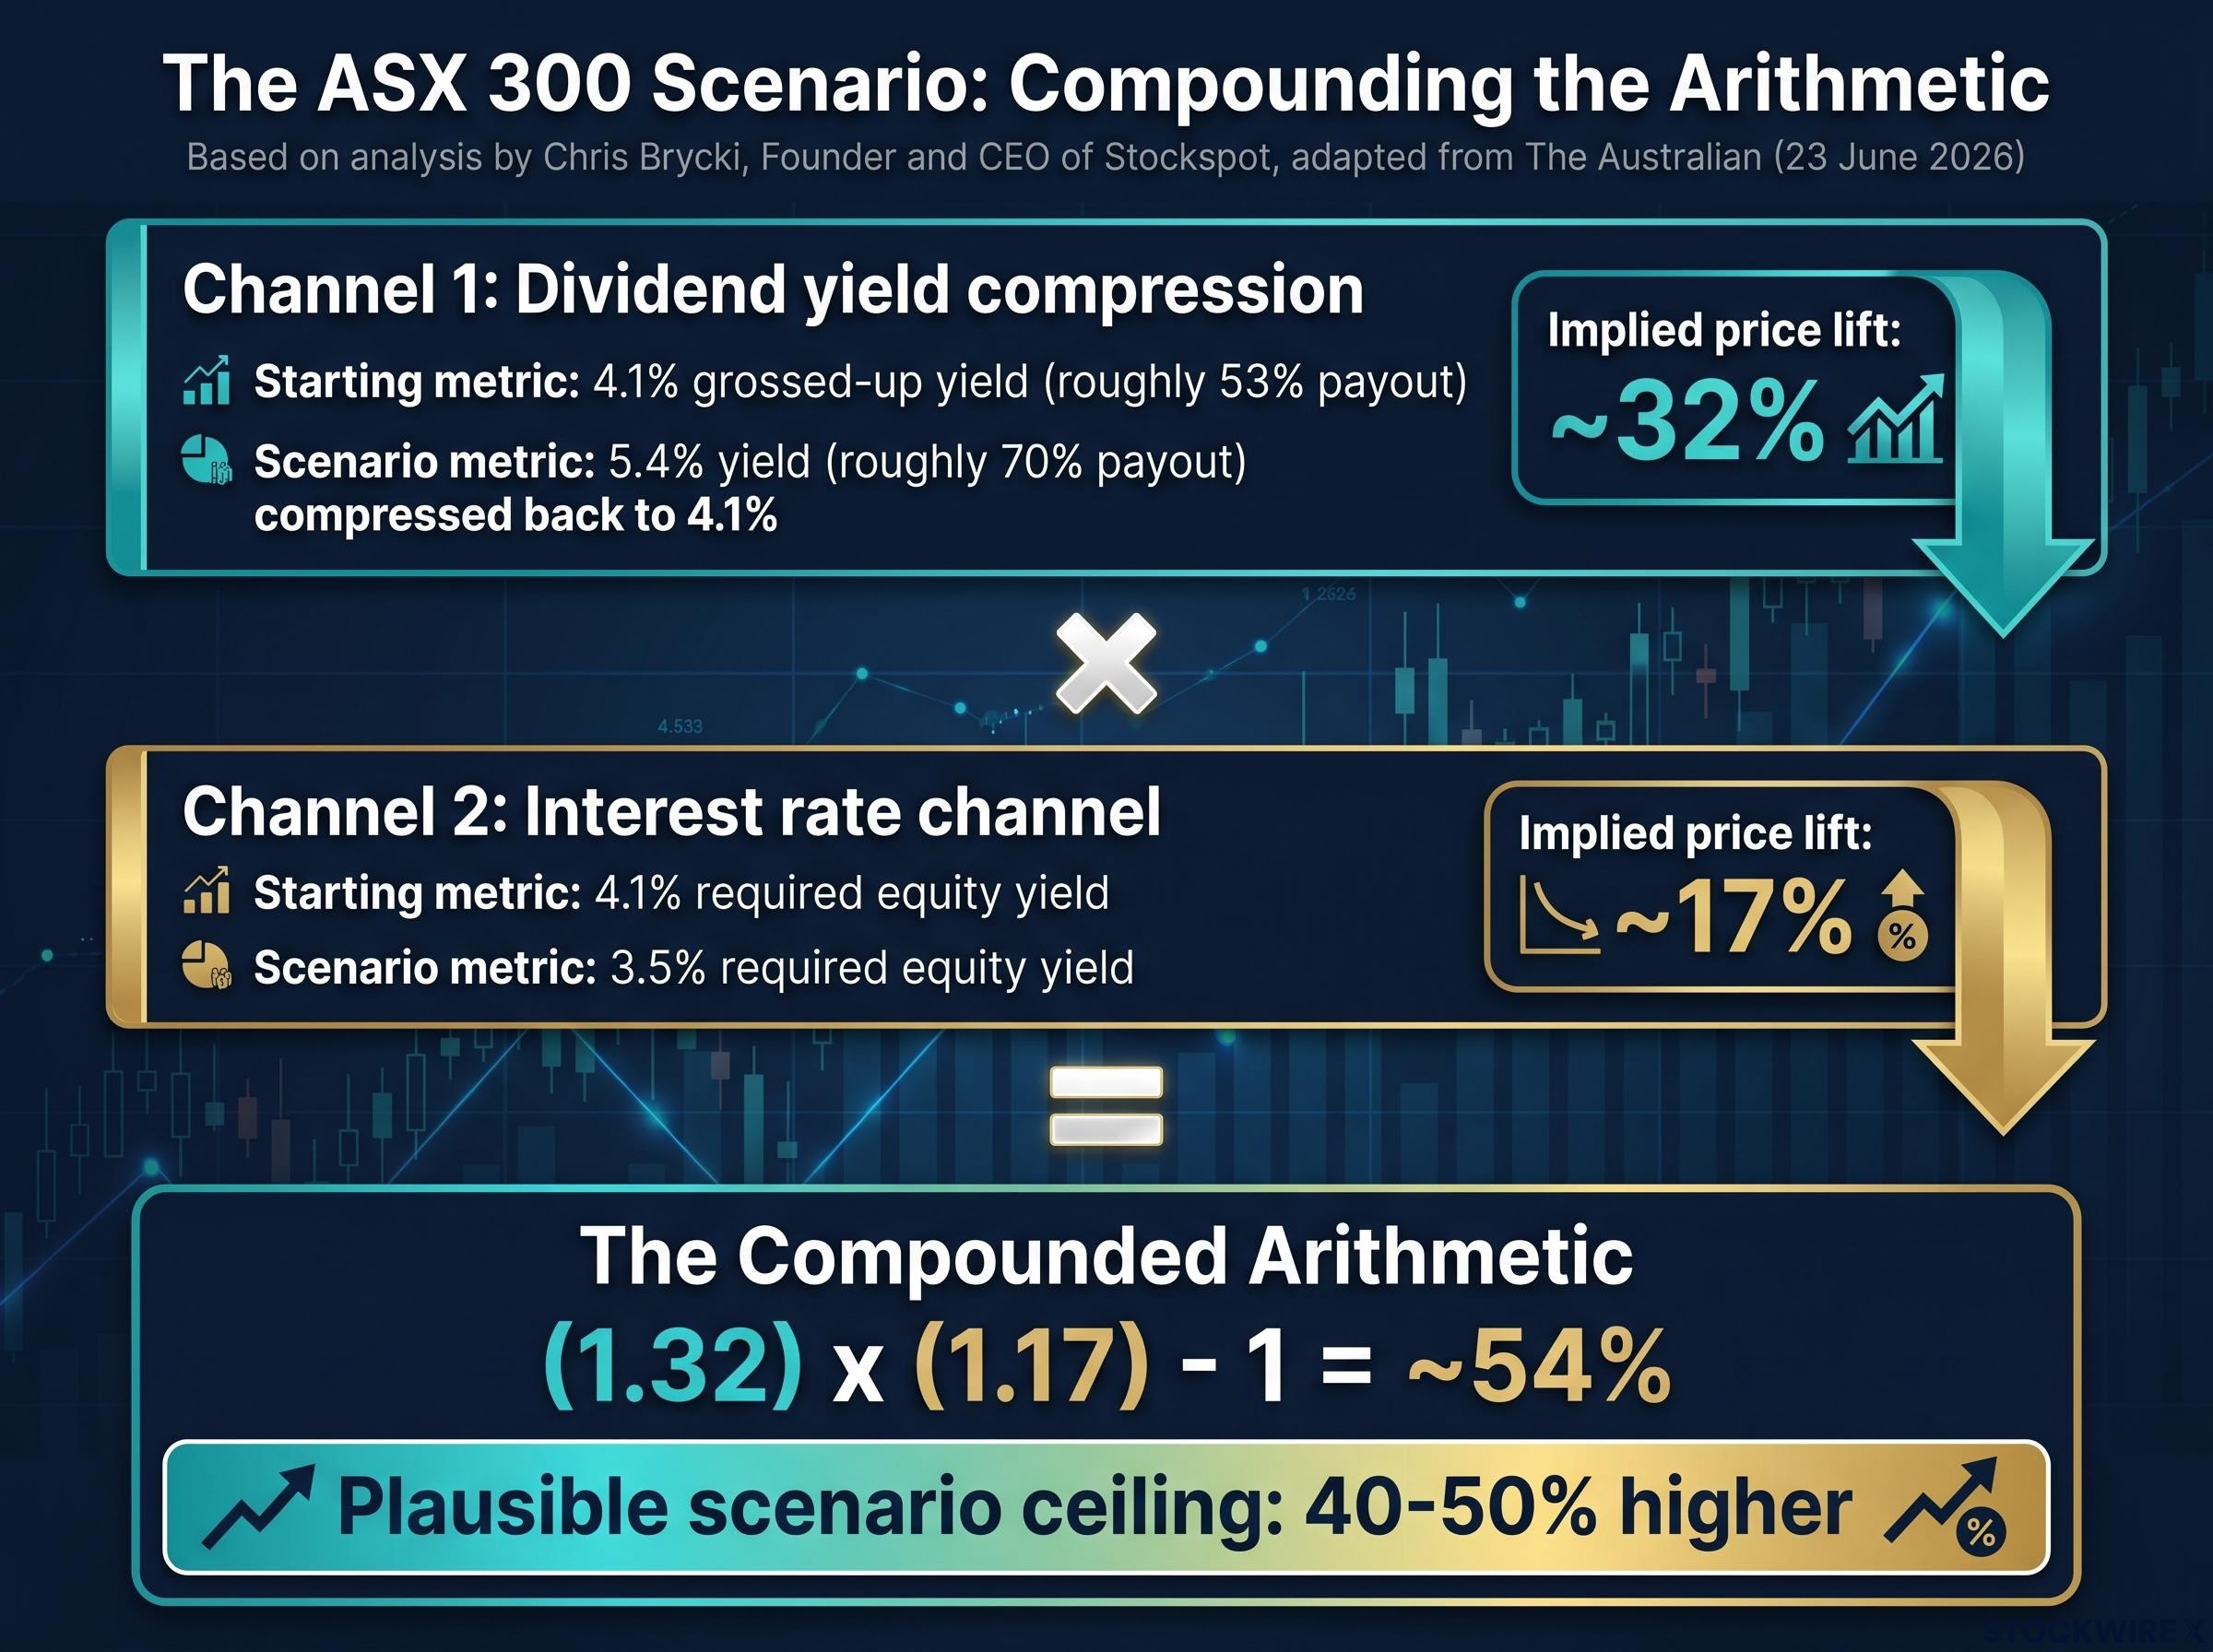
The arithmetic, drawn from scenario analysis framed by Chris Brycki, Founder and CEO of Stockspot, in commentary adapted from The Australian (published 23 June 2026), runs as follows. Today, the Australian sharemarket carries a grossed-up dividend yield of around 4.1%, underpinned by companies distributing roughly 53% of their earnings. A board-level shift pushing that payout ratio up to around 70% would take the grossed-up yield to roughly 5.4%. Income-focused investors seeking to lock in that higher yield would then bid share prices upward until the yield settled back toward the market’s historical norm of 4.1%, implying a price move of:
(5.4 / 4.1) – 1 = approximately 31.7%, rounded to 32%
That 32% figure is arithmetic, not prophecy. Its validity depends on two behavioural assumptions: that boards actually lift payouts to 70%, and that investors demand yields compress back to 4.1%. Hold those assumptions with appropriate scepticism, because several forces push back:
- Boards may resist sustained payout increases where they see compelling reinvestment opportunities
- Sectors like technology and healthcare structurally cannot or will not move to 70% payout ratios
- International investors, who do not benefit from franking credits, dilute the pressure on both payouts and yield compression
Why weaker investment flows into lower rates and higher equity prices
Higher payout ratios do not exist in isolation. If companies distribute more of their earnings, they retain less. Less retained earnings means less business investment in research and development, capital expenditure, and expansion. That is the direct downstream consequence of the first channel, and it opens the second.
Lower investment depresses trend economic growth over time, reducing demand for capital. Reduced demand for capital puts downward pressure on interest rates. And lower interest rates cause investors to accept lower required yields from equities, which mechanically means higher equity prices. The pricing of income-generating assets moves in relation to prevailing risk-free rates, so as cash and bond yields fall, equities gain relative appeal and investors accept a lower return from them in compensation.
Brycki’s scenario assumes the market’s required equity yield falls from 4.1% to 3.5%. Under that shift, with dividends held constant, the arithmetic points to share prices rising by roughly 17%:
(4.1 / 3.5) – 1 = approximately 17.1%, rounded to 17%
The 0.6 percentage-point shift in required equity yields is large in relative terms. It would reflect some combination of lower risk-free rates, lower equity risk premia, and higher perceived earnings durability. The Reserve Bank of Australia responds to a wide array of domestic and global forces; attributing a clean yield shift of that magnitude purely to CGT-induced underinvestment is an assumption that would unfold over many years, not a quarter. This is the most speculative of the two channels.
| Channel | Starting metric | Scenario metric | Implied price lift |
|---|---|---|---|
| Dividend yield compression | 4.1% grossed-up yield | 5.4% yield compressed back to 4.1% | ~32% |
| Interest rate channel | 4.1% required equity yield | 3.5% required equity yield | ~17% |
The compounded arithmetic and where the speculation lives
Compound the two channels multiplicatively and the arithmetic supports a substantial move:
(1.32) x (1.17) – 1 = approximately 54%
That figure underpins the 40-50% scenario range cited by Brycki as a plausible upper bound. The maths checks out. The question is whether the assumptions behind each input hold simultaneously, and whether the two channels operate independently enough to compound cleanly.
They may not. Four sources of slippage deserve attention:
- Channel overlap. The same underlying forces, slower growth, altered risk premia, sector switching, affect both payout decisions and required yields. Some of the re-rating attributed to lower rates may already be embedded in the initial yield compression, meaning the true compounded effect could be lower than the multiplicative arithmetic implies.
- Sector heterogeneity. The ASX 300 is not a uniform basket. Resources companies, global growth names, and firms with limited franking capacity will re-rate differently (or not at all), dampening the aggregate index move.
- Policy reversal risk. If the reforms caused visible underinvestment and growth damage, future governments could modify the rules, limiting the duration of any distortion.
- Global macro override. Commodity cycles, US interest rates, and Chinese demand could easily overwhelm or offset any tax-driven re-rating of Australian equities.
The honest analytical position is this: a material re-rating is plausible, and the arithmetic allows something in the vicinity of 40-50% at the optimistic end. That is the ceiling of the scenario under aggressive assumptions, not a base case.
Why a surging ASX 300 would not mean the economy is performing well
This is where the analysis turns from mechanics to meaning, and where the distinction matters most.
Equity indices reflect discounted expectations of cash flows under prevailing tax, rate, and risk regimes. They do not measure productivity, innovation, or the dynamism of the businesses inside them. A market that rises because tax rules now reward distributions over retained growth, because higher payouts have mechanically compressed yields, and because reduced business investment has softened interest rates, would carry no information about whether Australian companies had become more competitive or more capable.
The rally and the deterioration would be two faces of the same policy effect. Higher payouts mean less R&D, less capital expenditure, less expansion into new markets. The index climbs while the investment foundation beneath it erodes.
What a rising index would signal versus what it would not:
- Would signal: A regime change in tax treatment and payout behaviour, a repricing of income-generating assets under new after-tax arithmetic
- Would not signal: Productivity improvement, innovation acceleration, or genuine earnings quality growth across the economy
The Budget includes companion measures partly designed to offset these dynamics: loss carry-backs, instant asset write-off permanency, and small-startup loss refunds. These matter. But the headline CGT changes are still likely to bias portfolios toward income and away from growth, with the most acute impact on the sectors that depend on long-term, high-risk capital: venture capital, deep technology, and R&D-heavy industries.
For investors wanting to understand the full downstream impact on growth capital, our deep-dive into how the CGT reform affects angel investors examines survey evidence showing 91% of founders and sophisticated investors are less willing to back Australian startups, an estimated $90-$180 million in capital already redirected or delayed, and the structural two-tier treatment that leaves individual angels exposed while institutional fund vehicles retain concessional status.
For you as an investor, headline index performance after 1 July 2027 will be a less reliable signal of economic health than usual. Sector-level and earnings-quality analysis becomes more important, not less, in a tax-driven re-rating environment.
“This article is for informational purposes only and should not be considered financial advice. Investors should conduct their own research and consult with financial professionals before making investment decisions.”
What investors should actually watch after July 2027
The reforms create both an opportunity and a risk, and the window between now and 1 July 2027 is the period for positioning decisions.
On the opportunity side, income-heavy, high-payout, fully franked sectors stand to benefit relatively more from the structural shift. On the risk side, a market that re-rates on the basis of lower implied required yields becomes unusually exposed to any future rate normalisation, precisely the dynamic that drove global corrections when ultra-low-rate markets faced rising yields in 2022-2023.
Rate-sensitive income sectors, including Financials, Utilities, and Real Estate, routinely make up 65-85% of high-dividend indexes, and the MSCI World High-Dividend Yield Index fell approximately 7.6% peak to trough in early 2026 even as the broader market recovered to all-time highs, a reminder that the same yield-compression dynamic that inflates income portfolio valuations can reverse sharply when rate assumptions are repriced.
| Sector category | Reform exposure | Key consideration |
|---|---|---|
| Income-oriented (banks, utilities) | Positive: higher demand for fully franked yields | Rate-sensitivity risk if yields normalise |
| Growth-oriented (tech, healthcare, early-stage) | Negative: reduced capital gains incentive, less patient capital | Structural headwind on long-duration valuations |
| Resources | Mixed: franking dynamics differ, global pricing dominates | Less affected by domestic tax shift |
| Global names (dual-listed, offshore earners) | Minimal: investor base less reliant on franking | Relative underperformance possible in income-chasing rotation |
The valuation metrics that matter most in a post-reform environment are the ones that cut through headline index noise:
- Price-to-earnings: Separates tax-driven price lifts from genuine earnings growth
- Price-to-cash-flow: Captures whether higher payouts are coming at the expense of reinvestment capacity
- After-tax yield comparisons: The metric that now drives relative asset allocation decisions under the new regime
A market that has priced in a required yield of 3.5% is vulnerable to any macro shock that reprices that assumption. If you understand the mechanics, both the opportunity in income-oriented positioning and the concentration risk that comes with it, you are better placed to navigate what could be the most structurally unusual period for Australian equities in a generation.
“Past performance does not guarantee future results. Financial projections are subject to market conditions and various risk factors.”
—