Five of the most closely watched names in US tech and AI infrastructure posted strong weekly gains in late September 2025 and then arrived at the same obstacle: resistance. Meta, Microsoft, Astera Labs, ARM, and Credo Technology each rallied into zones where price had previously stalled, reversed, or failed outright, and where momentum indicators were signalling that buyers might be running low on fuel.
The timing complicates the picture. End-of-quarter window dressing was artificially extending momentum into the quarter-close, producing a surface appearance of strength that masks elevated risk for anyone entering fresh. Each stock also carried a meaningfully different risk profile depending on its RSI condition, its position in the channel, and whether a confirming close above the relevant level had actually happened.
Here is what the charts actually said about each of these five stocks approaching key resistance, what the signals mean in plain terms, and where the exact levels sit that change the risk and reward. After reading this, you will know which setup had the most runway left, which one was flashing a structural warning that overrode the bullish momentum, and what to watch before committing to any entry.
What parallel channels and RSI are actually telling you right now
Before breaking down five stocks, it helps to see the same picture the analysts were looking at. Imagine price rising within two parallel diagonal lines, a floor and a ceiling climbing together over time. That is a parallel ascending channel, and running straight through the middle of it is the 50% midline.
Where price sits inside that channel tells you a lot. In the lower half, there is room above for price to run toward the ceiling. Push into the upper half, and the odds shift: price is now closer to overhead supply, the zone where earlier buyers may look to sell.
The Relative Strength Index (RSI) measures how fast and how far price has moved recently, on a scale of 0 to 100. The three readings that matter here are simple:
- Above 70: the conventional overbought signal, meaning buyers have pushed price hard and may be running out of steam.
- Above 80: extreme overbought, with an elevated probability of at least a short-term pullback.
- Below 30: oversold, indicating price may have fallen too far, too fast.
There is one more distortion worth flagging for late September. Institutional managers often buy the quarter’s winners in the final days to make their reported holdings look better, a practice known as window dressing.
Window dressing at the quarter-close In the 29 September 2025 “Trading The Close” recap, Verified Investing’s Drew Dosek observed that quarter-end institutional buying into high-profile winners can artificially extend momentum stocks into resistance, creating deceptive extensions that unwind once the flows subside.
What this means for you is direct: a breakout attempt in the final week of a quarter deserves less trust than the same move at any other time. It may be institutional housekeeping rather than genuine demand.
The 50% midline as a decision point, not a buy signal
The reason the midline matters is confluence, which is when several separate technical levels stack up at the same price. Prior price pivots and Fibonacci retracement levels often align with the midline, and that overlap is what makes these zones sticky.
Verified Investing’s stacked-support methodology looks for exactly this clustering: gap fills, moving averages, and Fibonacci levels converging at one price. On the conservative reading, the midline is where you reduce risk or wait for a pullback, not where you chase.
Technical level confluence is what makes the midline particularly sticky: when a prior pivot, a Fibonacci retracement, and the parallel channel boundary all converge on the same narrow price zone, the probability of a stall or reversal rises substantially compared to any single level acting alone.
A hybrid version splits the difference: respect the level, but require a confirmed second close above it before treating the break as real.
When big ASX news breaks, our subscribers know first
Meta and Microsoft: same channel structure, diverging risk profiles
On a chart, Meta and Microsoft looked like the same trade in late September. Both were approaching the 50% midline of parallel ascending channels, and the visual similarity was genuine. Reading them as equivalent setups, however, is the analytical error this section exists to correct.
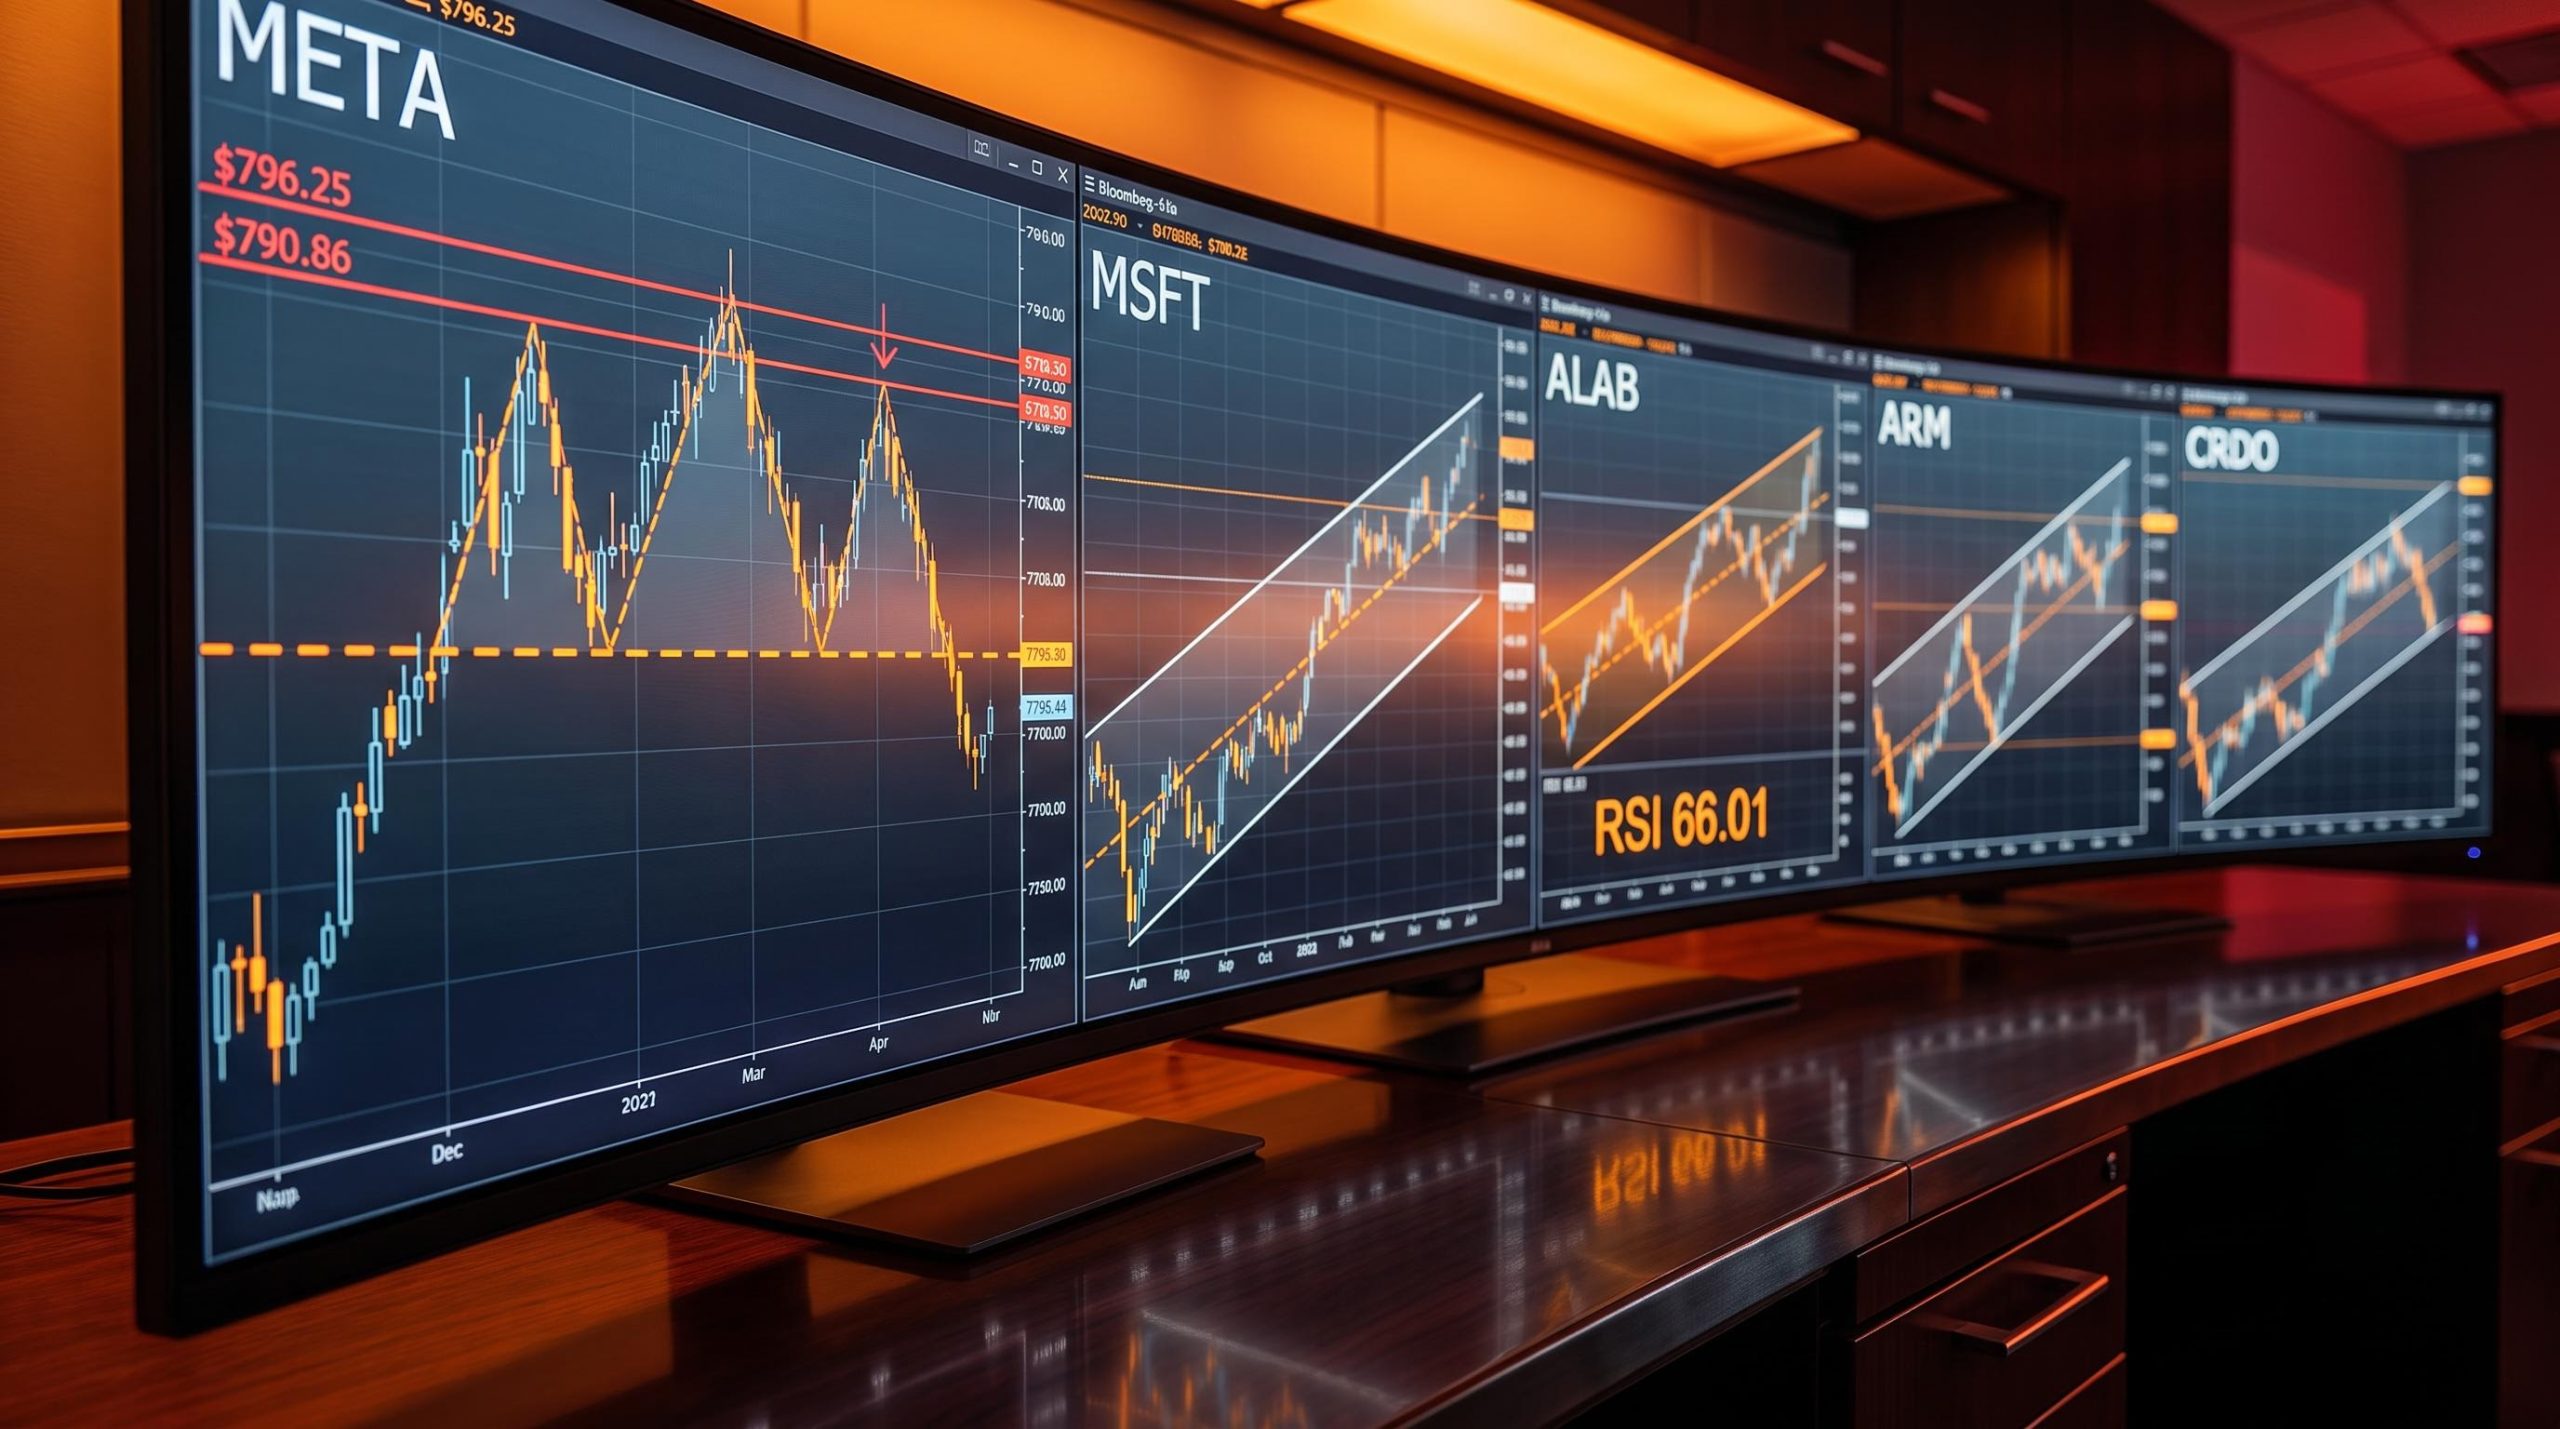
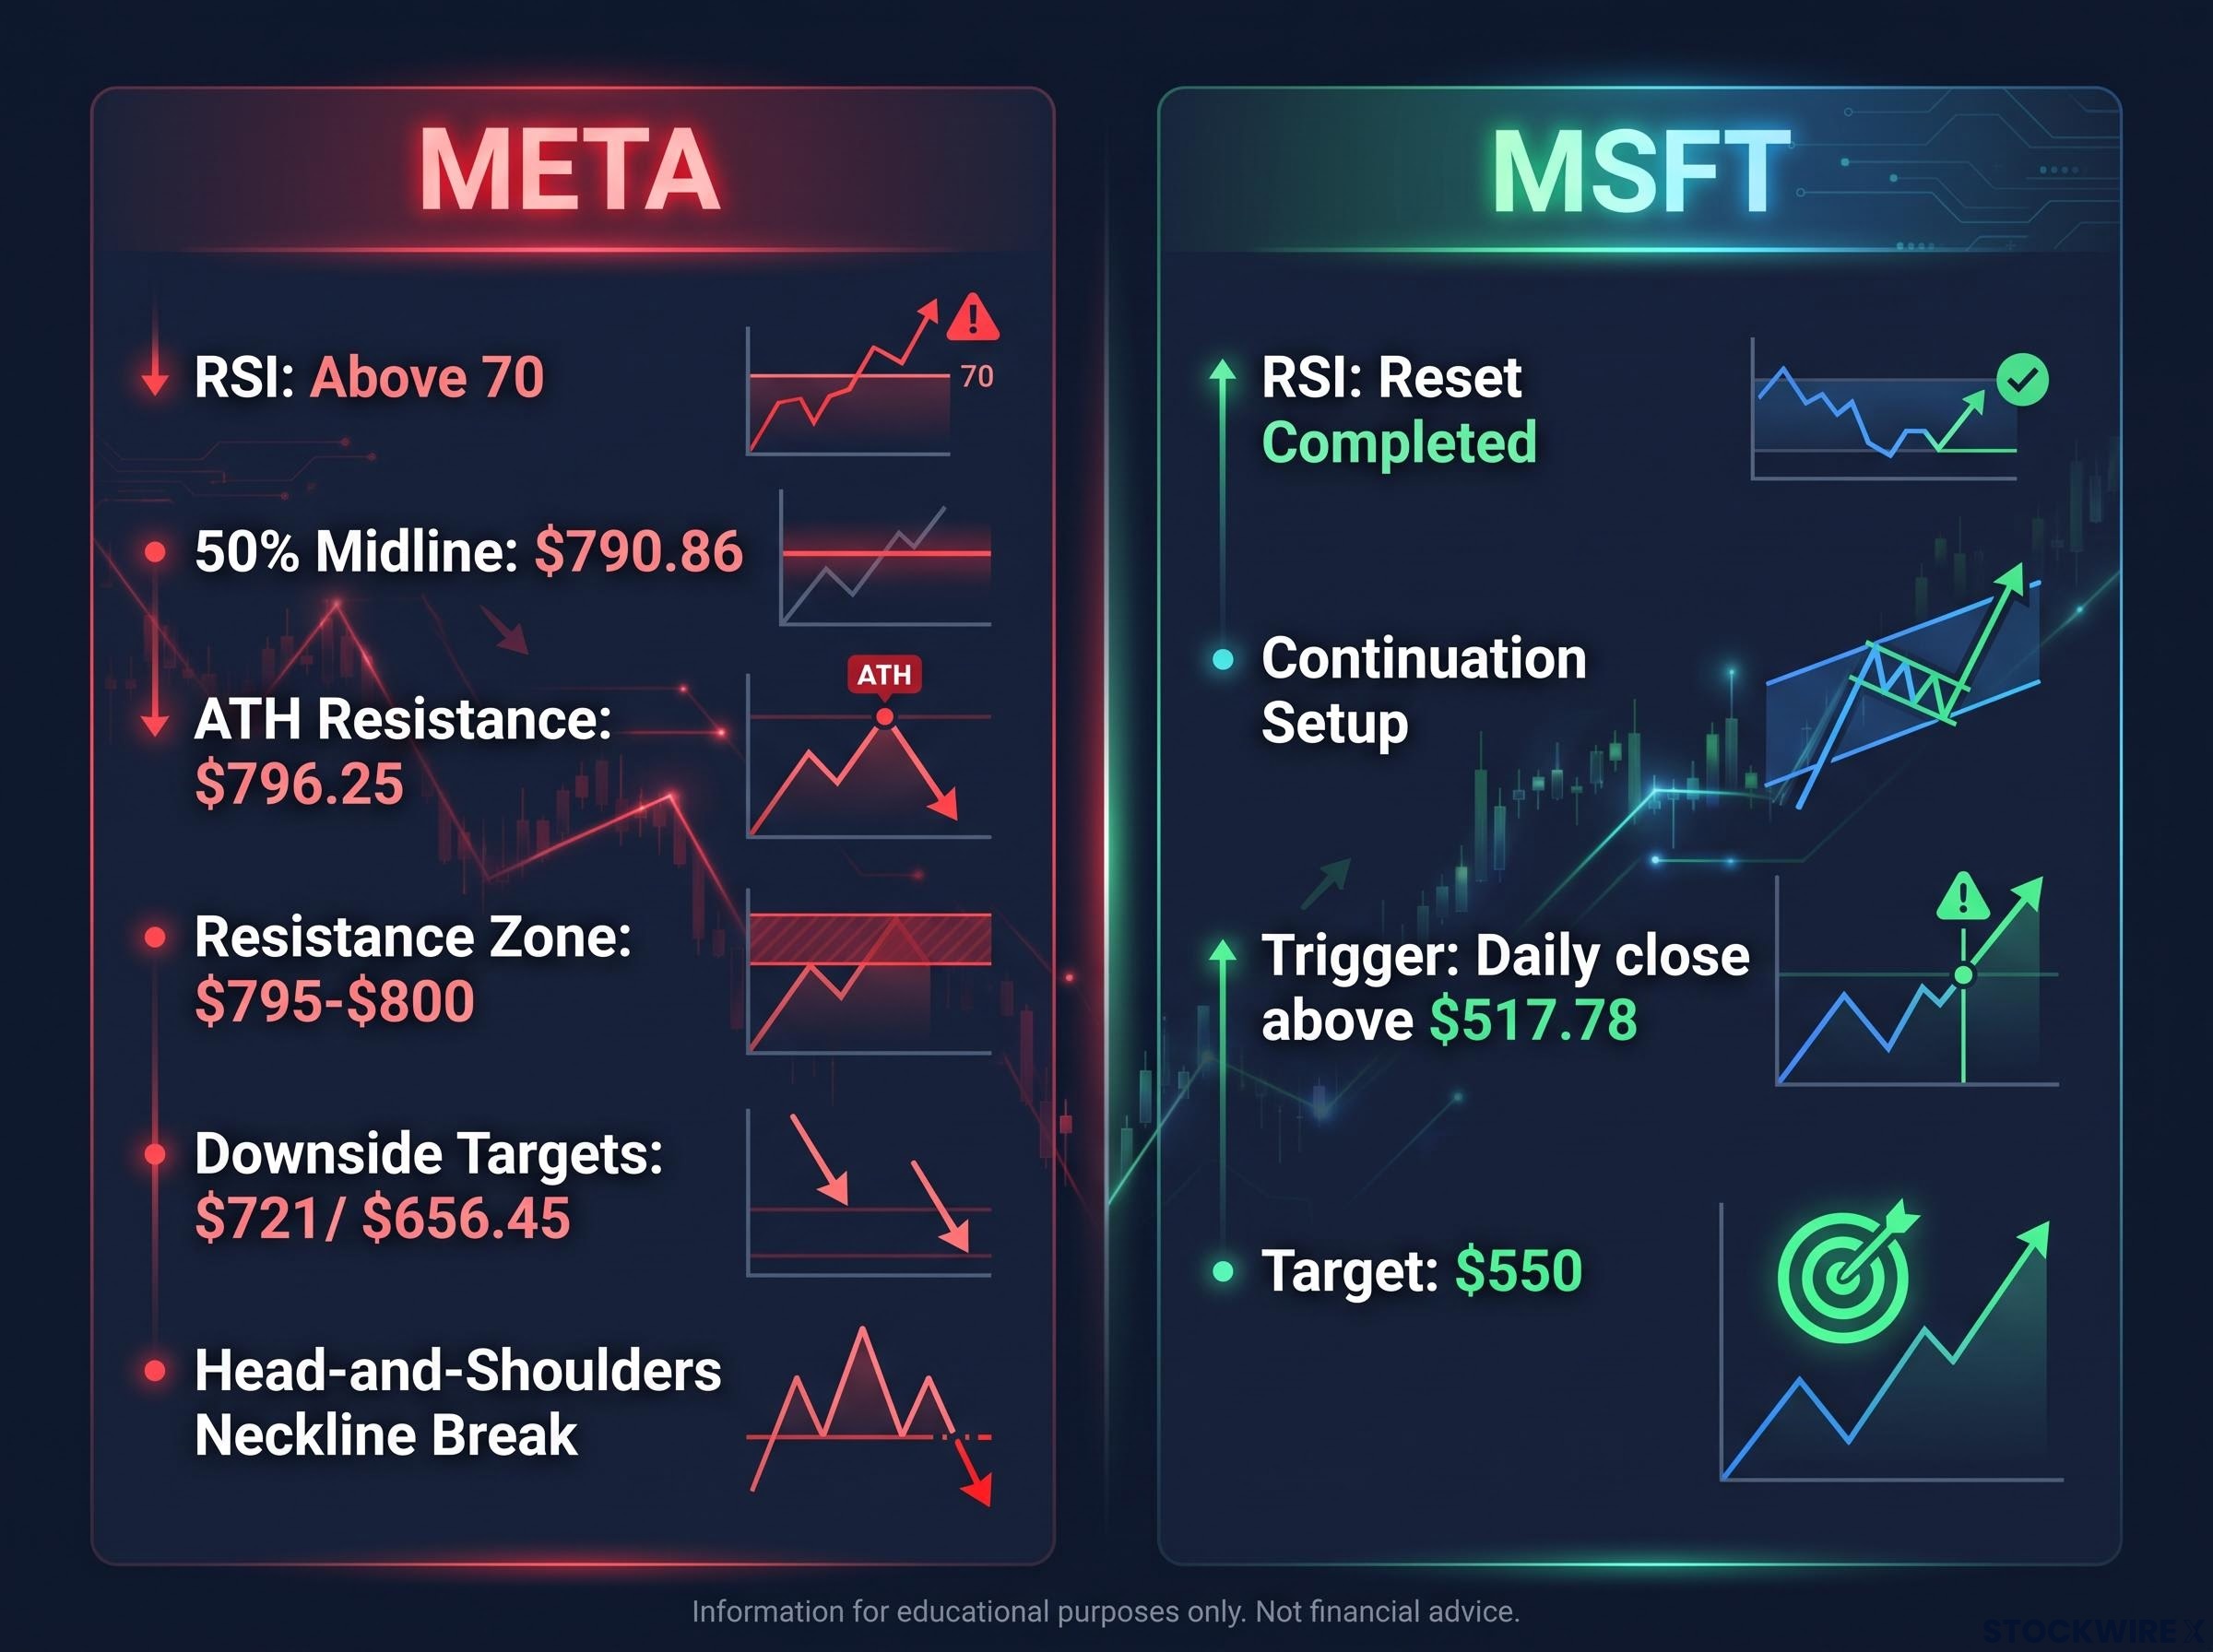
Start with Meta, because Meta was the warning. Its 50% channel midline sat at $790.86, all-time high resistance at $796.25, and a secondary pivot at $790.80, stacking into a triple-top resistance zone near $795-$800 that Dosek described as holding “loads of resistance” up to $800.
Worse, Meta had formed a large head-and-shoulders pattern, a topping structure where a central peak sits between two lower ones, and had closed below its neckline as of 29 September 2025. RSI on the weekly timeframe was above 70.
Dosek on Meta Verified Investing’s Drew Dosek warned on 29 September 2025 that the stock is “on a cliff,” characterising the chart as “flashing a major warning sign.”
Once a neckline breaks, the pattern projects downside targets. For Meta, that meant an initial target near $721 and a full measured-move target around $656.45.
Head-and-shoulders completion rates under bull-market conditions reach 81% for confirmed neckline breaks continuing at least 5% lower, which gives quantitative weight to the Meta warning: a pattern with that historical completion rate, breaking a neckline from a triple-top into overbought RSI territory, is not a marginal signal.
Microsoft told a different story at the same location. During its prior consolidation, Microsoft’s RSI had already corrected from overbought levels, a reset Meta had not yet completed, which lowers the reversal risk of standing near the midline.
A daily close above $517.78 would raise the probability of Microsoft entering its next upward wave, with $550 as the subsequent trendline resistance target. Microsoft was also not yet at all-time highs during the analysis period, leaving it more room overhead than Meta had.
| Stock | Midline Level | RSI Condition | Pattern Signal | Key Confirmation Level |
|---|---|---|---|---|
| META | $790.86 | Above 70 (overbought) | Head-and-shoulders neckline break | Break below neckline low confirms downside |
| MSFT | Below all-time highs | RSI reset completed | Continuation setup | Daily close above $517.78 |
If you were watching both and treating them as one trade, the read is this: Meta’s neckline break was a structural signal to step back and wait, while Microsoft’s completed RSI reset meant the same proximity to the midline carried meaningfully lower reversal risk.
ALAB and ARM: two AI infrastructure names with different amounts of runway left
Of the five, Astera Labs had the healthiest technical picture, and the reason sits in a single number. Its RSI read 66.01, below the 70 overbought threshold, which is the clearest evidence in this group that buyers were not yet exhausted.
ALAB was testing a pivot resistance level dating to 4 August. It had not closed above that pivot in the three most recent sessions, though price was trading above it intraday, and a sustained daily close there would open the path toward the channel midline at roughly $426.
That RSI cushion is worth noting if you are ranking entry risk across the group. Where Meta was overbought at a triple-top, ALAB still had room before hitting the same wall.
ARM was the opposite: unresolved. It was oscillating around a midline of $311.50 for the session, a level rising roughly $1 per day toward approximately $312.50 the following Monday, and it had not yet delivered the confirming close.
The pattern that kept ARM stuck looked like this:
- Three green daily candles pushing price higher.
- A failed extension above the midline, followed by a close back below it.
- A rebound off that failure, suggesting another attempt at the midline.
Dosek’s rule for ARM was strict: a clean confirmed close above the midline had to come first before the upside targets became active. Those targets were the 61.8% Fibonacci resistance at $336.04 and a subsequent wave target near $363.58.
| Stock | RSI Reading | Midline Level | Confirmation Trigger | Next Resistance Target |
|---|---|---|---|---|
| ALAB | 66.01 | $426 | Sustained close above 4 Aug pivot | $426 channel midline |
| ARM | Not published | $311.50-$312.50 | Confirmed close above midline | $336.04 (61.8% Fib) |
Both names sit inside the same AI infrastructure theme, Astera Labs in rack-scale connectivity and ARM in semiconductor IP design, which is part of why their charts rhymed. What separated them was confirmation: ALAB had the momentum cushion, ARM still had to prove itself.
AI infrastructure suppliers including names in rack-scale connectivity and semiconductor IP design have been among the most volatile outperformers of 2026, with optical networking and power providers posting 90-130% revenue growth in some cases, which is part of why their charts compress so many technical events into short windows.
Credo Technology’s 9.33% surge and the resistance zone it is now entering
Credo Technology made the loudest single move of the five, jumping roughly 9.33% in one session and breaking through a major price gap. The obvious question is how much of the upside that speed had already captured.
The answer sits in where that surge landed. CRDO ran straight into a breakdown-and-retest pattern, meaning price had returned to a level from which it previously declined, and that old breakdown level now acts as resistance from below.
Resistance zones as supply zones attract selling from two distinct sources simultaneously: profit-takers exiting long positions initiated lower, and trapped buyers from a prior failed breakout who use the return to their entry price to exit at breakeven, and the combination of both seller types is what gives prior breakdown levels their reliability as reversal anchors.
That structure matters because such zones frequently trigger reversals or stalls. Even with RSI outside overbought territory, the rapid approach to overhead supply was expected to halt price regardless of the momentum reading.
The decision zone was tightly defined.
CRDO resistance zone Primary resistance sits at the 50% channel midline of approximately $219.79, with secondary resistance at approximately $222.44.
Those two levels represent different things structurally:
- $219.79: the 50% parallel channel midline, the primary overhead barrier.
- $222.44: secondary resistance just above, marking the ceiling of the decision zone.
Dosek expected consolidation or reversal to begin the following week given how close price sat to both levels. A constructive resolution would require a pause first, letting RSI rebalance before any attempt to push above the ascending trendline.
Here is the interpretive trap. A 9.33% single-session gain sounds like powerful confirmation, but in a breakdown-and-retest into $219.79, it signals that the easy money on this leg was likely already made. Entering after the surge carries asymmetric downside risk, which is the difference between a big move and a good entry.
Three approaches to trading channel midlines and what each one assumes about the market
Every trader facing a stock near resistance is choosing between three philosophies, whether they name them or not. They range from most conservative to most aggressive, and each assumes something different about the market.
The conservative approach, used by Dosek and Verified Investing, treats midlines and resistance confluences as profit-taking zones. Fresh longs wait for pullbacks to stacked support clusters rather than chasing strength.
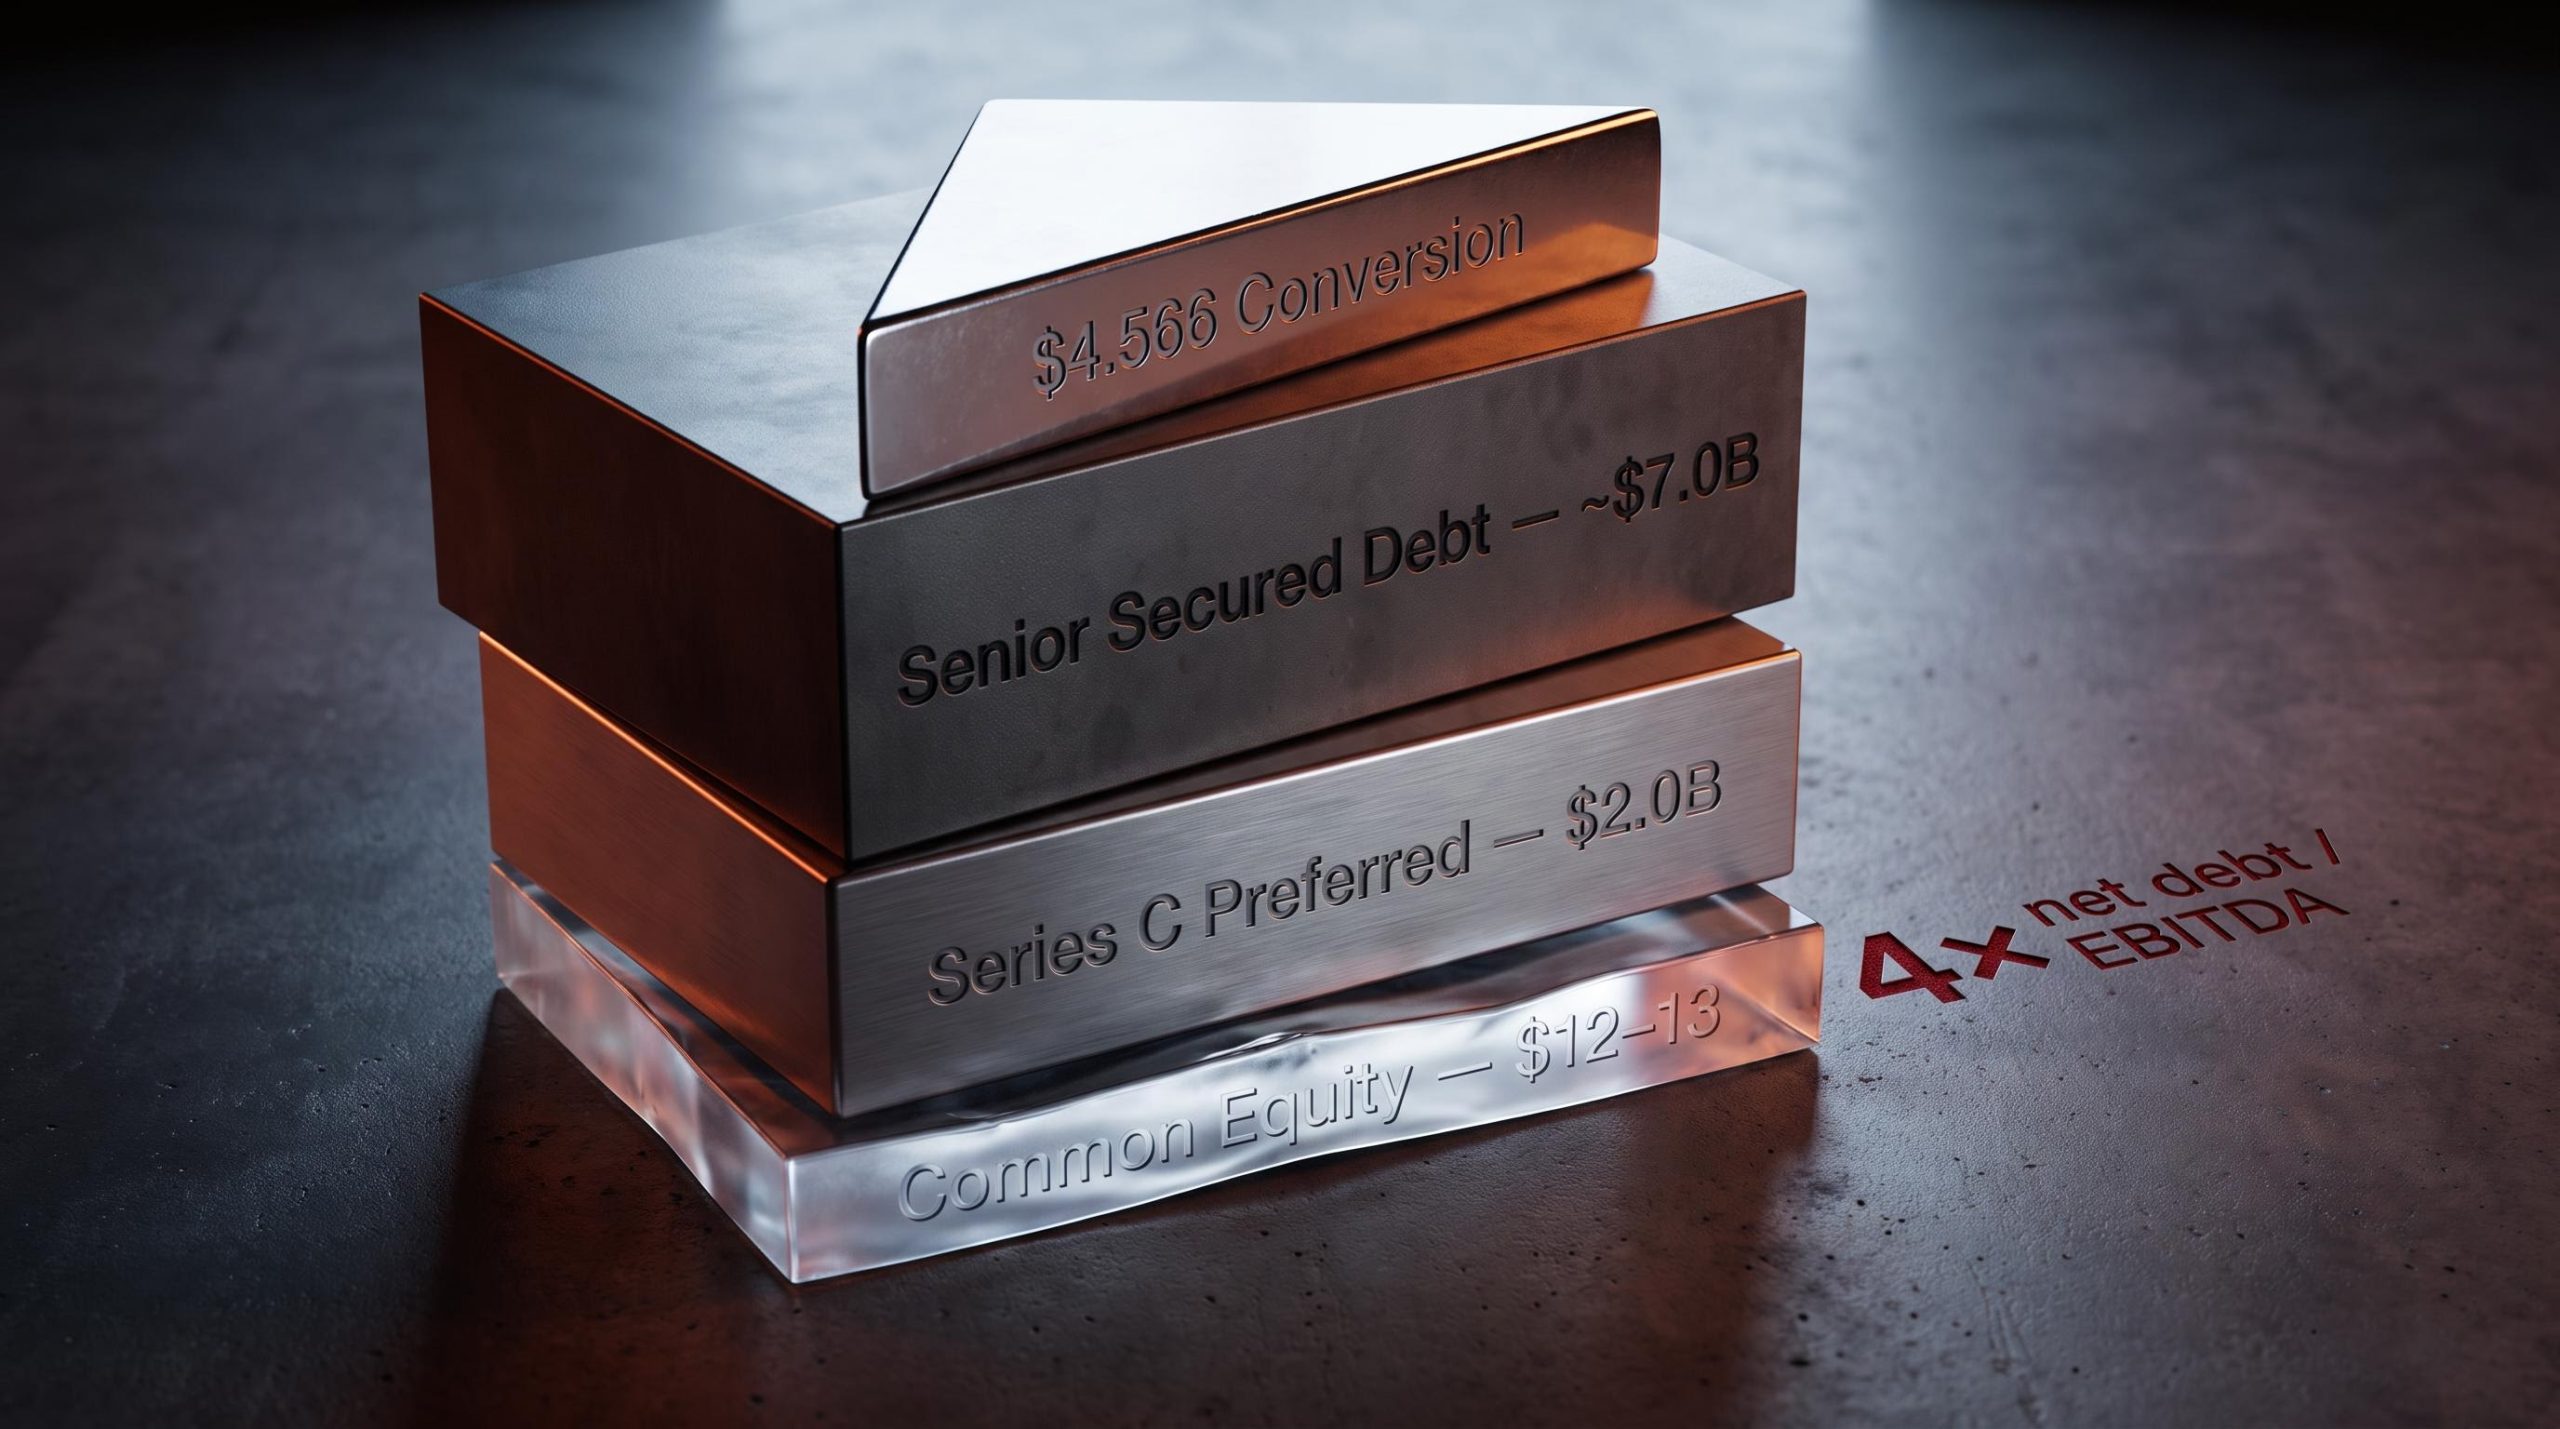
The scale of that patience is visible in Meta. Dosek’s preferred Meta entry was the 38.2% Fibonacci retracement at $687.17, roughly $100 below where the stock closed in late September 2025.
The momentum approach accepts more risk for the chance of catching a fresh breakout. MarketBeat on 27 May 2025 described Snowflake and Gap, both up more than 65% since April 2025 with RSIs in the mid-70s, as valid buys despite overbought readings because volume, fundamentals, and structural narratives supported the moves.
The lesson there is that a high RSI does not guarantee reversal when the underlying story holds, though the risk of abrupt pullbacks stays elevated.
The hybrid approach, which Dosek applied to ALAB, ARM, and MSFT, respects channel boundaries while still trading breakouts. It requires a confirmed second close above the level before committing.
| Approach | Entry Logic | Risk Assumed | Current Example |
|---|---|---|---|
| Conservative | Wait for pullback to stacked support | Missed entries | META at $687.17 |
| Momentum | Buy confirmed breakout despite high RSI | Short-term drawdowns | SNOW, GPS (May 2025) |
| Hybrid | Trade breakout after confirmed second close | Moderate, rule-based | ALAB, ARM, MSFT |
The hybrid method runs on a simple sequence you can apply repeatedly:
- Price posts a first close above the level.
- A confirmed second close follows, validating the break.
- The position is initiated against the relevant target.
Choosing your approach before a setup develops is the practical takeaway. The confirmation-based method gives you a repeatable rule set that avoids both the impatience of chasing and the missed-opportunity risk of waiting for deep pullbacks that may never come. The alternative is the Meta scenario, where a topping pattern breaking down projects a full measured-move target of $656.45.
What the next move depends on across all five setups
The five stocks looked similar on a weekly performance screen, but they were not the same decision. The post-quarter-end period was the first meaningful test of whether the late September rally had real demand behind it or was simply an institutional quarter-close distortion.
That distortion was not hypothetical. Dosek’s 29 September 2025 observation was that quarter-end flows were driving “intense individual stock volatility” and “critical technical patterns in major tech names,” which raises the odds of a reversal once the buying subsides.
None of the five had delivered unambiguous breakout confirmation. That made this a watching-not-chasing moment, and the summary below shows why the positioning decision differed stock by stock.
The Investor.gov investment risk framework published by the SEC defines volatility risk as a central consideration when evaluating positions near technical resistance, reinforcing why asymmetric downside exposure near topping patterns carries greater consequence than headline momentum suggests.
| Stock | RSI Condition | Pattern Signal | Confirmation Trigger | Risk (Conservative View) |
|---|---|---|---|---|
| META | Above 70 | Head-and-shoulders neckline break | Break below neckline low | High |
| MSFT | Reset completed | Continuation setup | Close above $517.78 | Lower |
| ALAB | 66.01 | Pivot test | Close above 4 Aug pivot | Lower |
| ARM | Not published | Midline oscillation | Close above $311.50-$312.50 | Moderate |
| CRDO | Not overbought | Breakdown-and-retest surge | Consolidation expected | Elevated |
The asymmetry that matters Stocks with RSI below 70 (ALAB at 66.01) and completed RSI resets (MSFT) carry meaningfully different forward-looking risk than those at triple-top resistance with overbought readings (META), where downside targets run to $721 and $656.45.
The five did not deserve the same decision. Meta’s structural warning argued for patience or an outright pass, while ALAB’s RSI cushion and Microsoft’s completed reset made them the more defensible entries once their triggers hit. Position sizing and patience, not urgency, are the tools for this environment.
This article is for informational purposes only and should not be considered financial advice. Investors should conduct their own research and consult with financial professionals before making investment decisions.
Past performance does not guarantee future results. The technical levels, targets, and analyst views described here are speculative and subject to change based on market developments.