
#
Two of the most widely held stocks on the ASX are both losing money for their shareholders in 2026, both paying dividends fully franked, and yet one trades at roughly 37% more per dollar of earnings than the other. Commonwealth Bank of Australia (CBA) sits at 23.48 times earnings. Westpac Banking Corporation (WBC) sits at 17.22 times. Same country, same big-four club, same franking benefit, wildly different price tags.
That gap matters right now because neither stock is delivering the capital growth story that once justified paying up. As of 21 September 2026, CBA is down 1.6% year-to-date and Westpac is down 7.5%, and institutional names including Morgan Stanley and Wilson Asset Management hold underweight positions across both. The rate environment is squeezing bank profitability, and income investors are left with a genuinely uncomfortable question: are you paying for quality, or overpaying for comfort?
Here is the framework for weighing that decision yourself, covering where the two banks stand, why their earnings tell different stories, what franking actually does to your income, and where the real valuation risk sits.
Where the two banks stand today
Start with the raw numbers, because the numbers create the tension before anyone interprets them.
| Metric | CBA | Westpac |
|---|---|---|
| Market cap | $254.92bn | $119.40bn |
| Share price | $152.99 | $34.93 |
| P/E ratio | 23.48 | 17.22 |
| Dividend yield | 3.30% (100% franked) | 4.41% (100% franked) |
| EPS | $6.517 | $2.029 |
| YTD return | -1.6% | -7.5% |
A few points sit outside the table but shape how you read it:
- Both banks carry Morningstar’s wide-moat designation, meaning both are judged to hold durable competitive advantages that peers cannot easily erode.
- Both are blue-chip ASX anchors paying fully franked dividends, so the tax treatment of the income is identical.
- Both are in negative territory for 2026, so neither is currently offering the capital growth that once justified a premium price.
The similarity, in other words, largely ends at the franking credit. Where it breaks apart is that 6.26-point gap in the price-to-earnings ratio, the measure of how much investors pay for each dollar of a company’s annual profit.
That gap is not a quirk of the data. It is the market’s entire argument for CBA compressed into a single number. The moment you buy either stock, you are taking a side on that argument: either CBA’s franchise strength is worth paying nearly a quarter more per dollar of earnings, or it is not. Everything that follows is about deciding which side has the better evidence.
Bank stock valuation methods beyond the P/E ratio, including dividend discount models and price-to-book analysis, each produce materially different conclusions depending on how credit cycle risk and APRA capital requirements are treated, which is why a 23-times earnings multiple for one bank and a 17-times multiple for another can each be either rational or irrational depending on the inputs.
When big ASX news breaks, our subscribers know first
Earnings tell two different stories
If the valuation gap looks like market irrationality, the earnings figures suggest otherwise. The two banks are on genuinely different trajectories, and the prices reflect that.
Here is the core contrast before the analysis:
- CBA FY26 full-year profit: $11 billion, up 7%, a record
- CBA FY25 cash earnings: $10.25 billion, also a record at the time
- CBA FY26 dividend: $5.05 per share fully franked, up from $4.85 in FY25
- Westpac 1H26 net profit: $3,414 million, down 5%
- Westpac Q3 FY26 underlying profit: $1.8 billion, up 2% on the first-half quarterly average
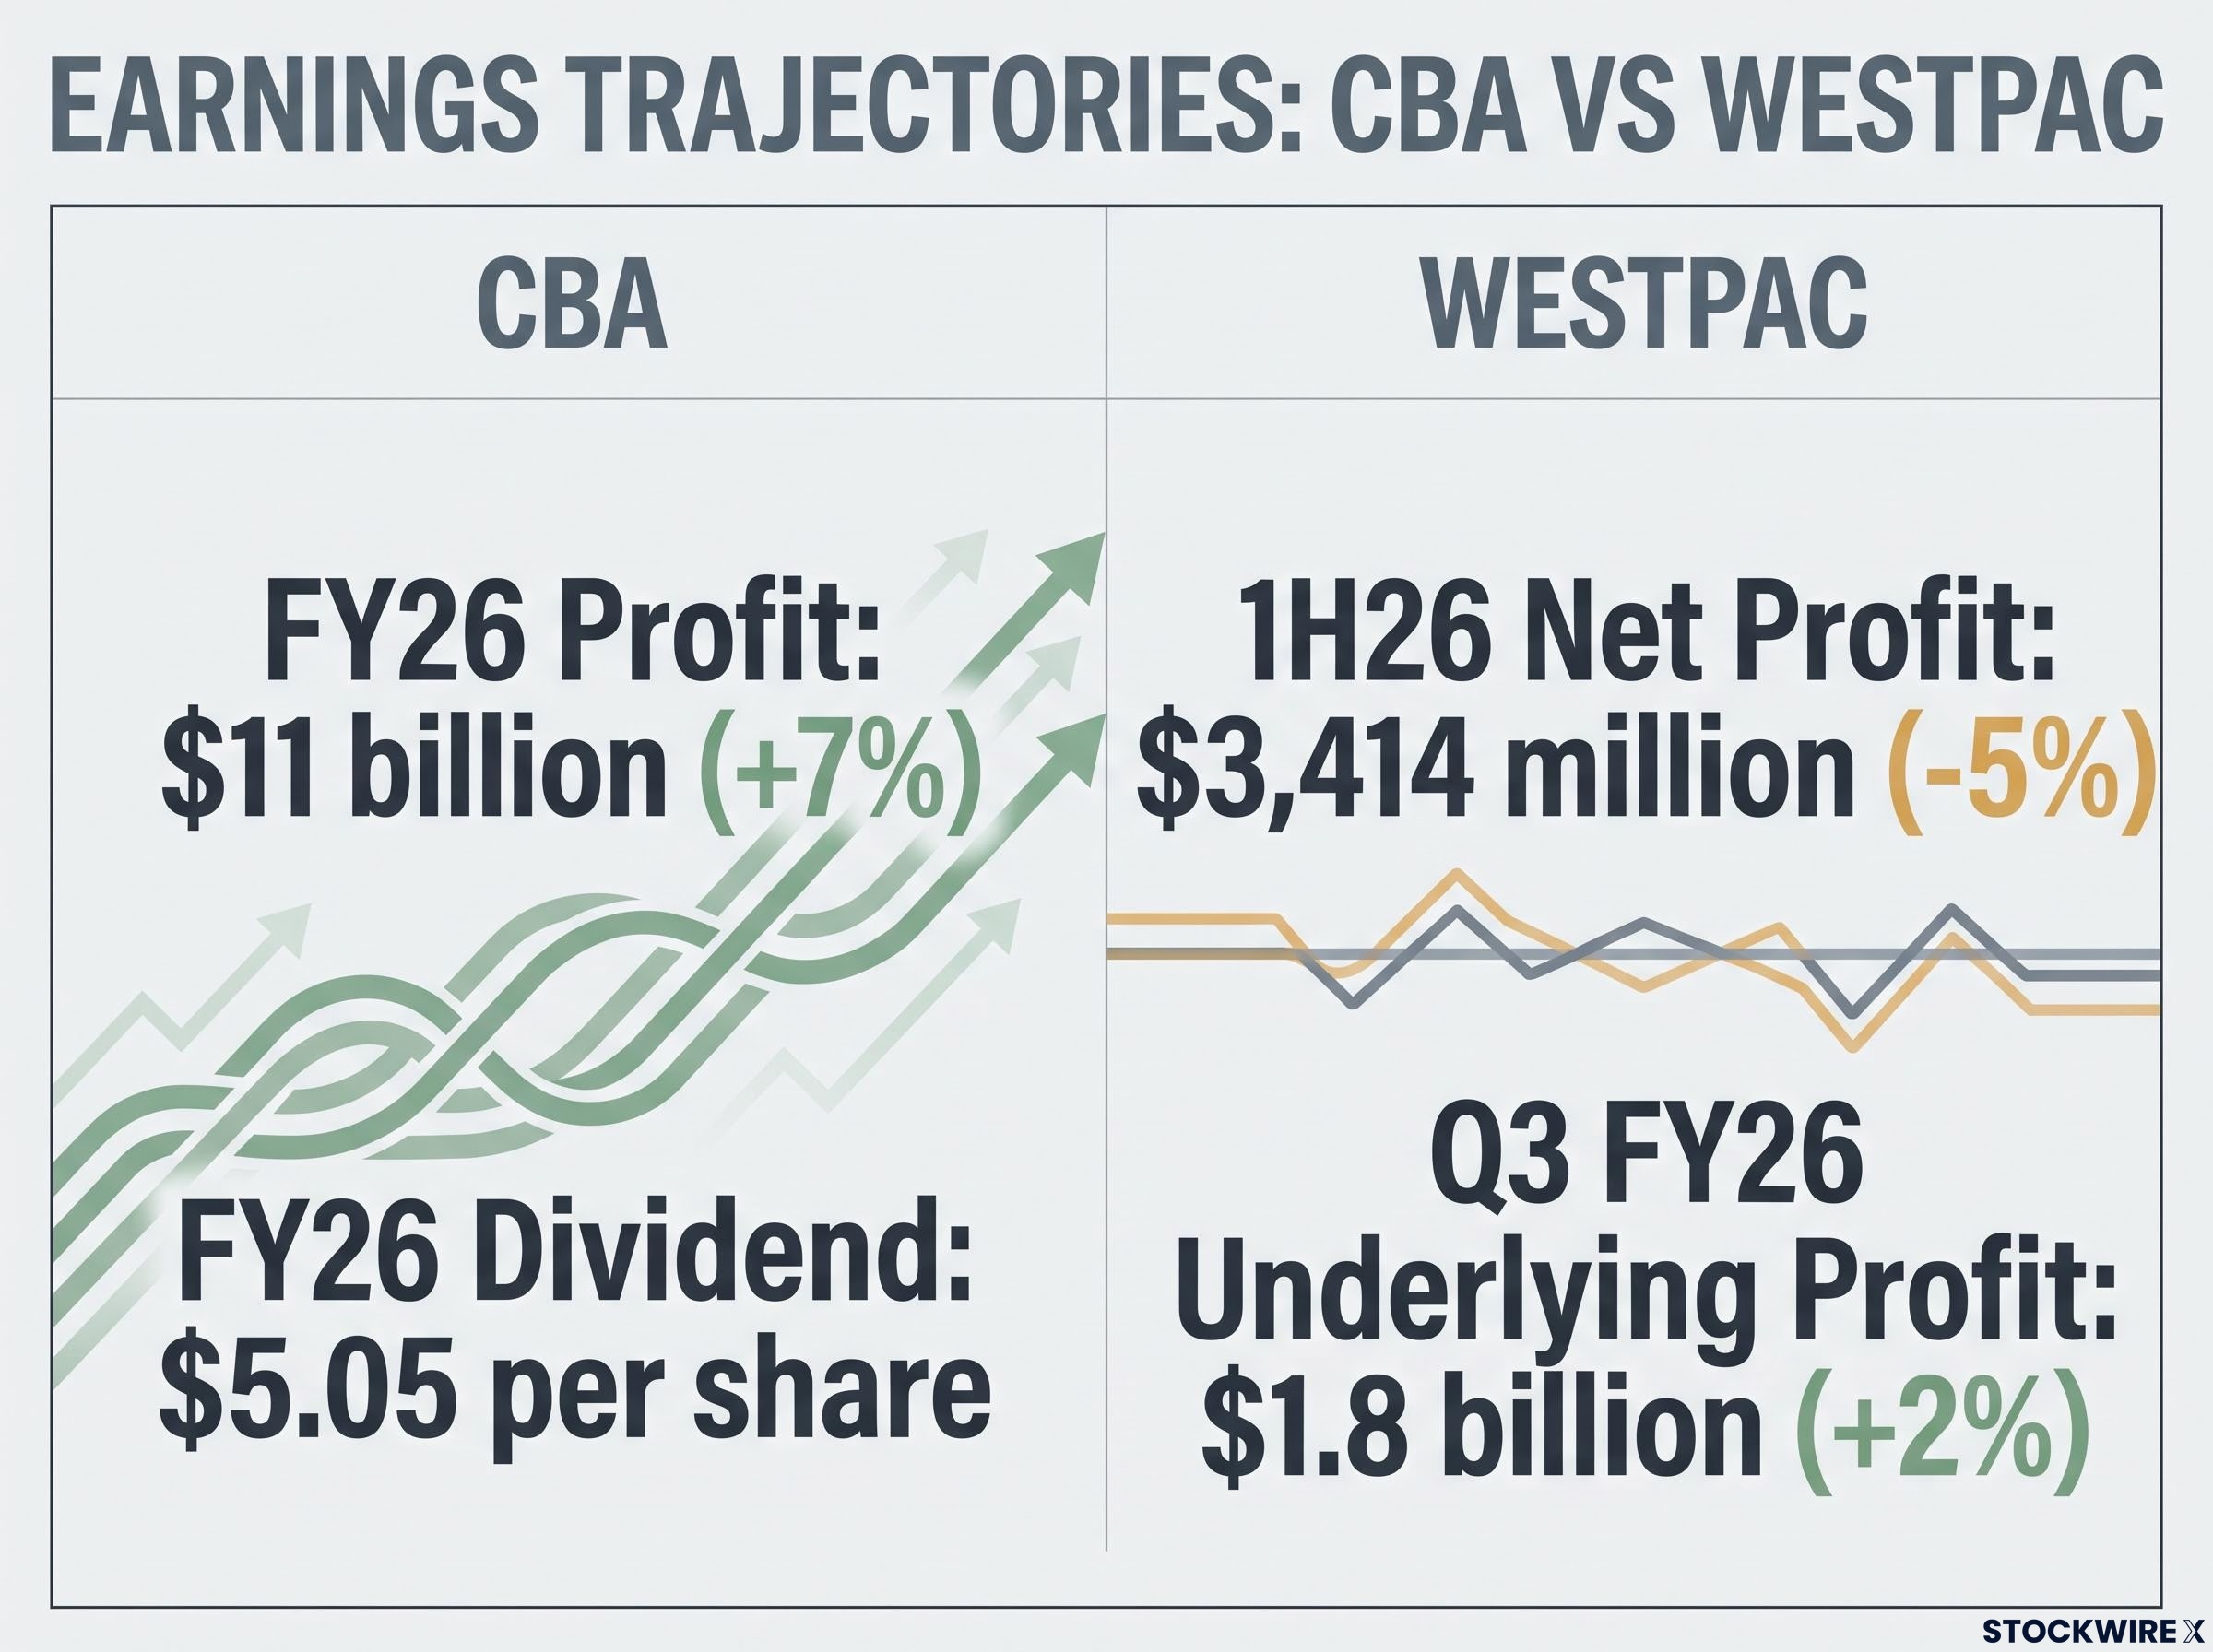
CBA’s story is one of operational momentum that is hard to dismiss. Profit climbed 7% to a record $11 billion in FY26, following a record $10.25 billion the year before, and the dividend lifted from $4.85 to $5.05 per share, landing near the top of the bank’s 70-80% payout policy range. That is a track record of growth funding a rising, fully franked income stream.
Westpac’s story runs the other way. Its 1H26 net profit fell 5% to $3,414 million, driven by lower operating income and higher credit impairment charges, the money a bank sets aside to cover loans it expects may not be repaid. Those impairment charges are the mechanic that matters most here.
Higher impairments are not a one-period accounting quirk to explain away. They are an early signal of credit-quality stress, and Westpac is wearing that stress more visibly than CBA right now. If you are drawn to Westpac’s higher yield, you are implicitly accepting that risk alongside the income.
Does Westpac’s Q3 recovery change the picture?
There is a tentative counter-signal. Westpac’s Q3 FY26 underlying profit came in at $1.8 billion, up 2% on the first-half quarterly average, which points to some stabilisation after the interim decline.
The problem is that the analysts watching most closely did not treat it as a turning point. Morningstar retained its $30 fair value estimate for Westpac after the Q3 update, declining to revise upward.
Morningstar’s read, following its August 2026 review, was that the Q3 improvement was not sufficient to materially alter its Westpac valuation.
Read that as genuine but insufficient. A quarter of stabilisation is not a reversal, and until the improvement shows up across a full-year result, the earnings gap between the two banks remains the more durable fact.
What franking credits actually do for your income
Before you compare the two banks on income, you have to compare them on a like-for-like basis, and the headline yields do not give you that. This is where most income investors make the wrong comparison.
A franking credit is a tax credit attached to a dividend, reflecting company tax the business has already paid on its profits. For an Australian resident investor, a fully franked dividend delivers not just the cash payment but that attached credit, which lifts the effective income return above the headline yield. The technical term for the higher figure is the grossed-up yield.
The grossed-up yield calculation follows a fixed formula: the cash dividend multiplied by 30, divided by 70, reflecting the 30% corporate tax already paid at the company level, and for an SMSF in pension phase that credit converts directly into an ATO cash refund rather than merely an offset.
Westpac spells this out directly in its investor materials, which makes it the cleanest worked example.
According to Westpac’s FY25 investor pack, the cash dividend yield of 3.94% grossed up to 5.63% once franking credits were included.
The same logic applies to CBA’s 3.30% headline yield. Because CBA’s dividends are also 100% franked, eligible investors receive a comparable uplift, though the bank does not quote the grossed-up figure as explicitly.
The uplift is not evenly valuable to everyone. It matters most for:
- Self-managed superannuation funds (SMSFs), which are taxed at just 15% and can often use surplus franking credits as a refund.
- Individuals in the top 45% marginal tax bracket, where the credit offsets a larger tax bill.
- Any investor able to apply the credit against other tax liabilities.
| Bank | Headline yield | Grossed-up yield (approx.) | Dividend per share | Payout ratio target |
|---|---|---|---|---|
| CBA | 3.30% | Comparable franking uplift | $5.05 (FY26) | 70-80% |
| Westpac | 4.41% | ~5.5-5.63% | $1.53 (FY25) | 65-75% |
Once you gross Westpac up to roughly 5.5-5.63%, the income advantage over CBA is not a footnote. It is a structurally higher effective return for any Australian investor who can fully use those franking credits, and that belongs at the centre of the decision, not the margin of it.
Valuation risk and what analysts are actually saying
The income case for Westpac is real. The valuation case complicates it, because both stocks trade above what independent analysts think they are worth, and one of them is stretched to a degree that has few recent parallels.
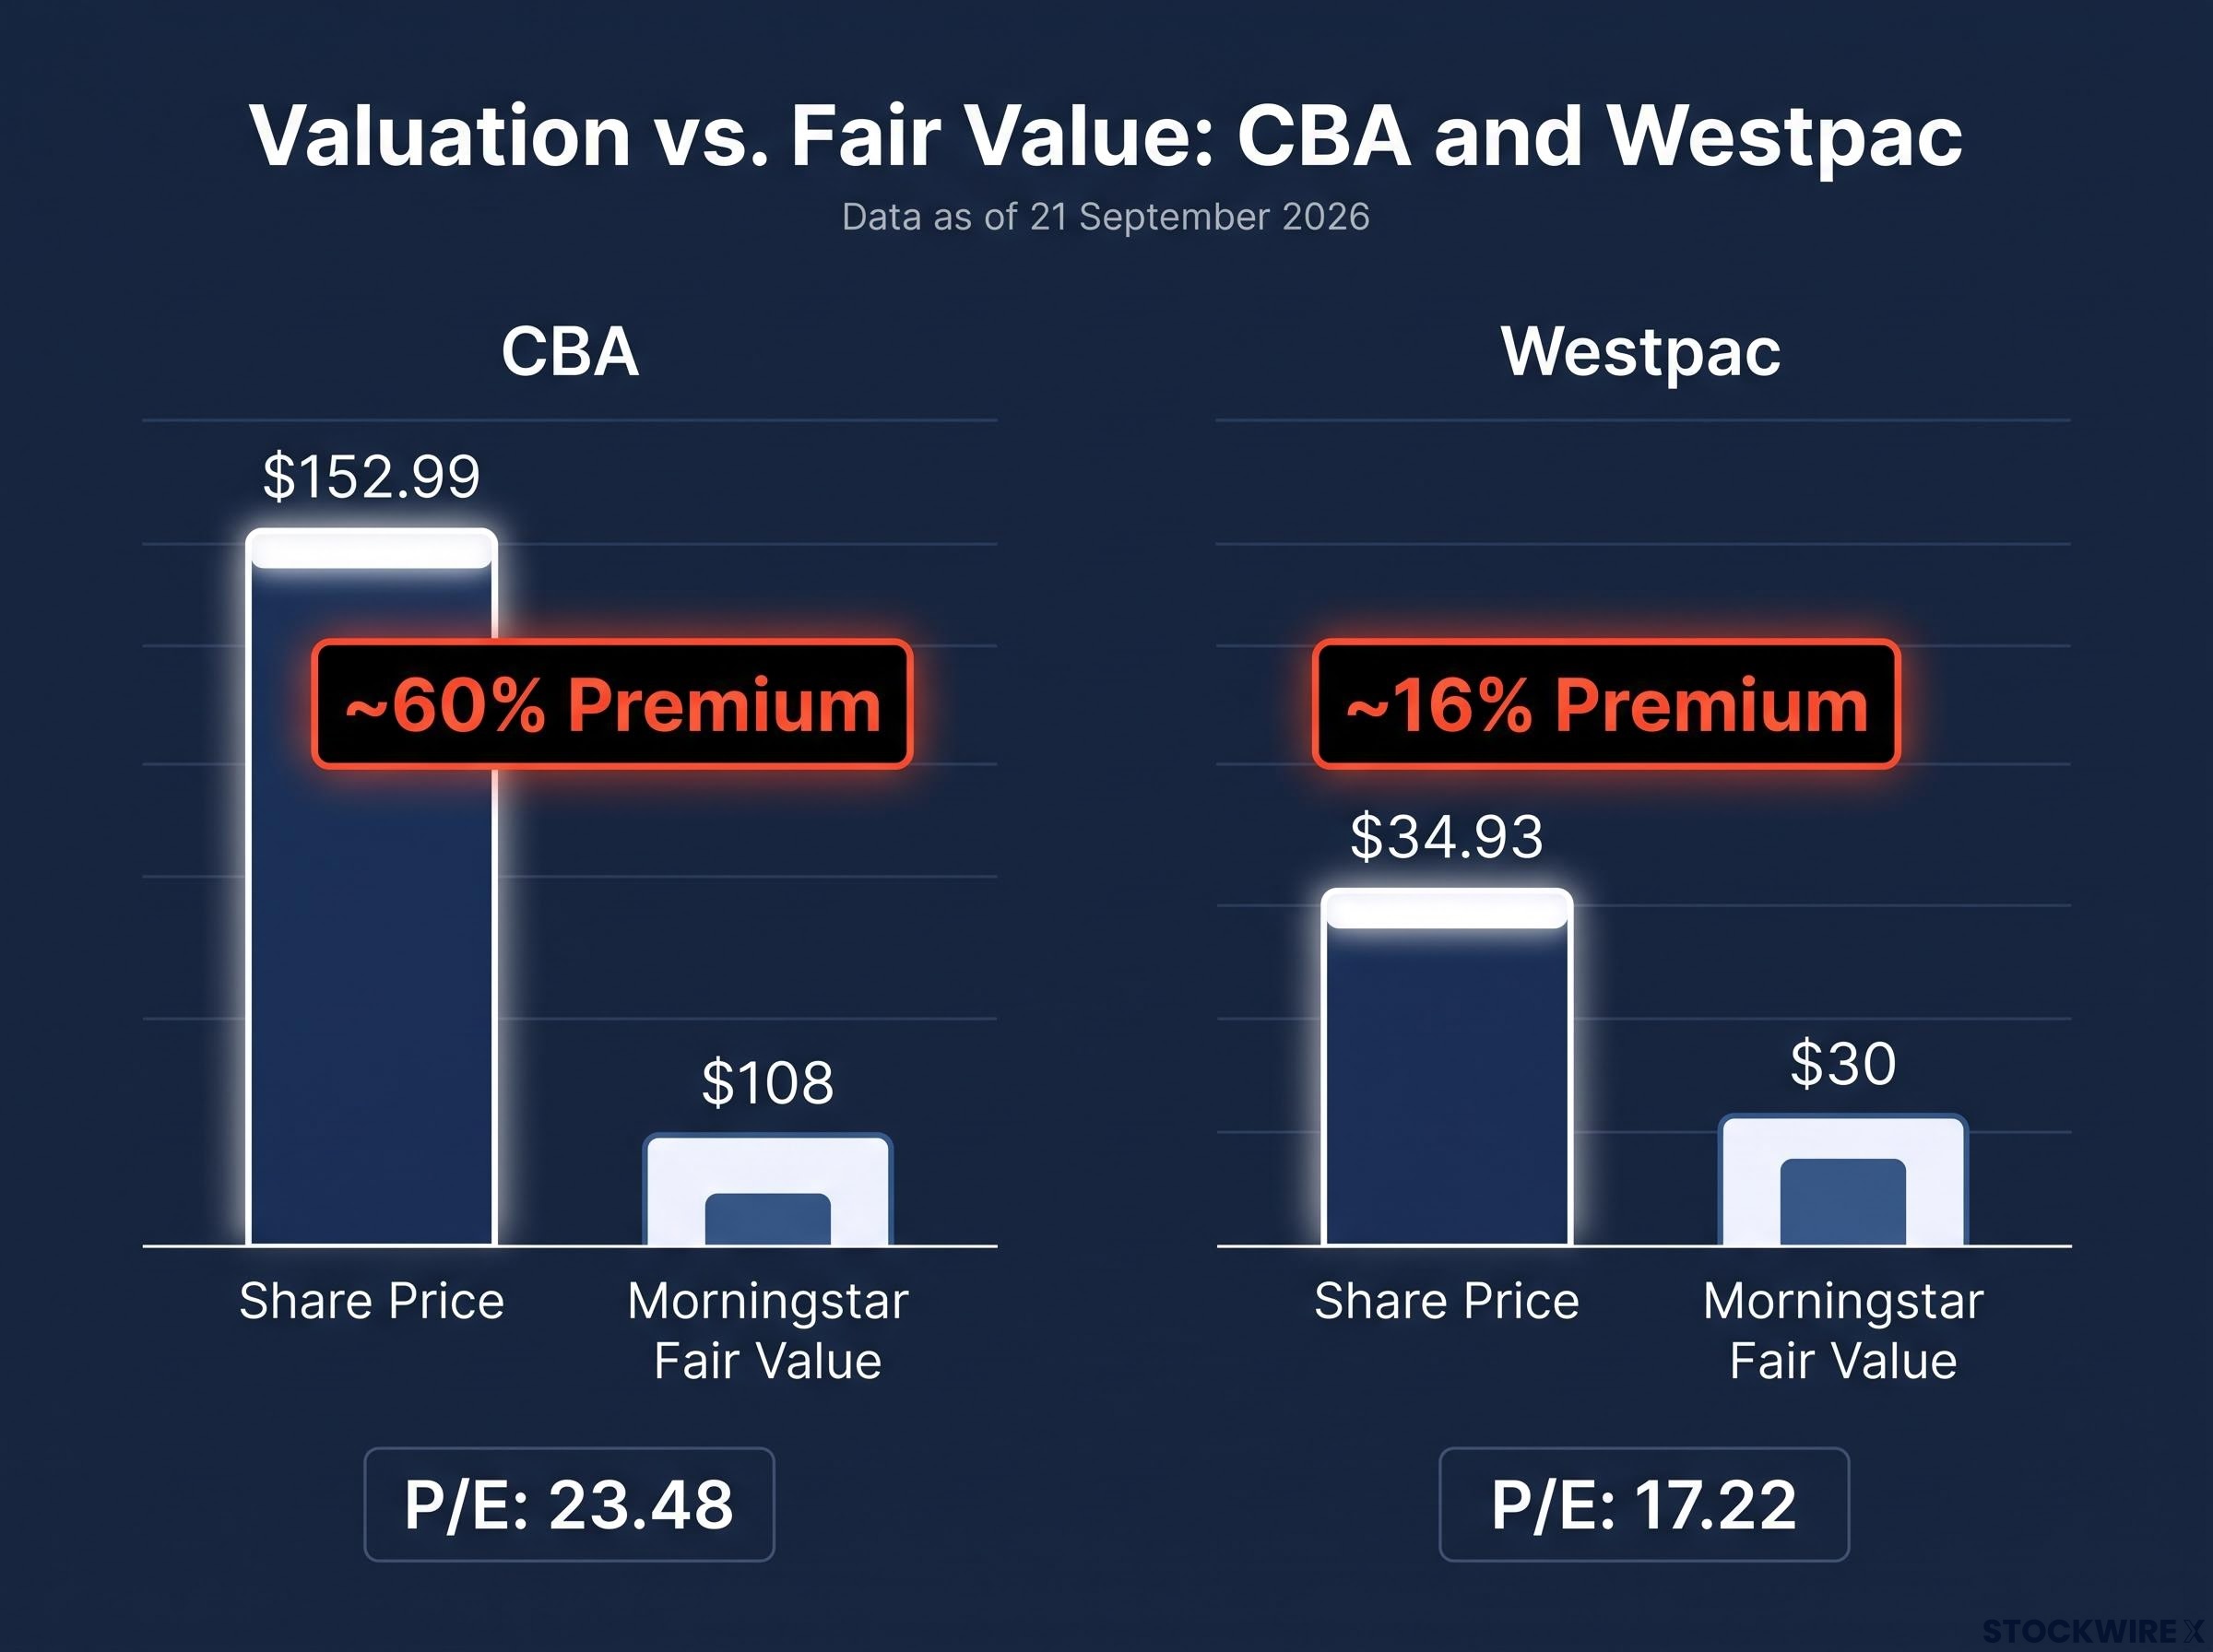
Morningstar puts CBA’s fair value at $108 per share. At roughly $153, the stock trades around 60% above that estimate. Westpac’s fair value sits at $30, and at $34.93 the premium is closer to 16%. Both are expensive by this measure; only one is dramatically so.
| Analyst / firm | CBA view | Westpac view |
|---|---|---|
| Morningstar | Fair value $108; materially overvalued | Fair value $30; ~16% premium |
| Morgan Stanley | Underweight | Underweight |
| Wilson Asset Management | Underweight | Underweight |
| CommSec (FY27 P/E) | ~24 times | ~16 times |
Three institutional voices sit underweight on both stocks, but for different reasons worth separating. Morningstar’s case is valuation: it labels CBA “wide-moat” yet concludes the shares are materially overvalued. Morgan Stanley’s concern, cited in The Nightly in September 2026, is macro, specifically the threat that RBA rate movements and a softening housing market pose to mortgage profitability.
The ASX bank sector valuation picture is wider than the CBA-Westpac comparison alone: the sector’s weighted average price-to-fair-value sat around 1.14 entering August results, and UBS named Westpac and NAB as its preferred relative-value plays while explicitly flagging CBA as least preferred within the group.
Wilson Asset Management’s underweight rests on three distinct sector risks:
- Slower credit growth as loan-book expansion cools
- Rising competition compressing lending margins
- Signs of deterioration in loan-book quality
Morningstar’s language on CBA is the sharpest of the lot.
“Fundamentals no longer matter to the share price,” Morningstar concluded in its August 2026 assessment of CBA.
That is not an abstract observation. CBA’s 60% premium to fair value means anyone buying today is pricing in a best-case outcome, leaving little room for the earnings miss, rate shock, or credit deterioration that these same institutions are already flagging. There is precedent for how that unwinds: in August 2025, per Reuters, investors sold CBA even after it posted record $10.25 billion earnings and a record $4.85 dividend, a reminder that a stretched premium can compress on strong results alone.
The Motley Fool’s September 2026 assessment lands on CBA anyway, citing its stronger earnings trajectory and greater price resilience. That is a defensible call, but it is a quality-at-a-premium argument, and it asks you to accept a lower yield and a large gap to fair value as the cost of that quality.
Choosing the bank that fits your income strategy
There is no verdict handed down here, because the right answer depends on who you are as an investor. The choice sorts into two profiles.
CBA suits you if:
- You prioritise earnings consistency and price resilience over headline yield
- You are comfortable holding a wide-moat franchise through a stretched multiple
- Your -1.6% YTD, 3.30% yield, 23.48 P/E profile reads as stability, not overpricing
Westpac suits you if:
- You are a yield-maximiser or value-oriented investor
- You can tolerate near-term earnings volatility for a higher grossed-up income stream
- Its -7.5% YTD, 4.41% yield (roughly 5.5% grossed up), 17.22 P/E reads as value, not a trap
Neither is risk-free. Both trade above Morningstar fair value, and both carry underweight ratings from Morgan Stanley and Wilson Asset Management, so neither qualifies as a defensive hold at current prices. Buy Westpac for yield without accounting for the 5% profit decline and rising impairments, and you are taking more risk than the headline suggests. Buy CBA for quality without accounting for a 60% premium to fair value, and you are paying for comfort that could prove expensive.
Watch two variables before the next dividend cycle: Westpac’s FY26 full-year results, which will confirm whether Q3’s stabilisation holds, and any RBA rate decision, plus the credit impairment trend in the next half-year reporting. These are the levers most likely to shift the relative calculus between the two.
For investors wanting to stress-test their income strategy against more severe scenarios, our deep-dive into cyclical versus systemic bank risk examines how to distinguish a drawdown that historically rewarded accumulation from the type of systemic event that cut dividends and took nearly 11 years to recover.
This article is for informational purposes only and should not be considered financial advice. Investors should conduct their own research and consult with financial professionals before making investment decisions. Past performance does not guarantee future results, and financial projections are subject to market conditions and various risk factors.