
Why DBI’s 8.5% Distribution Rise Was Locked in Before the Year Started
8 mins ago


Commonwealth Bank of Australia shares are trading at approximately $163 in May 2026. Two independent valuation models, a price-to-earnings comparison and a Dividend Discount Model, put the stock’s estimated intrinsic value between $98 and $144. That gap, between $19 and $65 depending on the model and its inputs, is the question every current or prospective CBA shareholder needs to sit with. As Australia’s most widely held stock and a cornerstone of income portfolios built around franked dividends, CBA’s valuation is more than an academic exercise. Brokers including Morgan Stanley, UBS, Citi, and Morningstar have all flagged the stock as overvalued or carrying downside risk across 2025 and 2026. This article applies two quantitative valuation frameworks to CBA using current data, showing exactly how each model works, what inputs it requires, and what the outputs imply about the current share price.
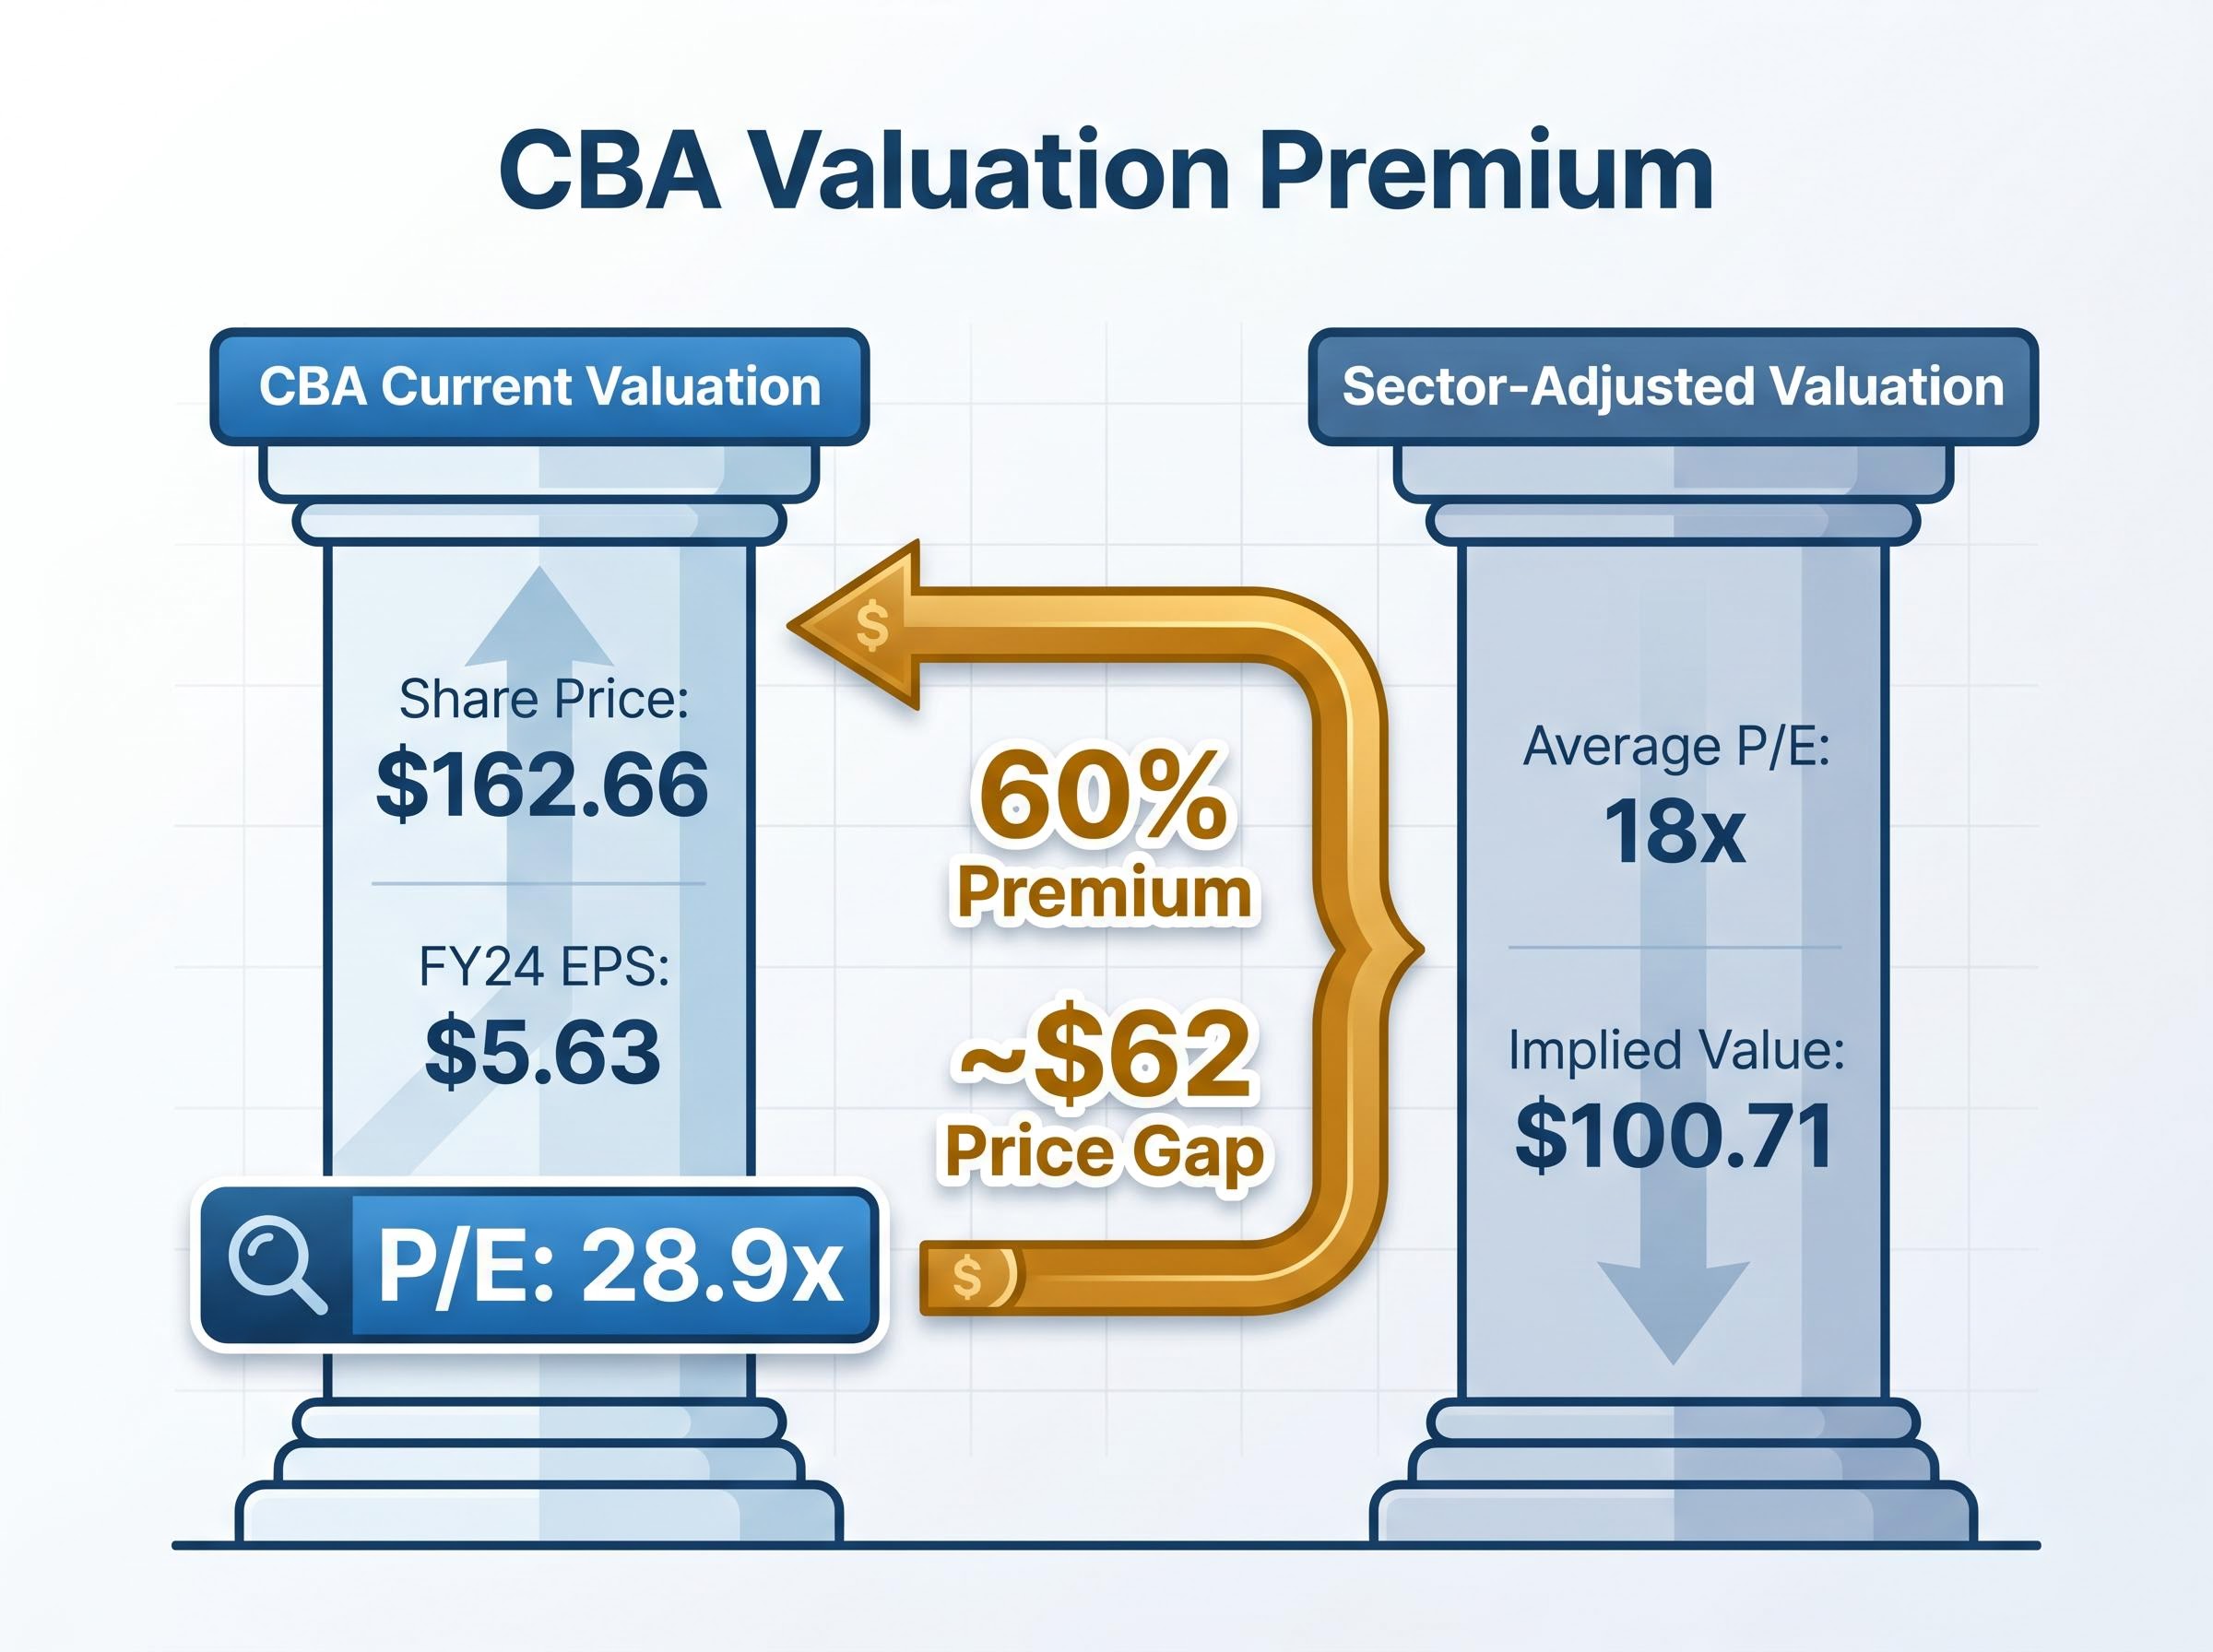
Start with the arithmetic. The price-to-earnings ratio divides the share price by earnings per share. CBA’s share price at the time of this analysis sits at $162.66. Its FY24 earnings per share came in at $5.63. Divide one by the other and the trailing P/E ratio is 28.9x.
That number means little in isolation. It needs a benchmark. The banking sector average P/E sits at approximately 18x. CBA trades at a 60% premium to that average.
The sector-comparable approach asks a simple question: if CBA’s earnings multiple contracted to match the broader banking sector, what would the share price be? The calculation is $5.63 multiplied by 18, which produces a sector-adjusted valuation of $100.71 per share.
The sector-average PE method applied to NAB’s FY24 EPS at an 18x multiple produces a sector-adjusted implied value roughly 8% above NAB’s observed trading price, a result that sits in sharp contrast to the same method applied to CBA, where the 60% premium to sector average leaves a $62 gap between the calculated value and the current price.
| Input | Value | Source |
|---|---|---|
| CBA share price | $162.66 | ASX, May 2026 |
| FY24 earnings per share | $5.63 | CBA FY24 results |
| CBA P/E ratio | 28.9x | Calculated |
| Sector average P/E | 18x | Sector data |
| Sector-adjusted value | $100.71 | Calculated |
Key figure: A sector-adjusted valuation of $100.71 per share implies CBA’s current price of $162.66 carries a premium of approximately $62 over what the banking sector’s average earnings multiple would justify.
Earnings per share represents the portion of a company’s profit allocated to each outstanding share. It is the number a company reports after dividing its total net profit by the number of shares on issue. The P/E ratio takes that figure and measures how much the market is willing to pay for each dollar of those earnings.
For a retail investor holding or considering CBA, the calculation requires three steps:
The P/E approach works well for mature, profitable businesses like banks because they generate consistent earnings year after year. It cannot, however, be applied to pre-profit companies where earnings per share is negative or negligible.
A low P/E ratio does not automatically signal a bargain. It can also indicate the market expects earnings to deteriorate. Context always matters.
CBA operates within an oligopolistic domestic banking market. Its brand strength, digital infrastructure, and market share justify some multiple premium over smaller peers. Morningstar’s Nathan Zaia has acknowledged that CBA’s franchise quality warrants a premium, but not one as large as the current market price implies. The question is not whether a premium is deserved, but whether a 60% premium is proportionate.
The Dividend Discount Model takes a different approach. Rather than measuring what the market currently pays for earnings, it estimates what a share is worth based on the future dividends it is expected to deliver, discounted back to present value. Two inputs drive the output: the assumed dividend growth rate and the discount (risk) rate.
The dividend discount model treats a share’s intrinsic value as the sum of all future dividend payments discounted back to today, meaning any change in the assumed growth rate or risk rate cascades directly into the output price, a sensitivity that makes input discipline the most important discipline in the exercise.
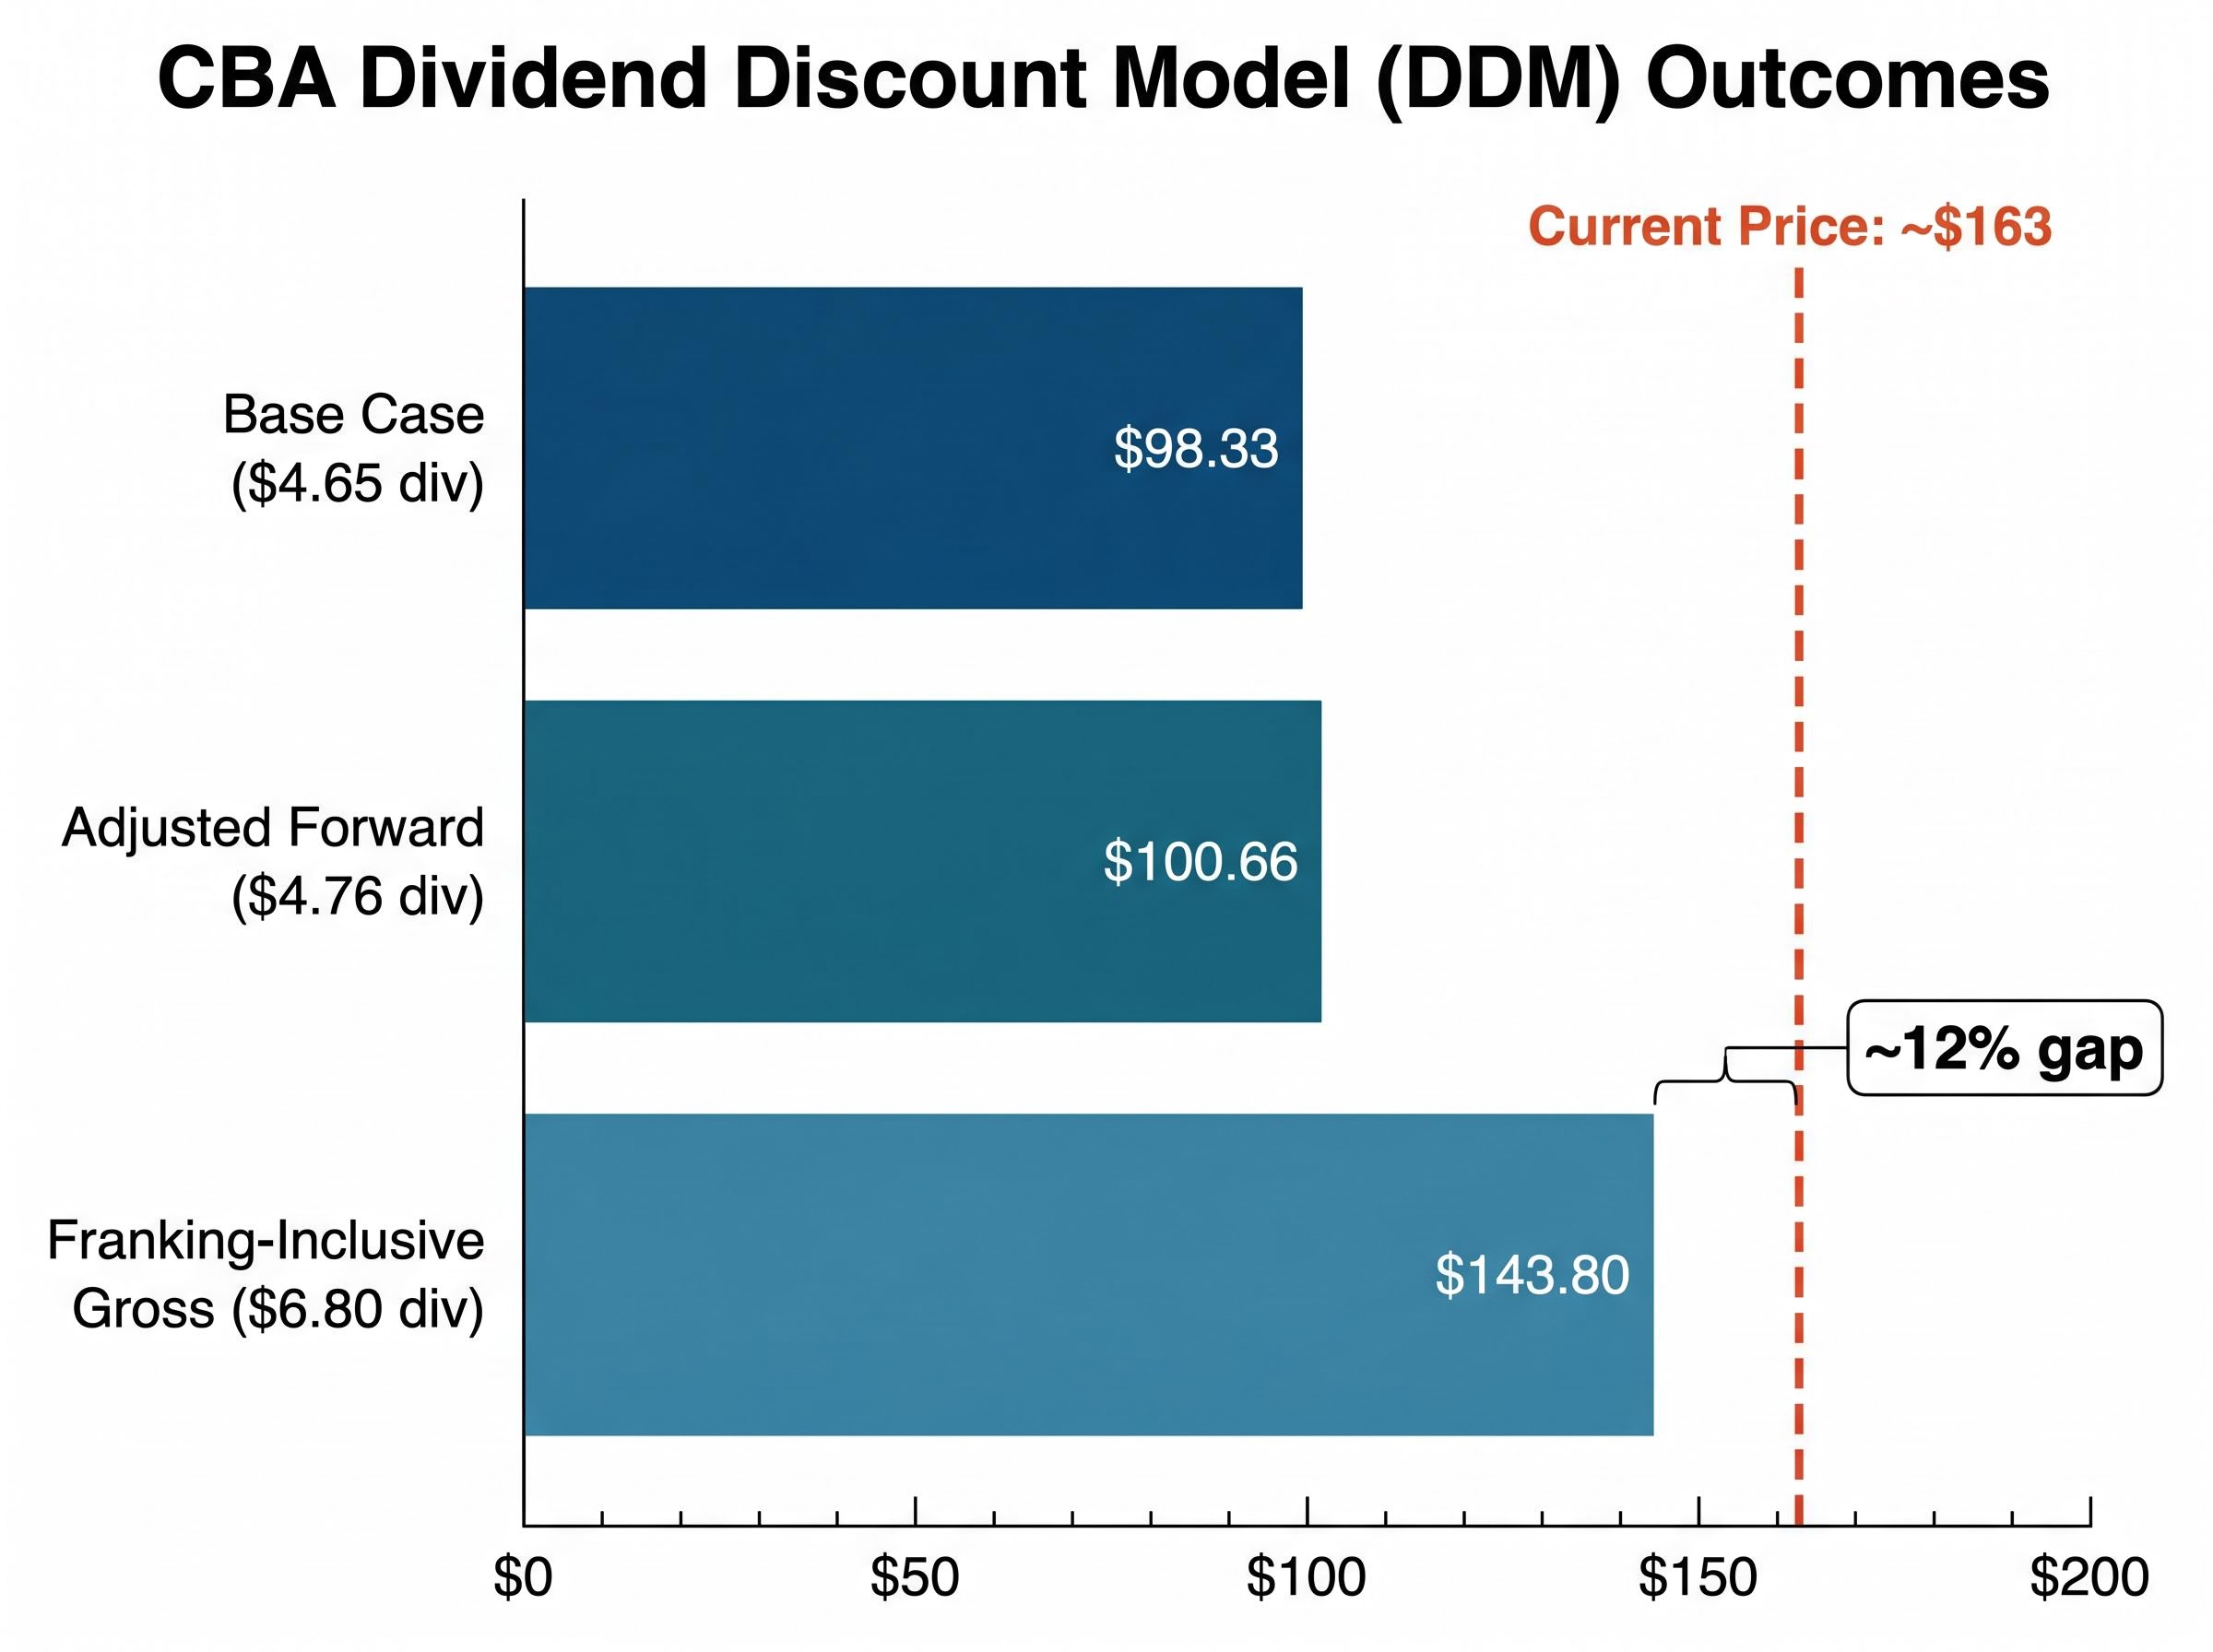
Starting with a base full-year dividend of $4.65 per share and applying a blended set of growth and discount assumptions, the DDM produces a base-case valuation of $98.33. An adjusted forward dividend estimate of $4.76 per share shifts the output to $100.66. The most favourable scenario uses the gross dividend of $6.80 per share (including franking credits), producing a DDM valuation of $143.80.
The sensitivity table below illustrates how changing the two input levers shifts the output across a wide range.
| Dividend Input | Growth Rate | Discount Rate | DDM Valuation | Notes |
|---|---|---|---|---|
| $4.65 | 2%-4% | 6%-11% | $98.33 | Base case (blended) |
| $4.76 | 2%-4% | 6%-11% | $100.66 | Adjusted forward dividend |
| $6.80 | 2%-4% | 6%-11% | $143.80 | Franking-inclusive gross |
| $4.65 | 2% | 7% | $95.20 | Conservative scenario |
| $4.65 | 4% | 6% | $238.00 | Optimistic scenario |
At 7% risk and 2% growth, the DDM produces $95.20. At 6% risk and 3% growth, the output climbs to $158.67. Push growth to 4% with a 6% discount rate and the model stretches to $238.00, a figure that illustrates how sensitive the DDM is to small input changes rather than a realistic valuation anchor.
Most favourable realistic scenario: Even the franking-inclusive DDM valuation of $143.80 sits approximately 12% below CBA’s current share price of $163.
The DDM is not a niche academic tool. For income-oriented investors, it is the natural valuation language because it values a share based on the cash it actually returns to shareholders.
Three conditions make a stock well-suited to DDM analysis:
CBA meets all three. The bank distributes a large share of cash earnings as dividends while maintaining capital buffers above APRA’s Common Equity Tier 1 (CET1) minimums. That consistency makes the DDM’s inputs more reliable for CBA than they would be for a technology company where dividends are absent or erratic.
APRA’s capital adequacy prudential standards set the minimum CET1 ratios that authorised deposit-taking institutions must maintain, establishing the regulatory floor that shapes how much of CBA’s cash earnings can be distributed as dividends versus retained as a capital buffer.
The RBA cash rate of 4.35% as of May 2026 is directly relevant here. A higher risk-free rate pushes the discount rate upward, compressing DDM-derived valuations. In a lower-rate environment, the same dividend stream would be worth more in present-value terms.
Australia’s dividend imputation system attaches a tax credit to dividends paid from corporate profits that have already been taxed at the company level. For eligible shareholders, this effectively grosses up the dividend received.
The ATO’s dividend imputation rules govern how franking credits attach to distributions paid from already-taxed corporate profits, determining the effective gross-up amount that eligible shareholders can apply as a tax offset against their assessable income.
The materiality of this input choice is substantial. Using the cash dividend of $4.65 per share produces a base DDM valuation of $98.33. Switching to the gross dividend of $6.80 (including franking credits) shifts the output to $143.80, a difference of more than $45 per share. The benefit applies differently depending on the investor’s marginal tax rate, with those on lower rates or in zero-tax pension phase receiving the greatest advantage.
Valuation models produce precise-looking numbers. The precision is only as reliable as the assumptions feeding them.
The Australian Bureau of Statistics reported an unemployment rate of 4.5% for April 2026, a figure that has edged upward over the course of the year. The ABS residential property price index for the eight capital cities showed annual increases through the December quarter 2025, though growth moderated in several markets. The RBA cash rate target remains at 4.35% as of May 2026.
These three indicators feed directly into bank earnings. Rising unemployment increases loan loss provisions. Moderating property prices slow mortgage credit growth. A 4.35% cash rate compresses net interest margins while simultaneously pushing up the discount rates used in valuation models. CBA’s 1H FY25 results commentary flagged ongoing margin pressure and mortgage competition, conditions that weigh on the earnings base underpinning both EPS and dividend inputs.
The broker consensus reflects these conditions.
| Broker / Analyst | Stance | Key Reason Cited |
|---|---|---|
| Morgan Stanley | Underweight | Multiple too high versus peers |
| UBS | Most expensive major | Downside implied from valuation |
| Macquarie | De-rating risk | Credit normalisation concerns |
| Citi | Fully valued to overvalued | Margin pressure, limited catalysts |
| Morningstar (Nathan Zaia) | 2-star overvalued | Premium exceeds franchise justification |
UBS has characterised CBA as “the most expensive major” Australian bank, with its target price implying downside from prevailing levels.
Both models converge on the same conclusion from different directions. The P/E approach values CBA at $100.71 on a sector-average multiple. The DDM range spans $98.33 to $143.80 under realistic assumptions. The current price of approximately $163 sits at or above the upper bound of both frameworks.
Multi-method valuation matters here because neither the P/E approach nor the DDM is complete on its own: the P/E is backward-looking and anchored to a sector average that may itself be mispriced, while the DDM is exquisitely sensitive to small changes in the growth and discount rate assumptions that no analyst can determine with certainty.
That does not mean the market is wrong. CBA’s oligopolistic position in Australian banking, its brand strength, digital infrastructure investment, and consistent earnings record in a stable regulatory system all provide legitimate reasons for a premium. Markets pay more for perceived quality, and CBA has earned that perception over decades.
The investor-relevant question is what a buyer at $163 needs to believe. To justify the current price, an investor would need conviction in:
CBA does not issue formal EPS guidance, meaning DDM and P/E inputs rely on historical data and analyst estimates. The Global Financial Crisis remains a reminder that even well-regarded banks carry tail risk. Both models suggest investors buying at $163 are paying for optimism about future performance, an optimism that carries risk if macro conditions tighten the inputs.
This article is for informational purposes only and should not be considered financial advice. Investors should conduct their own research and consult with financial professionals before making investment decisions. Past performance does not guarantee future results. Financial projections are subject to market conditions and various risk factors.
Both valuation methods put CBA’s estimated intrinsic value well below $163. The P/E-derived figure of $100.71 implies a gap of $62-$65. Even the most favourable DDM scenario, using franking-inclusive gross dividends, produces $143.80, roughly $19 below the current price.
No named broker in available 2025-26 commentary carries a buy rating at current prices. The consensus is some version of caution, ranging from fully valued to outright overweight on risk.
None of this is personalised advice. Individual tax positions, investment timeframes, and risk tolerance all shape the right answer. CBA releases updated earnings data twice a year, and the RBA’s rate decisions directly shift the discount rate assumptions in these models. Both events will move the valuation calculus, and both deserve fresh analysis when they arrive.
For readers wanting to go beyond the quantitative outputs and apply a structured qualitative checklist to any bank valuation, our dedicated guide to assessing ASX bank valuations covers the five factors, income structure, property exposure, unemployment trajectory, management discipline, and arrears trends, that determine whether a PE or DDM number holds up under real-world conditions in 2026.
The core finding: Two independent valuation frameworks place CBA’s estimated intrinsic value between $98 and $144 under realistic assumptions. At $163, the gap between price and modelled value is material, and it widens further when macro headwinds are factored into the inputs.
Using CBA's FY24 earnings per share of $5.63 and the banking sector average P/E of 18x, the sector-adjusted valuation comes to $100.71 per share, roughly $62 below the May 2026 trading price of $162.66.
The DDM produces a base-case valuation of $98.33 using a $4.65 cash dividend, rising to $143.80 when franking credits are included in the gross dividend figure of $6.80, with all scenarios sitting below the current price of approximately $163.
Australia's dividend imputation system grosses up dividends by attaching tax credits for corporate tax already paid, which raises the effective dividend input in the DDM from $4.65 to $6.80 and lifts the modelled valuation from $98.33 to $143.80.
Morgan Stanley holds an underweight rating, UBS has called CBA the most expensive major Australian bank, Citi rates it fully valued to overvalued, and Morningstar's Nathan Zaia assigns a 2-star overvalued rating, with all citing the stock's elevated multiple relative to fundamentals.
A higher cash rate pushes up the discount rate used in the Dividend Discount Model, which compresses the present value of future dividends and lowers the DDM-derived valuation; the RBA rate of 4.35% as of May 2026 contributes to the gap between modelled value and current price.