Why Franking Credits Change Every NAB Dividend Discount Model
9 hrs ago

National Australia Bank trades on a trailing price-to-earnings ratio of 18.97x as of May 2026. That figure sits below Commonwealth Bank’s 26.64x and close to the other two majors. On the surface, it looks like a discount. But knowing a stock trades below a peer average and knowing whether it is genuinely cheap are two different things. The first is a data point; the second requires a method.
The PE ratio remains one of the most widely used starting points for valuing ASX bank stocks, and for good reason. The four major banks collectively represent more than one-third of the ASX 200 by market capitalisation, which means most Australian equity investors hold exposure to at least one of them. Understanding how to read and apply a sector PE multiple is a foundational skill, not an optional one.
This guide walks through the PE valuation methodology step by step, using NAB as a live worked example with May 2026 data. It shows how to derive a sector-adjusted target price, explains the macro conditions that shape which multiple to apply, and identifies where the method falls short and what other metrics to layer alongside it.
A price-to-earnings ratio represents how much investors are paying for each dollar of a company’s annual profit. The formula is straightforward:
PE ratio = Share price ÷ Annual earnings per share (EPS)
Two variants exist, and which one appears on a data provider’s screen depends on the earnings figure used:
For banks, the absolute PE number on its own carries limited information. A PE of 18x is not inherently expensive or cheap. It becomes meaningful only when compared against a peer group or sector average, because it reveals whether the market is paying more or less per dollar of profit for one bank relative to another.
That relative comparison is the tool analysts actually reach for. Using NAB’s reported FY24 EPS of $2.26 and a trading price of $37.85, the implied PE is approximately 16.7x. Whether that represents opportunity or fair pricing depends entirely on where peers sit, and the next section lays that out.
PE ratios sit within a broader set of fundamental analysis metrics, including EPS, revenue growth, profit margins, and return on equity, each of which answers a different question about the same company and together provide more context than any single figure read in isolation.
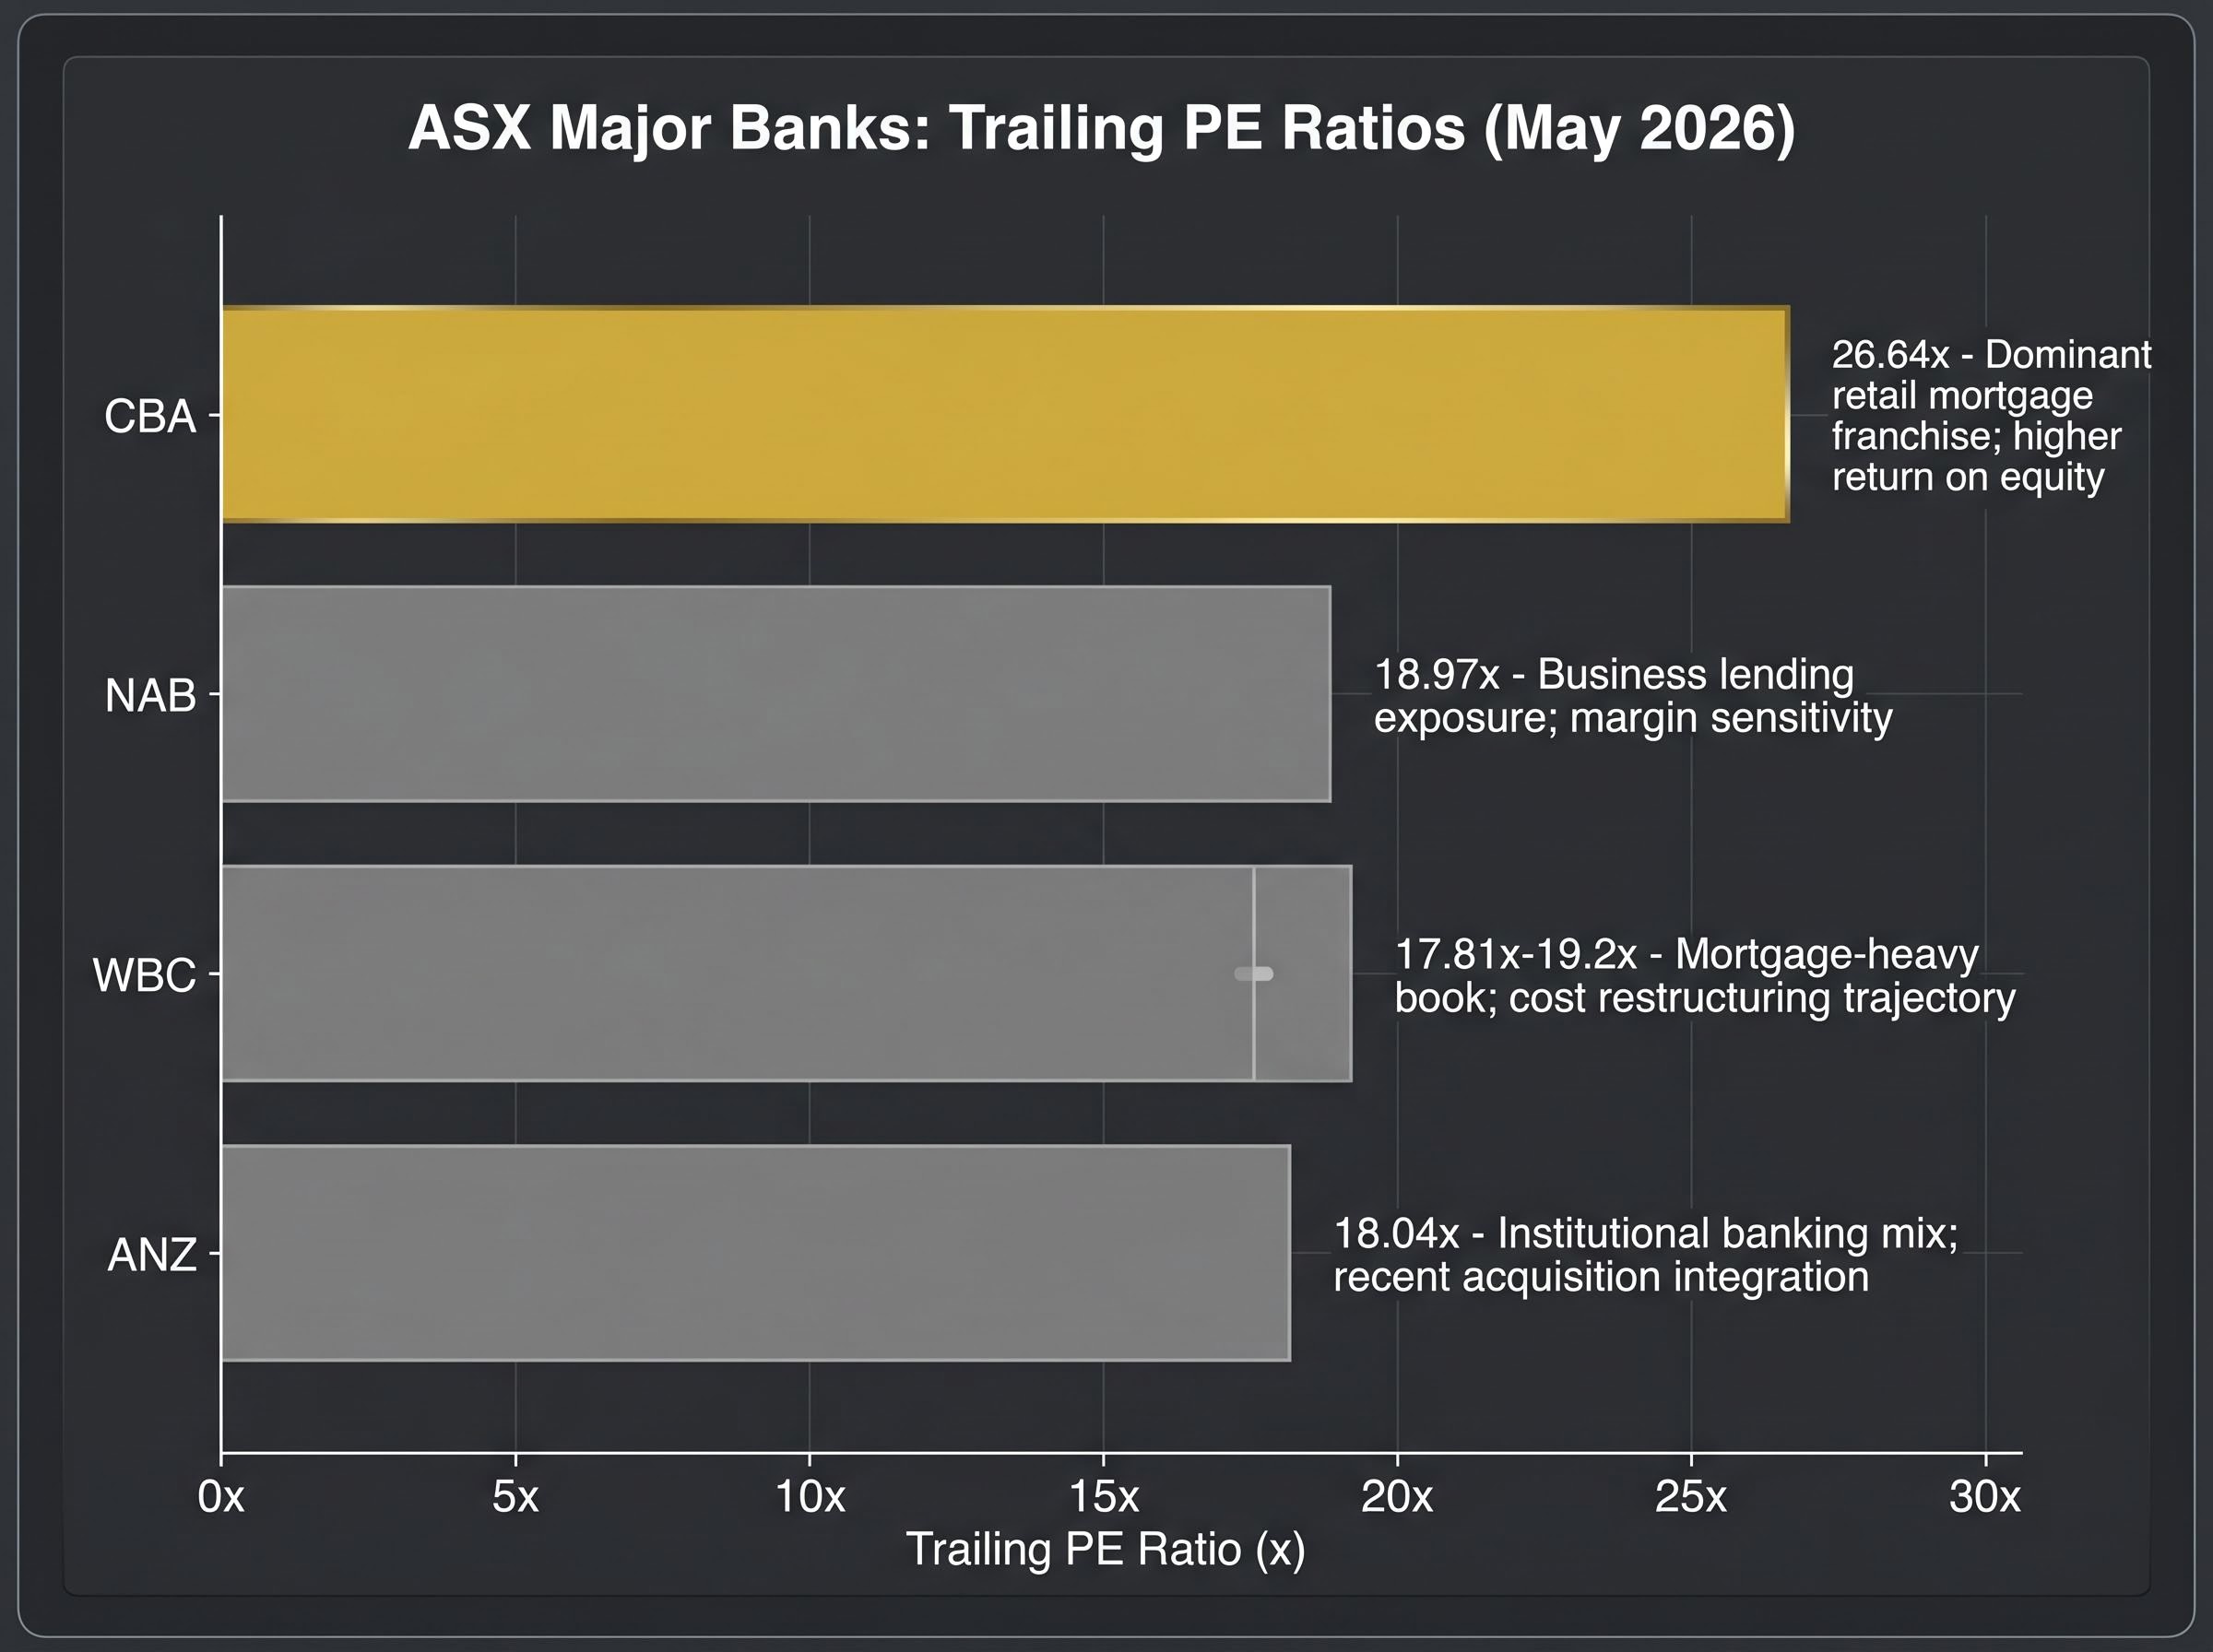
The following table presents trailing twelve-month PE ratios for the four major ASX banks as of 22 May 2026.
| ASX Code | Company Name | TTM PE Ratio (May 2026) | Key Driver of Relative Valuation |
|---|---|---|---|
| NAB | National Australia Bank | 18.97x | Business lending exposure; margin sensitivity |
| ANZ | ANZ Group Holdings | 18.04x | Institutional banking mix; recent acquisition integration |
| CBA | Commonwealth Bank of Australia | 26.64x | Dominant retail mortgage franchise; higher return on equity |
| WBC | Westpac Banking Corporation | 17.81x-19.2x | Mortgage-heavy book; cost restructuring trajectory |
PE ratios are point-in-time figures sourced from Wisesheets.io and GuruFocus as at 22 May 2026. These figures move daily with share prices.
Two distinct groups are visible. CBA sits alone at 26.64x, trading at a material premium to every other major. NAB, ANZ, and Westpac cluster in the high-teens range, broadly comparable to one another.
CBA’s premium is not a mispricing. It reflects a higher return on equity, a dominant retail mortgage franchise with pricing power, and a consistency of earnings delivery that the market has rewarded with a structurally elevated multiple for years. Treating CBA as an anomaly, rather than a quality premium, leads to flawed conclusions about whether the other three are genuinely cheap or simply priced for what they are.
With the peer landscape established, the next step is to turn it into a number. The PE valuation method for a bank stock reduces to three inputs and one multiplication.
Three approaches exist for selecting the PE multiple to apply:
The sector-average approach is the most commonly demonstrated in valuation education, and it works as follows:
NAB’s FY24 EPS of $2.26 multiplied by the 18x sector average PE produces a sector-adjusted implied value of $41.14 per share, compared with NAB’s observed trading price of $37.85.
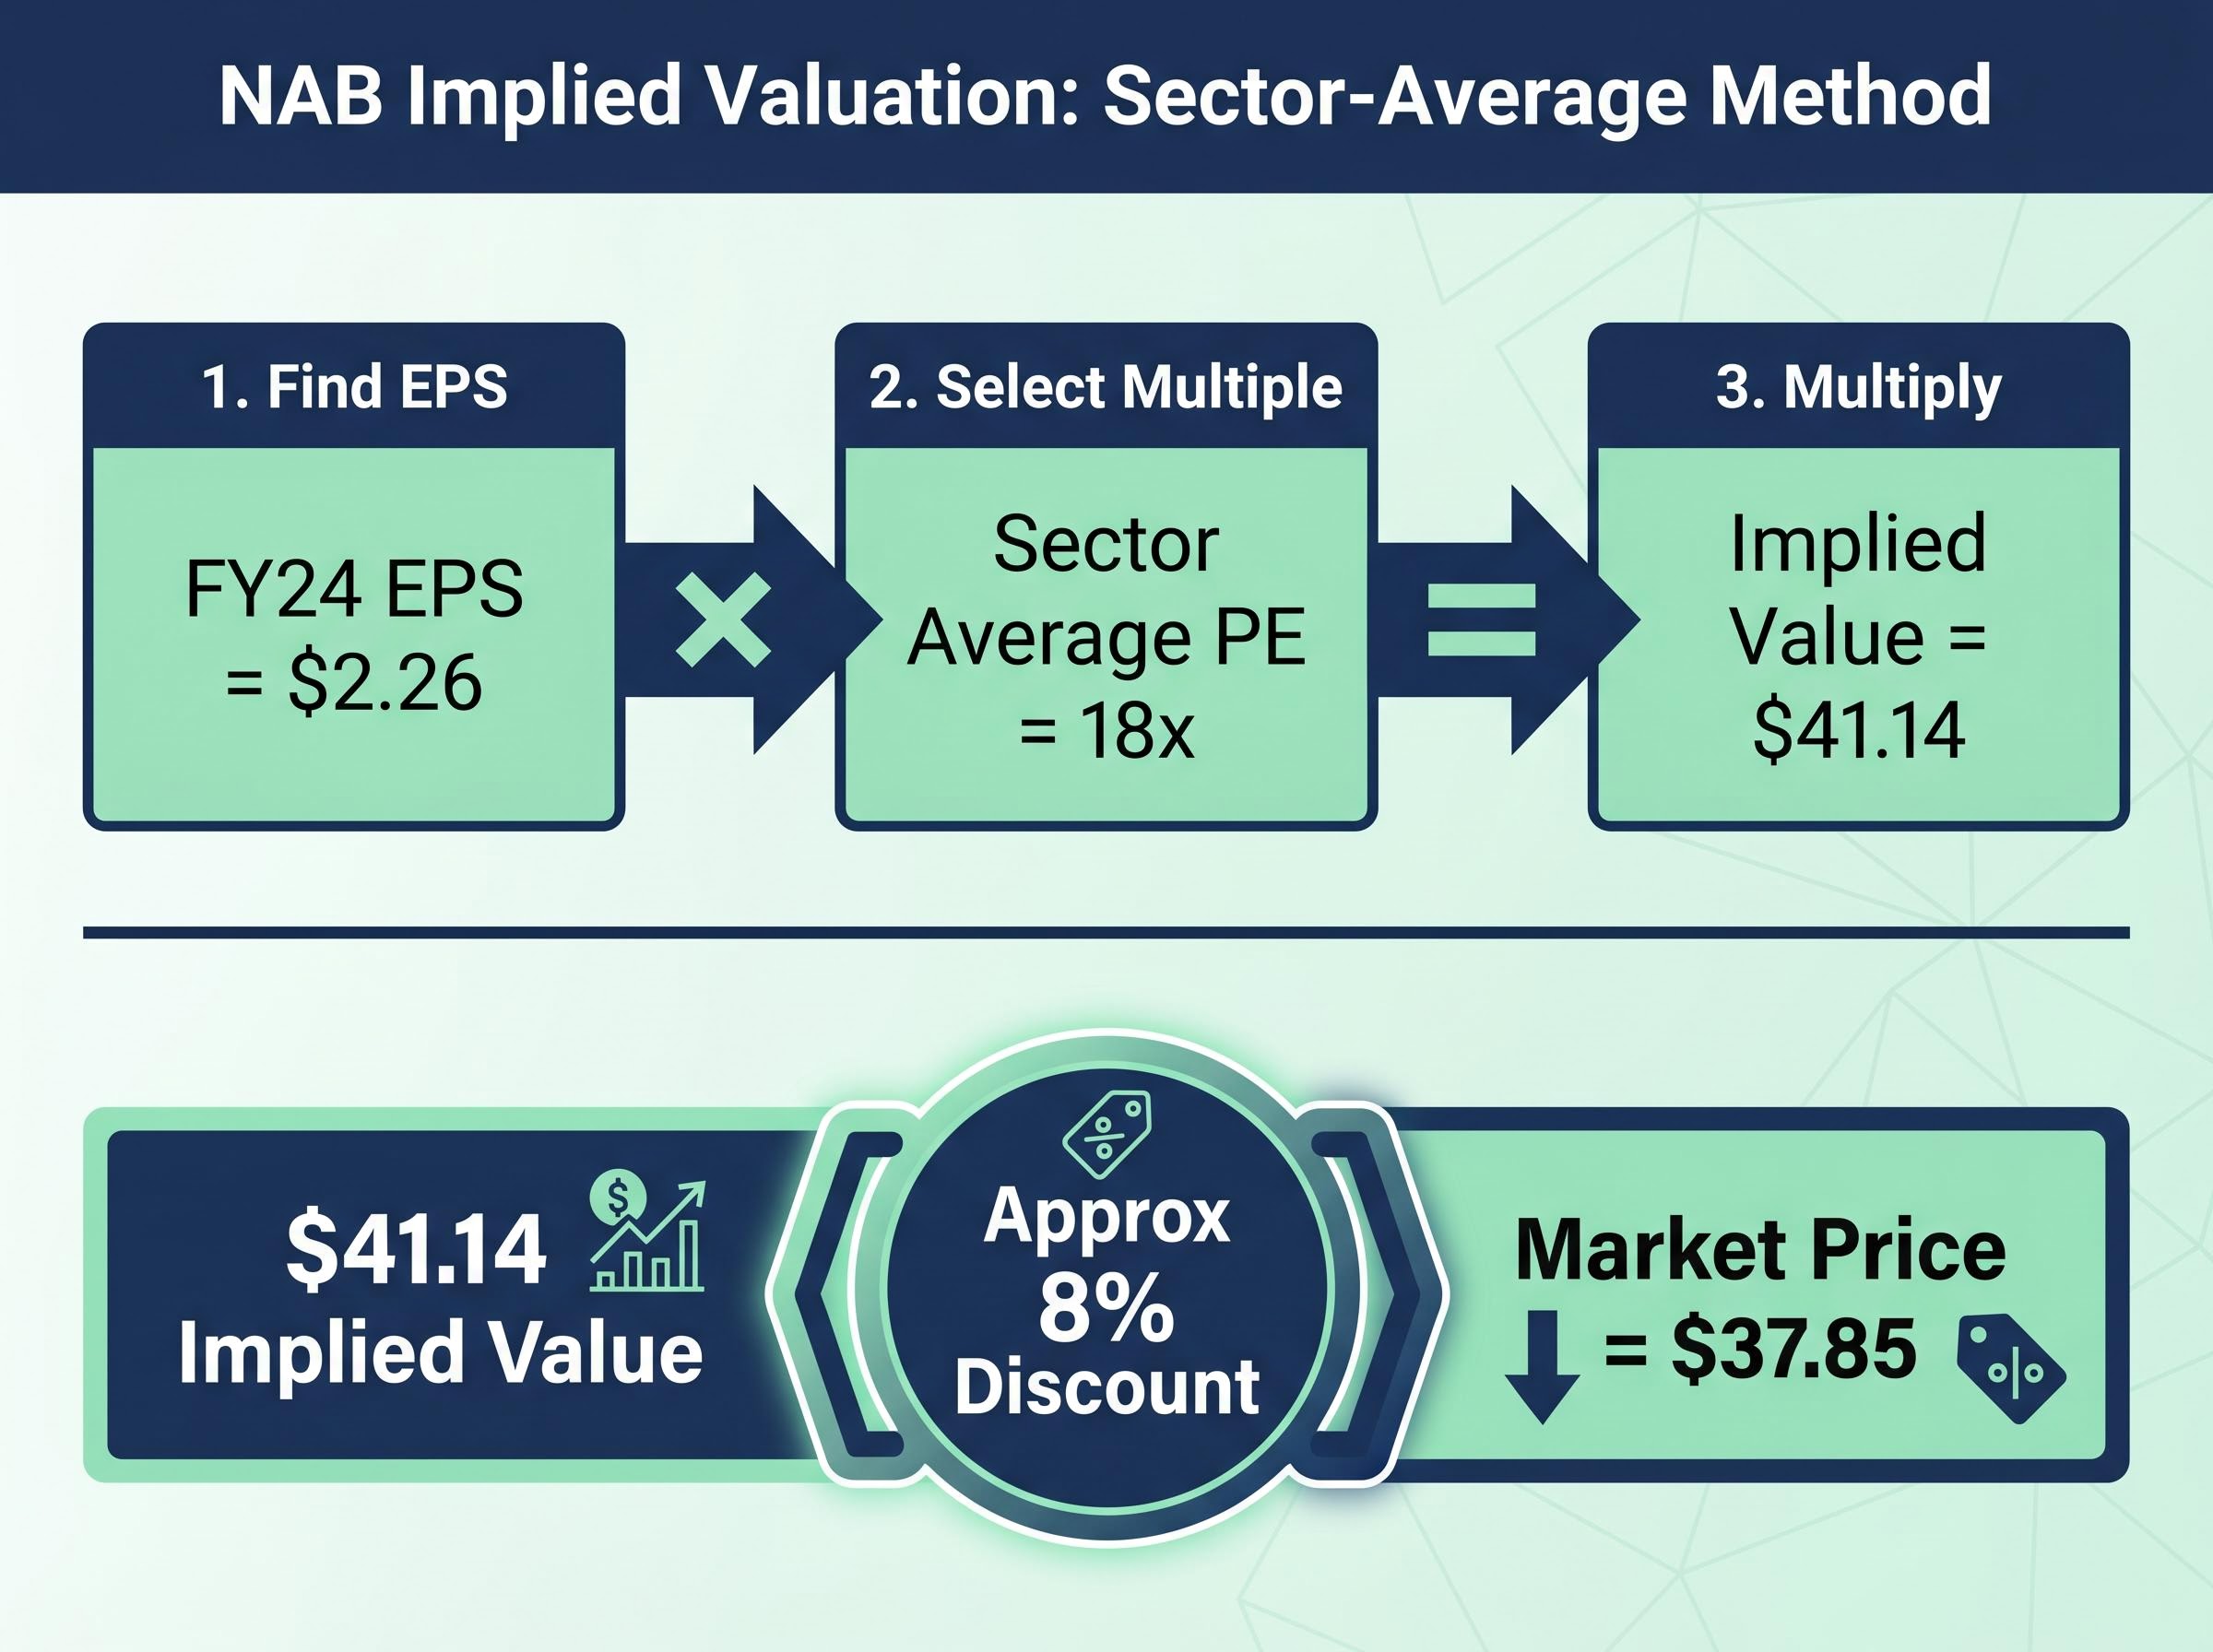
The gap between $37.85 and $41.14 is approximately 8%, suggesting NAB traded at a discount to its sector-adjusted implied value at the time of analysis. That discount does not automatically mean the stock is undervalued. It means the market is pricing NAB below what the peer-average multiple would justify, and the next question is whether the market has good reasons for doing so.
The PE multiple is not a fixed number. It is a judgement call, and the economic environment directly shapes what multiple the market is willing to assign to bank earnings.
Three macro variables matter most:
Australia’s unemployment rate reached 4.5% in April 2026, up from 3.9% a year earlier, raising credit risk assumptions for major bank earnings.
NAB’s heavier exposure to business lending, relative to CBA’s dominant retail mortgage franchise, means its earnings are more sensitive to business credit conditions than to property collateral trends. An investor applying an 18x multiple during a period of rising unemployment may be overstating earnings persistence; an investor applying 16x may be pricing in the macro headwind more accurately. The multiple is itself an economic bet.
The sensitivity of bank valuations to macro assumptions is not a minor caveat; the same NAB model can produce a fair value range from $19 to $85 per share depending entirely on the RBA rate path, employment trajectory, and property price outlook the analyst chooses to embed.
PE ratios applied to banks carry specific weaknesses that readers should understand before treating any PE-derived figure as definitive.
Provisioning cycles distort reported EPS. When banks increase their expected credit loss provisions, earnings fall for reasons unrelated to the underlying business performance, producing PE readings that misrepresent the company’s earning power. One-off items, including remediation charges, software write-downs, and restructuring costs, create similar distortions. A single year’s PE can be noisy.
Two complementary metrics offer more structural stability.
BIS research on bank profitability and price-to-book valuation establishes that a bank’s PBR reflects investor expectations of its capacity to generate returns above the cost of equity, providing the academic grounding for why ROE differentials between CBA and the other three majors translate directly into durable valuation premiums rather than temporary mispricing.
No single valuation metric is sufficient for bank stocks. Layering P/B, ROE, and dividend yield alongside PE analysis produces a less cyclically distorted view of relative value.
The PE methodology reduces to three steps: find the company’s EPS, select an appropriate multiple, and multiply to derive an implied value. Applied to NAB with FY24 EPS of $2.26 and an 18x sector-average PE, the method produces an implied value of $41.14, compared with a market price of $37.85 at the time of analysis, suggesting the stock traded at an approximate 8% discount to its sector-adjusted implied value.
The same process applies to ANZ, CBA, or Westpac using publicly available EPS figures and the peer PE table above. The arithmetic is replicable; the judgement lies in choosing the right multiple and understanding the macro conditions that shape it.
A PE calculation is one input in a broader toolkit. Alongside price-to-book, return on equity, and dividend yield, it forms part of a disciplined but iterative process. Treat it as a starting point for informed analysis, not a single-number verdict.
For readers ready to build a more structurally stable valuation framework alongside the PE approach, our full explainer on NIM, ROE and CET1 valuation for ASX bank shares uses Westpac’s live H1 2026 data to show how net interest margin, return on equity, and capital ratio analysis can shift fair value estimates from $34 to $49 per share depending on which metrics are incorporated.
This article is for informational purposes only and should not be considered financial advice. Investors should conduct their own research and consult with financial professionals before making investment decisions. Past performance does not guarantee future results. Financial projections are subject to market conditions and various risk factors.
A PE ratio measures how much investors pay for each dollar of a company's annual profit, calculated by dividing the share price by earnings per share. For bank stocks, the number only becomes meaningful when compared against a peer group, because it reveals whether the market values one bank's earnings more or less than another's.
You multiply the company's earnings per share by a chosen PE multiple, typically the sector average for the peer group. Using NAB's FY24 EPS of $2.26 and an 18x sector-average PE, the implied value works out to $41.14 per share.
CBA's premium PE of 26.64x reflects its dominant retail mortgage franchise, higher return on equity, and a long track record of consistent earnings delivery that the market has rewarded with a structurally elevated multiple. It represents a quality premium rather than a mispricing.
The RBA cash rate, unemployment levels, and residential property prices are the three main variables. Rising unemployment compresses the PE the market assigns to bank earnings because it raises expected credit losses, while rising property prices support collateral values and justify relatively higher multiples for mortgage-heavy lenders.
Price-to-book ratio, return on equity, and dividend yield are the most important complementary metrics for banks. Layering these alongside PE analysis reduces the distortion caused by provisioning cycles and one-off charges that can make a single year's PE reading misleading.