How Wesfarmers’ AI Strategy Is Built to Compound Returns
3 hrs ago

At current prices around A$165, generating $10,000 in annual dividend income from Commonwealth Bank of Australia requires holding more than A$320,000 in capital. That figure alone frames the scale of the commitment. What makes it more confronting is the backdrop: as of 22 May 2026, not a single analyst tracked by Investing.com or MarketScreener rates the stock a buy.
CBA’s forward dividend forecasts for FY26 and FY27 show steady growth, and the fully franked status of those payments makes the grossed-up yield materially more attractive than the headline cash figure suggests for eligible Australian investors. But the income opportunity sits inside a valuation picture that, by every available analyst measure, looks deeply uncomfortable for new buyers. This analysis breaks down the capital requirements at each forecast year’s payout, explains how franking credits change the real income picture, and examines why the analyst community remains uniformly bearish even as the dividends keep rising.
The arithmetic is straightforward. CBA’s FY26 forecast dividend sits at A$5.15 per share, representing year-on-year growth of approximately 6.2%. The FY27 forecast rises to A$5.45 per share, a further increase of approximately 5.8%. Both figures reflect moderate dividend expansion, consistent with the kind of steady growth CBA has delivered across roughly three decades as an ASX blue-chip.
Translating those payouts into a $10,000 annual income target reveals the capital weight involved. At A$5.15 per share, an investor needs approximately 1,942 shares to collect $10,000 in cash dividends. At A$5.45, that figure drops to approximately 1,835 shares. The difference, roughly 107 fewer shares, shows how even modest dividend growth compounds the income case over time.
At a share price of approximately A$165, those share counts translate into significant capital outlays.
| Metric | FY26 forecast | FY27 forecast |
|---|---|---|
| Dividend per share | A$5.15 | A$5.45 |
| Year-on-year growth | ~6.2% | ~5.8% |
| Shares needed for $10,000 income | 1,942 | 1,835 |
| Capital required at ~A$165 | ~A$320,430 | ~A$302,775 |
Capital context: At today’s price, generating $10,000 in annual cash dividends from CBA in FY26 requires an investment of approximately A$320,430, falling to approximately A$302,775 by FY27 as the per-share payout rises.
Those headline figures understate the real income for many Australian shareholders. CBA’s dividends are fully franked, which means the 30% corporate tax rate has already been paid before the cash reaches investors. Franking credits attach to each payment and can reduce or eliminate personal tax liability for eligible shareholders.
The ATO franking credit refund rules confirm that eligible shareholders, including pension-phase SMSF members, can receive the attached imputation credits as a direct cash refund where those credits exceed the tax otherwise payable, which is why the grossed-up yield is the correct comparison metric rather than the headline cash figure.
Not every investor benefits equally. The three profiles most affected:
For these groups, the grossed-up yield, not the cash yield, is the correct comparison metric when evaluating CBA against alternatives such as term deposits, bonds, or unfranked dividend payers.
A grossed-up yield comparison rather than a cash yield comparison is the correct basis for evaluating CBA against term deposits, investment-grade bonds, or unfranked dividend payers, because cash yield systematically understates the after-tax value of a fully franked payment for eligible Australian investors.
CBA’s FY25 total dividend of A$4.85 per share, confirmed as fully franked in the full-year results, produces a current cash yield of approximately 2.9-3.0% at around A$165. The grossed-up yield is materially higher for eligible taxpayers, though the precise figure depends on individual tax circumstances.
Earlier commentary had cited indicative grossed-up yields of approximately 4.5% (FY26) and 4.8% (FY27), but those figures were based on a share price of approximately A$179, which is now outdated. Readers seeking current grossed-up yield estimates should use the latest broker research or CBA’s next results announcement.
The calculation itself is simple: divide the cash dividend per share by the current share price, then gross up by a factor of 1 divided by (1 minus 0.30). That formula converts the after-tax cash yield into the pre-tax equivalent, which is the figure that makes a fair comparison with unfranked income sources possible.
Analyst consensus (22 May 2026): 14 Sell / 0 Hold / 0 Buy, a unanimous Strong Sell rating across every analyst tracked by Investing.com and MarketScreener.
That unanimity deserves attention. Earlier in 2025, two hold ratings still existed on the panel. Both have since been removed. The cautious middle ground has been abandoned entirely, leaving a consensus with no dissenting view.
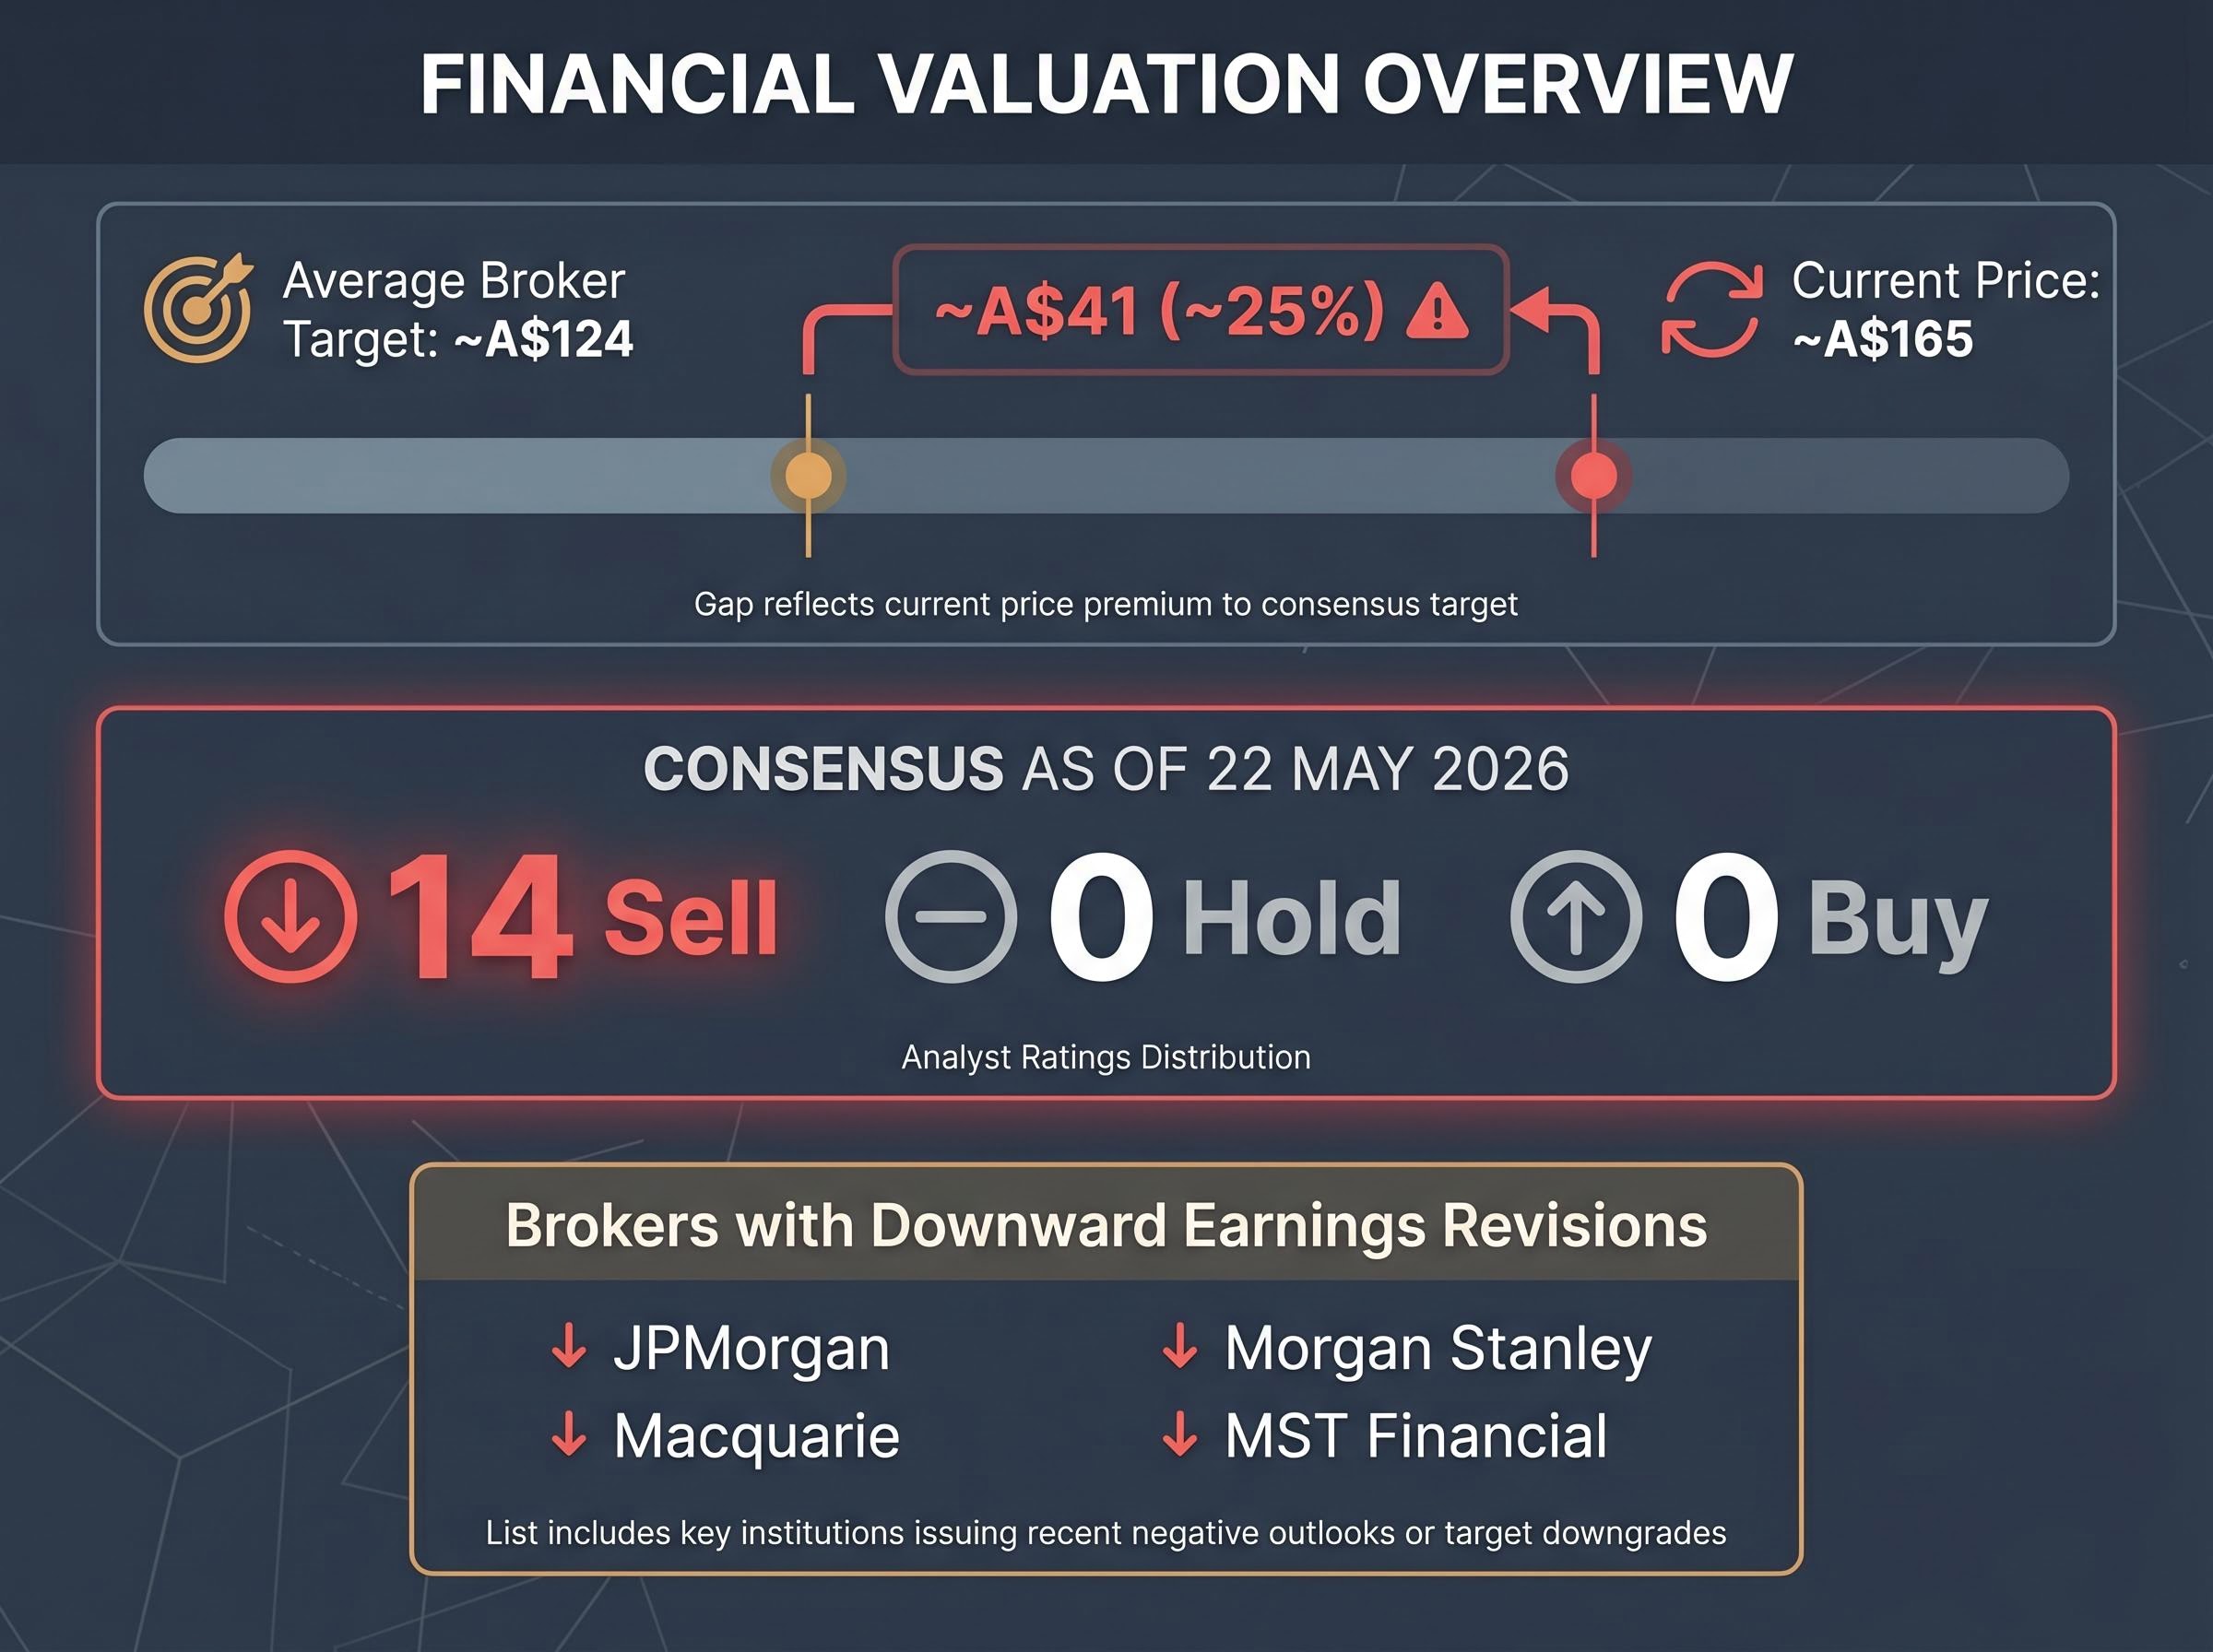
The average broker price target sits at approximately A$124, against a current trading price of approximately A$165. That gap of roughly A$41, or approximately 25%, quantifies the implied overvaluation as assessed by the analyst panel.
The direction of travel reinforces the signal. Four brokers with noted downward earnings revisions include:
A unanimous sell consensus is unusual for a stock as widely held as CBA. The disconnect between institutional valuation views and the actual market price has persisted through multiple reporting cycles, but the removal of all hold ratings marks a hardening of that view rather than a softening.
Investors wanting to place CBA’s analyst consensus in a broader context will find our full explainer on ASX bank sector valuation examines how Westpac, ANZ, and NAB each compare on sell-side ratings, consensus price targets, and recent earnings results, covering why the valuation gap between institutional analysis and market pricing has persisted across all four major banks into mid-2026.
CBA’s five-year return history, more than 190% in total returns including dividends since mid-2020, provides important context for why the analyst sell consensus has failed to suppress the share price: investors who bought earlier have substantial unrealised gains buffering them against the valuation argument, which partly explains how a stock with zero buy ratings continues to trade well above consensus targets.
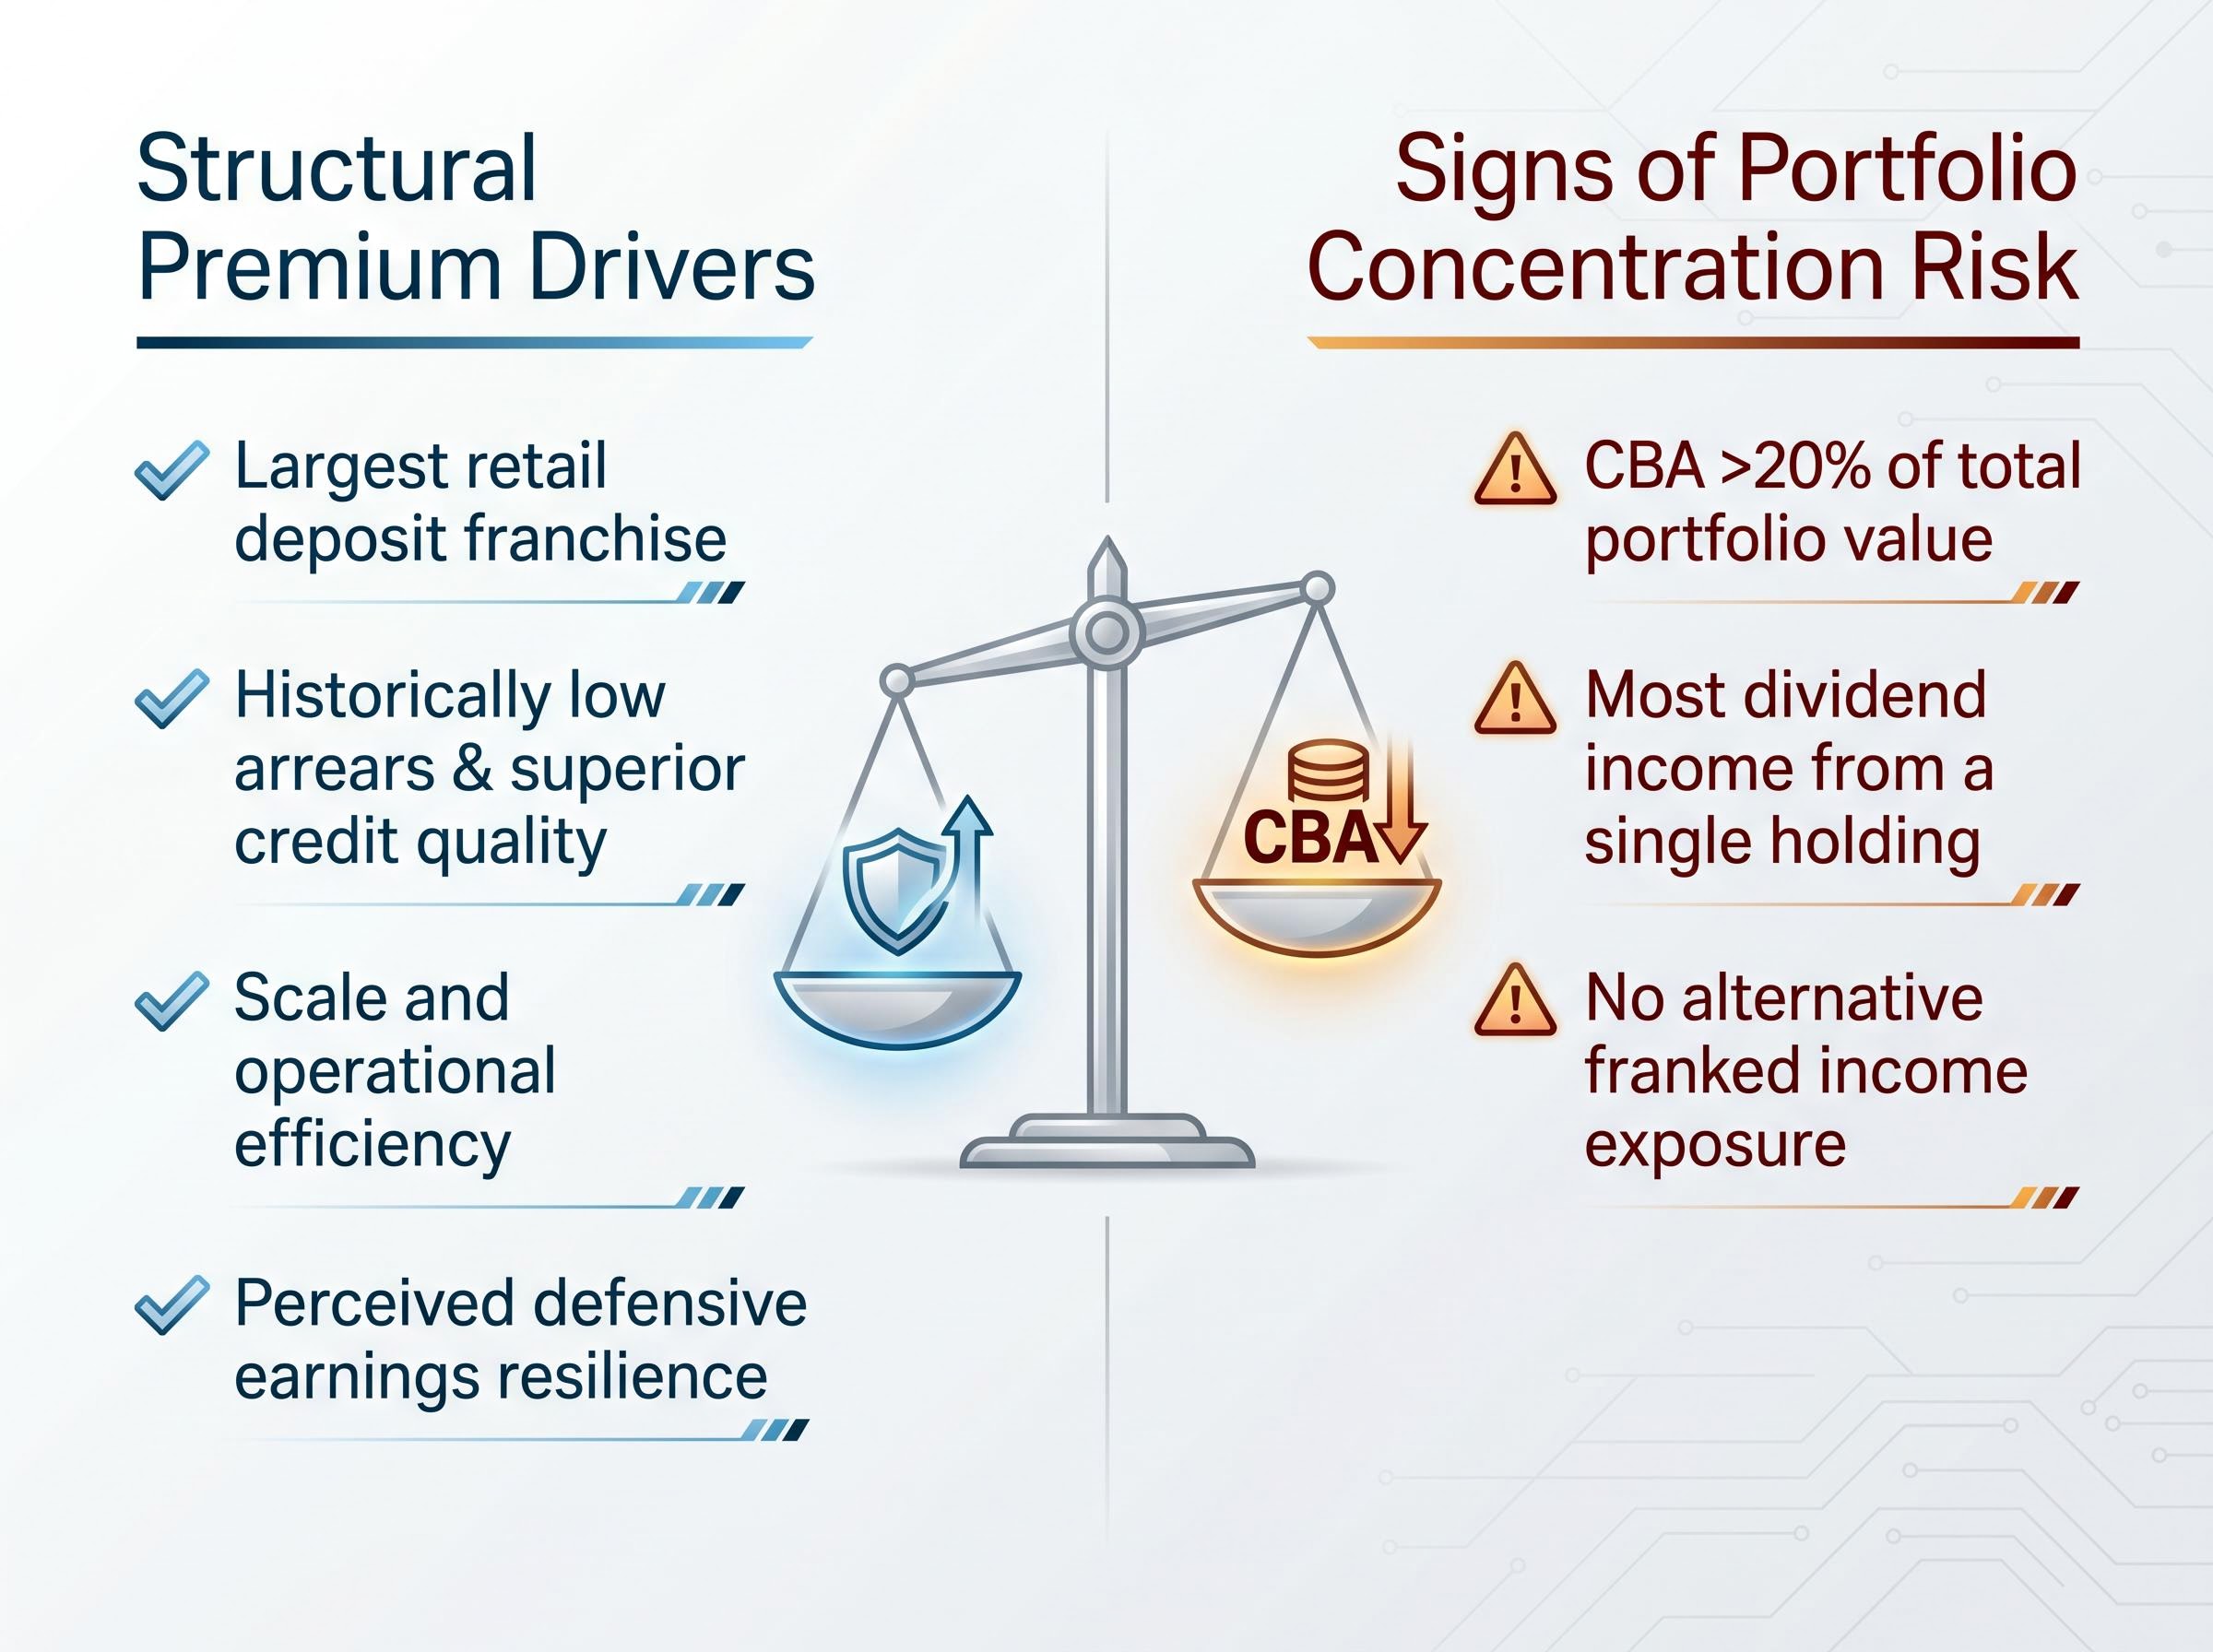
The bearishness does not arise from a misunderstanding of CBA’s quality. The structural reasons for the bank’s premium over peers are well documented:
These are real attributes. They explain why CBA trades above peer multiples. The premium is structurally supported by quality, and the combination of moderating inflation in 2025 and continued premium pricing suggests it is durable rather than cyclical.
The distinction that matters for income investors is between the premium being justified by quality and the premium being appropriate as an entry price. These are separate questions, and conflating them is where the logic breaks down.
At approximately A$165, the market has priced in a level of quality and earnings certainty that leaves little room for disappointment. That is precisely what multiple broker downgrades to earnings forecasts are signalling. A quality business and a quality investment at a given price are different things; CBA in May 2026 illustrates that gap with unusual clarity. The margin of safety, the buffer between what an investor pays and what the business is worth if conditions deteriorate, is where the two questions converge, and where the current price falls short.
The valuation case is one layer of risk. Portfolio concentration is another, and it operates independently of whether CBA’s premium is eventually justified by earnings.
Building a passive income strategy with CBA as the dominant holding concentrates both dividend income and capital value in a single sector and a single name. Even a fundamentally sound business creates structural vulnerability when it accounts for a disproportionate share of portfolio returns. CBA as a component of a diversified income portfolio is a different proposition from CBA as the income portfolio.
Three practical signs that CBA concentration may have become a portfolio risk:
CommSec analyst commentary has explicitly flagged the concentration concern, recommending against CBA as a dominant portfolio position for income-focused investors.
Alternative income opportunities on the ASX exist for investors who want franked dividends without single-stock exposure. Evaluating CBA’s weight in a broader portfolio before adding capital is a step that the dividend growth numbers alone do not prompt, but that prudent income investing requires.
ASX income portfolio construction that spans multiple sector buckets, combining financials with property, infrastructure, and defensive industrials, can deliver comparable grossed-up yields to a concentrated CBA position while materially reducing the single-name and single-sector risk that the concentration analysis above identifies as the structural vulnerability in any CBA-dominant income strategy.
Two forces are at work simultaneously. CBA’s dividend growth is genuine: A$5.15 in FY26, A$5.45 in FY27, with the share count needed for $10,000 in cash income falling from 1,942 to 1,835 across those two years. The trajectory is credible and supported by a three-decade track record of payouts.
Against that, the entire analyst panel, 14 out of 14, rates the stock a Strong Sell, with an average broker target of approximately A$124 against a current price of approximately A$165. The capital required to generate that income, approximately A$300,000-A$320,000 at today’s price, means the income case only works if the capital base does not materially erode.
A share price correction toward analyst targets would actually improve the income yield and reduce the capital required for target income, reframing the current bearishness as potentially constructive for patient income investors willing to wait for a better entry point.
CBA’s next results announcement and current broker research are the appropriate sources for updated FY26 and FY27 grossed-up yield figures. Income investors considering new positions would benefit from revisiting the entry-price question at each reporting cycle rather than anchoring to today’s numbers alone. The dividend case is real. Whether it is a good investment depends entirely on price.
This article is for informational purposes only and should not be considered financial advice. Investors should conduct their own research and consult with financial professionals before making investment decisions. Past performance does not guarantee future results. Financial projections are subject to market conditions and various risk factors.
At a share price of approximately A$165 and a forecast FY26 dividend of A$5.15 per share, you would need to hold around 1,942 shares, requiring a capital outlay of approximately A$320,430 to generate $10,000 in annual cash dividends from CBA.
Franking credits represent the 30% corporate tax already paid by CBA before dividends reach shareholders; eligible Australian investors, particularly SMSF members in pension phase and low-income retirees, can use these credits to offset personal tax or receive them as a direct cash refund, making the real after-tax income higher than the headline cash dividend suggests.
As of 22 May 2026, all 14 analysts tracked by Investing.com and MarketScreener rate CBA a Sell, with an average broker price target of approximately A$124 against a trading price of approximately A$165, implying around 25% downside to consensus fair value.
CBA's forecast dividend is A$5.15 per share in FY26 (approximately 6.2% year-on-year growth) and A$5.45 per share in FY27 (a further increase of approximately 5.8%), continuing a pattern of moderate but steady dividend expansion.
Building a passive income strategy around CBA as a dominant holding concentrates both dividend income and capital in a single bank stock; analysts including CommSec commentary have flagged that CBA exceeding 20% of total portfolio value, or being the sole source of franked dividend income, creates structural vulnerability that diversification across sectors and names can reduce.