
Fourteen of the sixteen analysts covering Commonwealth Bank of Australia have a sell or strong sell rating on the stock. Yet CBA still trades above $160. That disconnect, between what the sell side thinks the stock is worth and what the market is willing to pay, captures the tension running through all four major ASX bank shares in May 2026. All four have reported half-year or quarterly results in recent weeks, and all four face selling pressure. But the reasons differ sharply by stock, and so do the implications for investors weighing whether to hold, add, or exit.
This analysis breaks down the current analyst consensus rating, price target, and recent earnings result for ANZ, CBA, NAB, and Westpac, then contextualises those views against the macro environment shaping the sector. The aim is to give readers a clear framework for assessing where each stock sits on the hold-or-exit spectrum.
The macro backdrop weighing on the entire sector
Before separating the four banks into individual stories, it is worth understanding the shared pressure that sits underneath all of them. The sector-wide selling is the floor, not the ceiling, of each bank’s problem.
The RBA Financial Stability Review from March 2026 confirmed the banking system remains well-capitalised overall, while flagging rising arrears among more vulnerable borrowers and elevated household debt-to-income ratios as the structural risks most likely to constrain earnings growth across the sector.
The RBA Financial Stability Review, published in March 2026, identified three structural concerns for Australian banks:
- Slowing housing credit growth and rising arrears among more vulnerable borrowers, with household debt-to-income ratios remaining elevated
- An interest rate environment that compresses credit demand without falling fast enough to re-rate bank earnings upward
- Proposed policy changes around negative gearing and capital gains tax adding uncertainty to the housing and lending outlook
The broader market reinforces the picture. The S&P/ASX 200 fell 1.3% in the week ending 15 May 2026, confirming that the sell-off is not bank-specific. For financials, though, the combination of credit caution and rate-sensitive earnings amplifies the damage.
Provisioning forecasts across the sector add a forward dimension to the current valuation gap: total big four provisions are modelled to rise from approximately $2.4 billion in FY25 to approximately $5.5 billion by FY27, a trajectory that would compress earnings per share even before any further deterioration in housing credit conditions.
The RBA described the banking system as well-capitalised overall, which is not the same as well-positioned for earnings growth. That distinction matters for every stock discussed below.
When big ASX news breaks, our subscribers know first
CBA is the outlier, and not in a good way
Of the 16 analysts covering CBA, 11 carry a strong sell rating. Three more have a sell rating. Only 2 hold. No analyst has a buy.
That is the most one-sided consensus in the sector, and the Q3 FY26 capital and trading update did nothing to soften it. The update showed flat operating income and a 1% decline in unaudited cash net profit after tax (NPAT), a measure of a bank’s underlying earnings from its core operations. For a stock trading at a significant premium to peers on forward price-to-earnings and price-to-book ratios, flat results harden the valuation argument rather than challenge it.
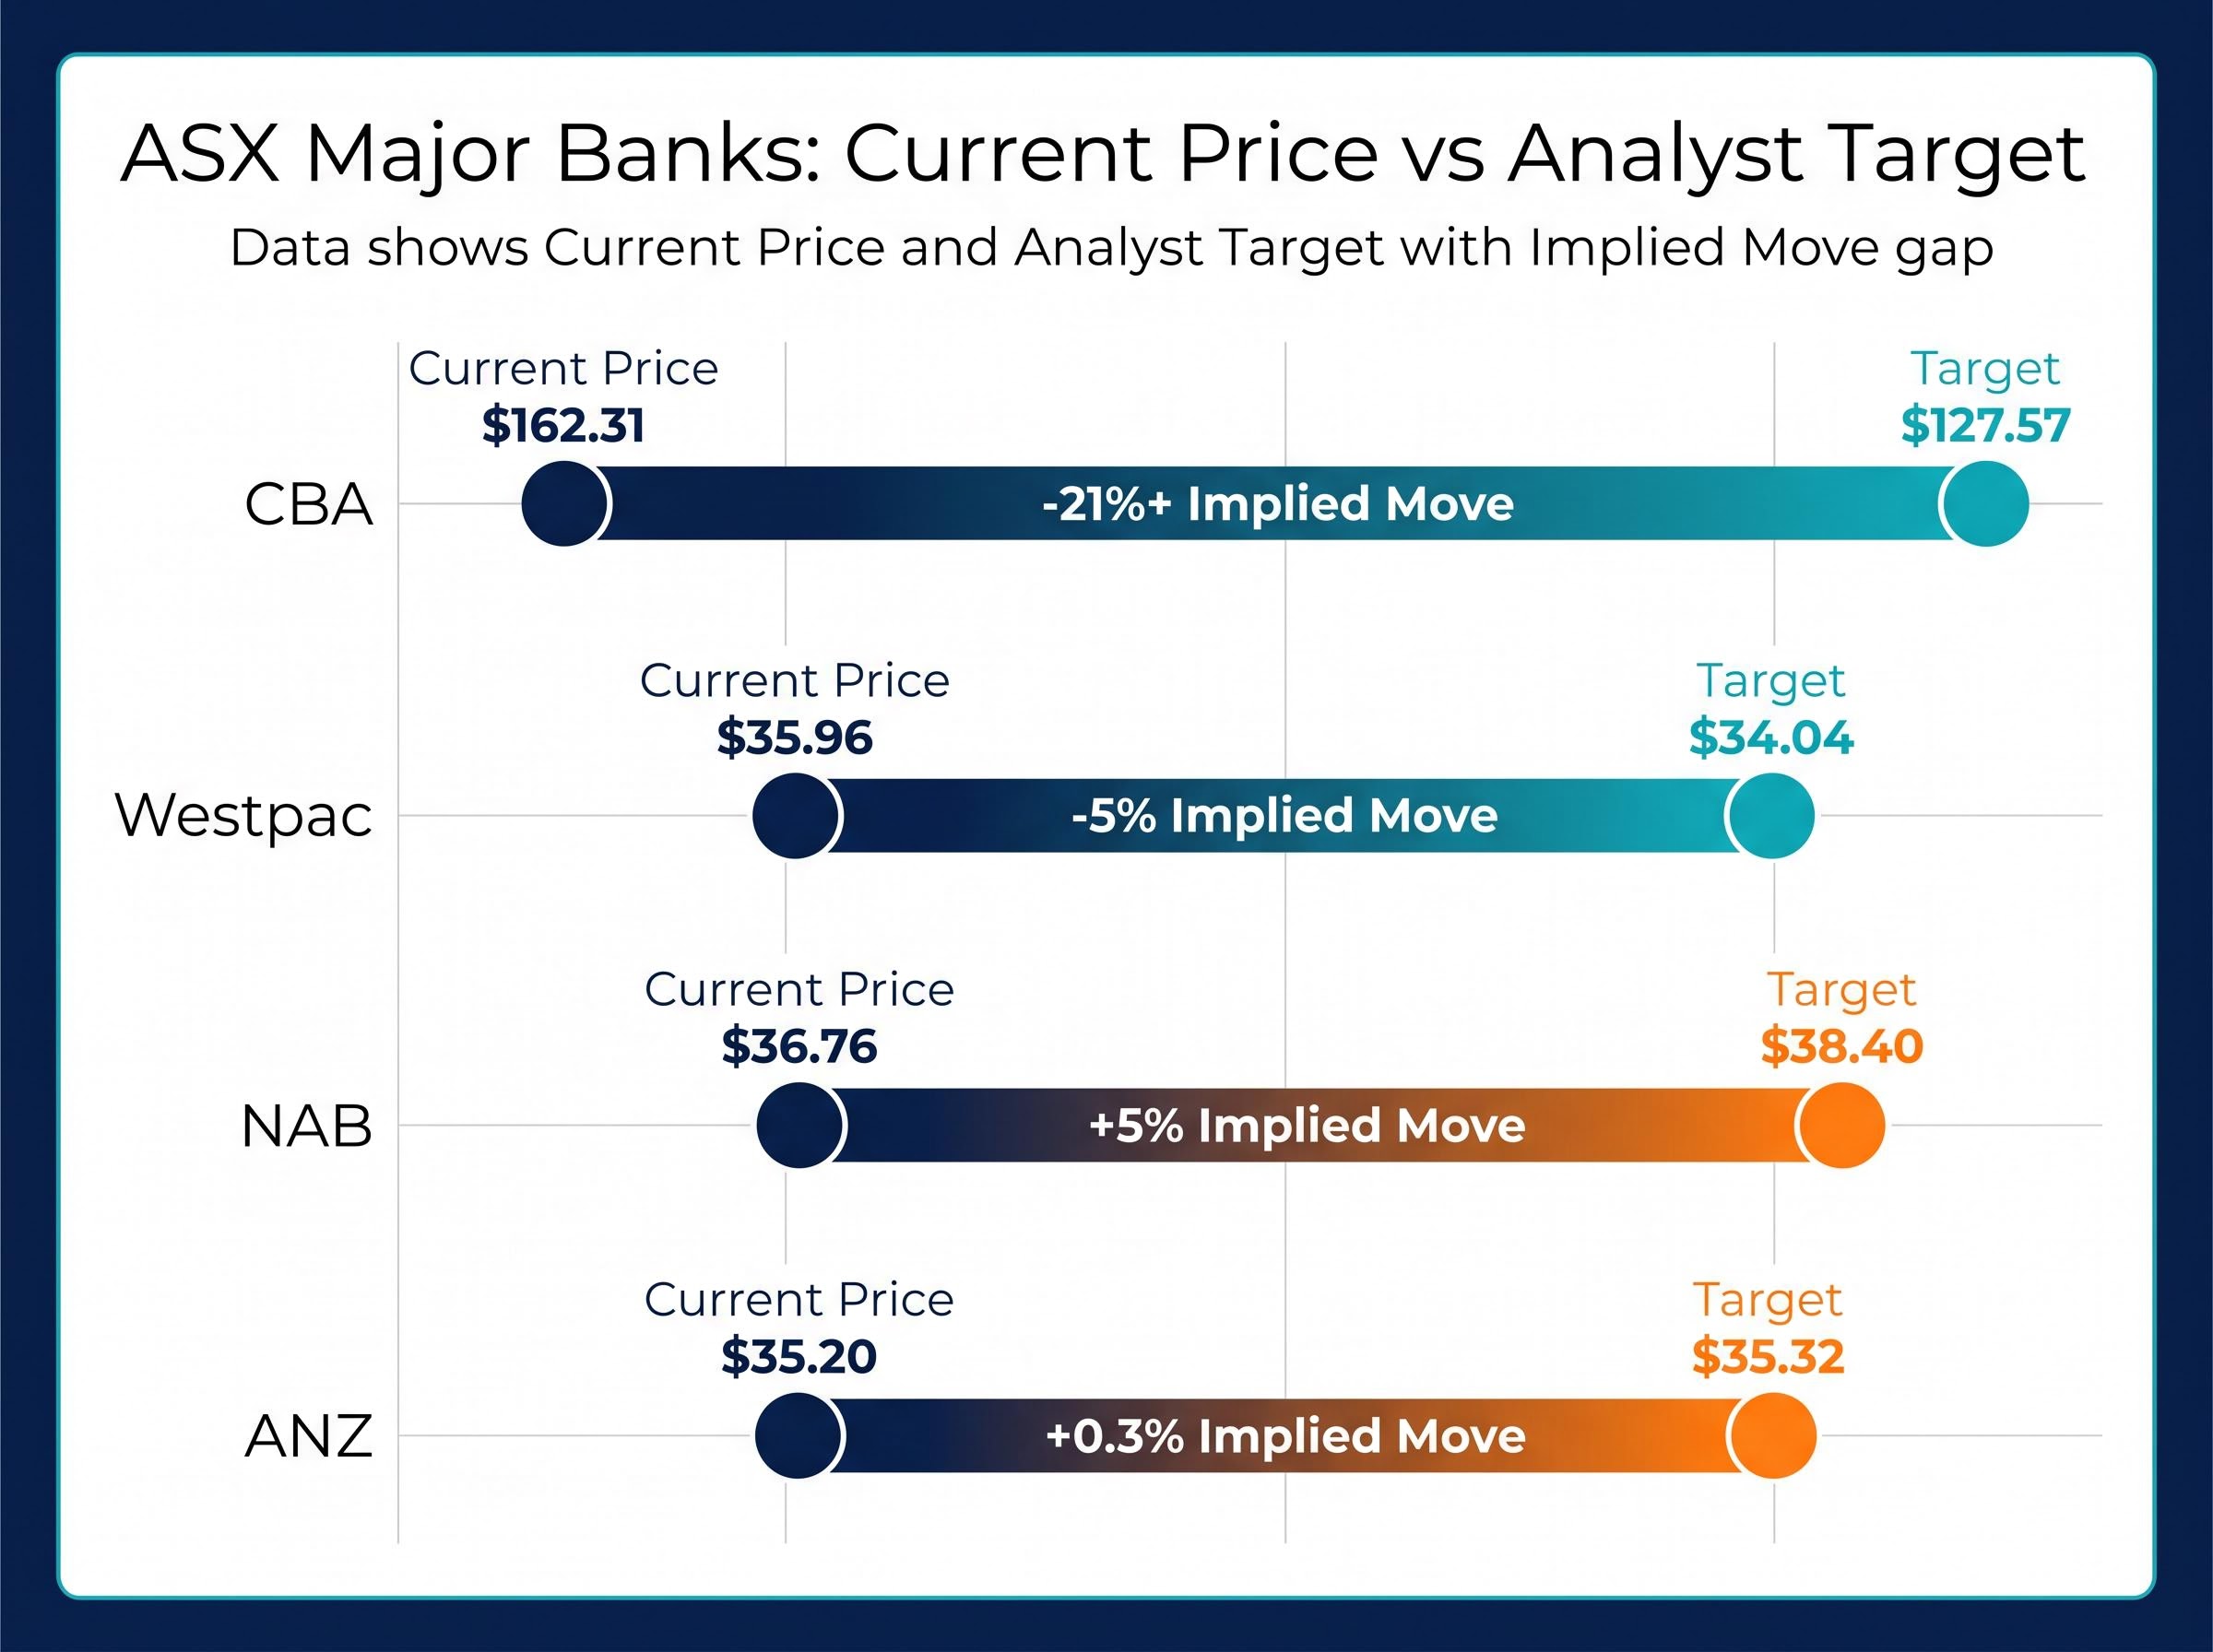
The numbers across all four banks tell the story most efficiently:
| Bank | Analyst Consensus | Consensus Price Target | Approx. Current Price | Implied Move |
|---|---|---|---|---|
| CBA | 11 strong sell, 3 sell, 2 hold | $127.57 | $162.31 | -21%+ |
| Westpac | 9 sell/strong sell, 7 hold | $34.04 | $35.96 | -5% |
| NAB | 9 hold, 5 sell/strong sell | $38.40 | $36.76 | +5% |
| ANZ | 8 hold, 6 buy/strong buy, 2 sell | $35.32 | $35.20 | +0.3% |
The consensus price target of $127.57 implies more than 20% downside from CBA’s current trading price. That is not a routine disagreement between analysts and the market; it signals a structural valuation argument that remains unresolved.
CBA shares are down approximately 6.5% month-to-date and approximately 6% year-on-year. For investors holding CBA as a core portfolio position, the breadth of sell-side conviction here is unusual by local market standards and warrants active review.
Structural buying pressure on CBA from ASX 200 index weighting and compulsory superannuation inflows creates persistent mechanical demand that operates independently of earnings fundamentals, which helps explain why a stock with 14 of 16 analysts on sell can continue trading well above the consensus price target for extended periods.
Westpac’s solid result has not changed analyst minds
Westpac’s 1H FY26 result was substantively solid. Statutory net profit rose 3% year-on-year, and total lending and deposit volumes grew 7% year-on-year.
Lending and deposit volumes up 7% year-on-year represent genuine business growth, the kind of metric that, in isolation, would typically support a more constructive analyst view.
The more relevant comparison for investors focused on earnings trajectory, however, is the sequential picture:
- Year-on-year: Statutory net profit up 3%
- Half-on-half: Profit fell 5% relative to the second half of FY25
That half-on-half decline is the data point analysts are weighting more heavily. Of the 16 covering analysts, 9 rate Westpac a sell or strong sell and 7 hold. None have a buy rating. The consensus price target of $34.04 implies approximately 5% downside from the current price of around $35.96.
Westpac shares remain up approximately 14% year-on-year, suggesting the market had already priced in considerable optimism through 2025. The analyst consensus implies that optimism has now overshot, and the sequential profit decline supports their caution. The stock is down approximately 8% year-to-date.
What “hold” actually means for ANZ and NAB
A hold rating on ANZ and a hold rating on NAB look identical on a consensus screen. They are quite different propositions underneath.
ANZ: strong result, fully priced
ANZ’s 1H FY26 result was the strongest of the four. Cash profit rose 70% year-on-year, statutory profit rose 62%, operating income grew 3%, and operating expenditure fell 22%. The bank reported completing 49% of its $800 million cost-savings target.
Those are exceptional numbers. The analyst response, though, reflects what the price already captures. Of 16 analysts, 8 hold, 6 carry a buy or strong buy rating, and 2 sell. The consensus price target of $35.32 implies just 0.3% upside from the current price of approximately $35.20.
ANZ is the only one of the four with any meaningful buy-side analyst support, but the near-flat implied move explains why the majority sits on hold. The result is priced in. ANZ shares are down approximately 4% month-to-date and approximately 3% year-to-date, though still up approximately 23% year-on-year.
NAB: worst price performance, improving sentiment
NAB is the weakest performer in May 2026, down approximately 8% month-to-date and approximately 13% year-to-date. Its 1H FY26 result came in below market expectations: underlying profit rose 6.4% and revenue grew 3.1%, but neither figure met the consensus forecasts that had been priced into the stock.
The analyst response has been more nuanced than the price action suggests. Sentiment shifted from a sell-dominant stance in late April to a hold majority by mid-May, with 9 of 16 analysts now on hold and 5 on sell or strong sell. The consensus price target of $38.40 implies approximately 5% upside.
For investors comparing the two hold-rated banks, NAB offers the larger implied upside (5% versus 0.3% for ANZ) but comes with greater recent downside momentum and a result that disappointed the market. ANZ’s hold reflects a cleaner earnings story at a price that leaves little room for further appreciation.
Understanding analyst consensus ratings and how to use them
The ratings data presented throughout this article represents an aggregated view from sell-side analysts at major brokerages. A consensus rating reflects the balance of buy, hold, and sell recommendations across all covering firms, compiled into a single directional signal.
All four banks in this analysis are covered by 16 analysts each, providing a reasonably deep consensus by Australian market standards. CBA’s skew, with 14 of 16 analysts on sell, is exceptional; local consensus ratings typically show a more distributed spread. ANZ is the only stock of the four with meaningful buy-side analyst support (6 of 16).
Consensus price targets are 12-month forward estimates and carry inherent uncertainty. They are not guarantees of where a stock will trade. They also reflect institutional views that may differ from the risk profile, tax position, or time horizon of an individual investor.
Before acting on a consensus rating, three questions are worth asking:
- What is the current exposure to this stock, and how does it sit within the broader portfolio?
- What is the implied move relative to the entry price, not just the current price?
- Does the consensus reflect macro or company-specific conditions that are relevant to the intended holding period?
These questions prevent the common mistake of treating a consensus sell as a guaranteed short-term price fall. Sell-side ratings are directional signals, not trading instructions.
Investors wanting to apply a structured framework to the data presented here will find our comprehensive walkthrough of the five-factor bank valuation checklist covers income structure, property market exposure, unemployment trajectory, management discipline, and arrears trends, with worked examples calibrated to current 2026 macro conditions including rising unemployment and declining Sydney and Melbourne property prices.
Four banks, three verdicts, one question for every investor
The common thread across all four major banks is not earnings collapse. Each has reported profit growth or solid underlying fundamentals. The thread is valuation: a sector-wide gap between where these stocks trade and where analysts believe they should trade.
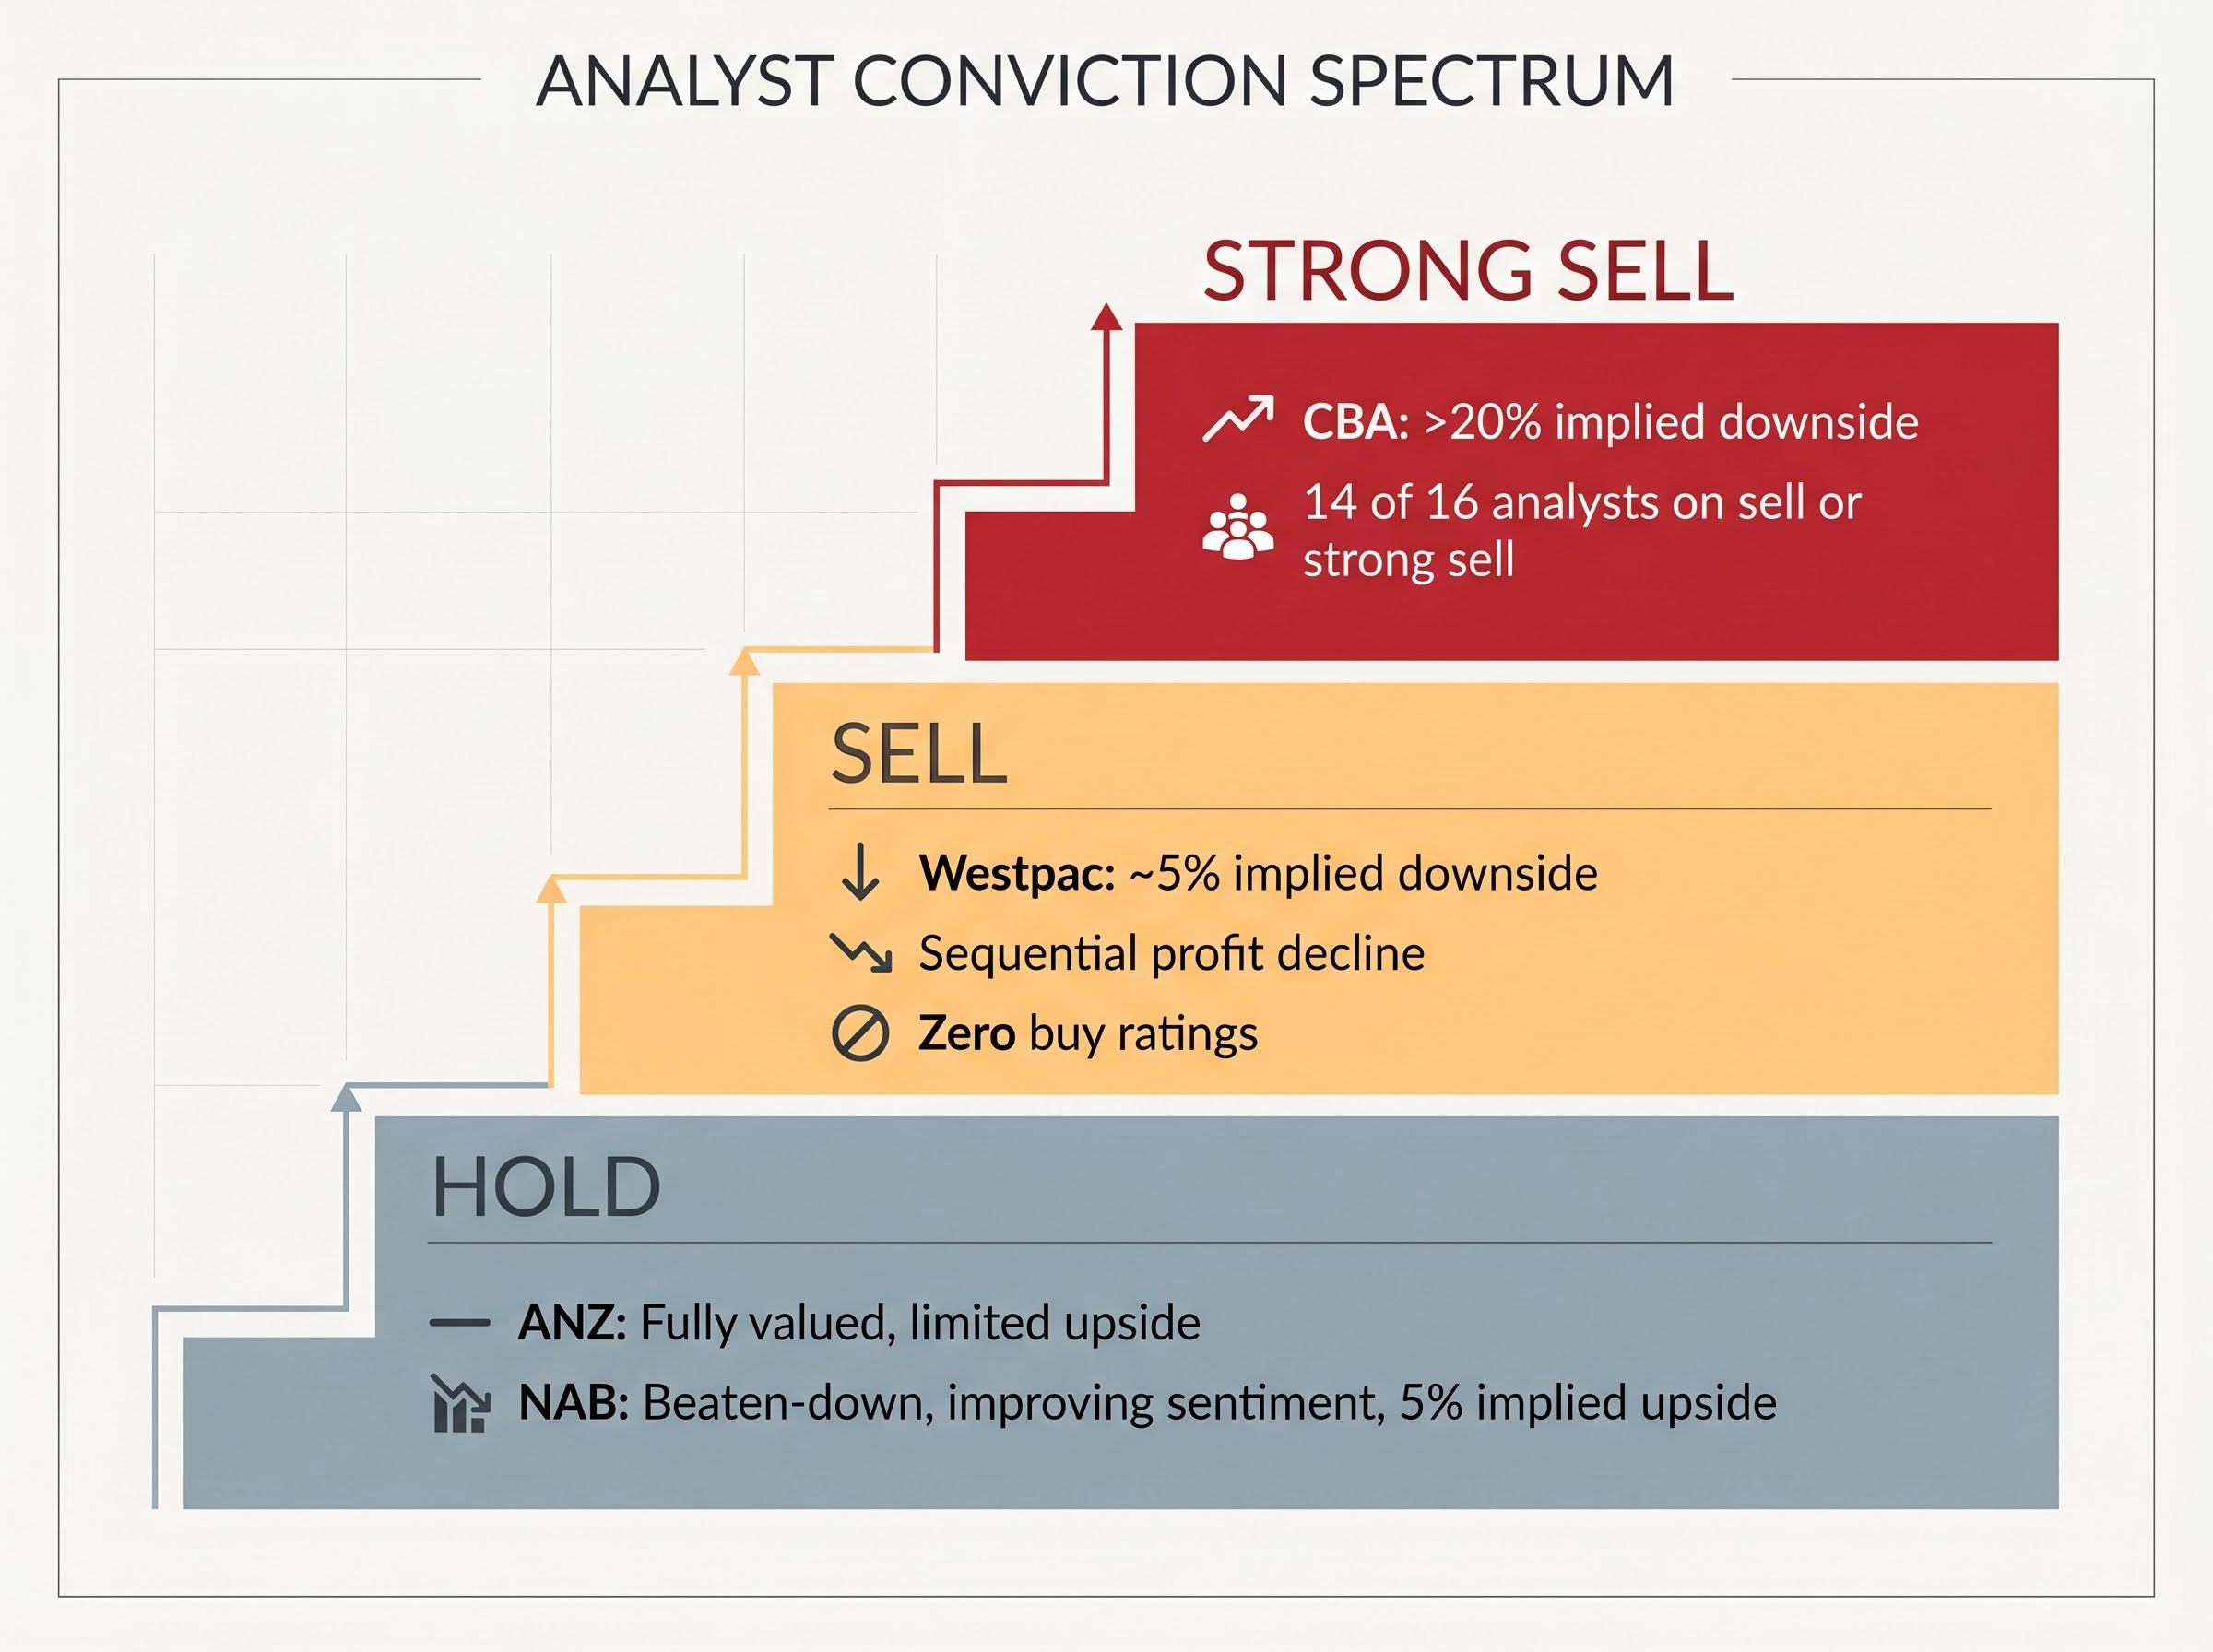
Three tiers of analyst conviction have emerged:
- Strong sell: CBA, with more than 20% implied downside and 14 of 16 analysts on sell or strong sell
- Sell: Westpac, with approximately 5% implied downside, a solid year-on-year result undercut by sequential profit decline and zero buy ratings
- Hold: ANZ (fully valued, limited upside) and NAB (beaten-down, improving sentiment, 5% implied upside)
The macro environment reinforces the caution. Slowing housing credit growth, elevated household leverage, and an RBA rate environment that compresses credit demand without re-rating bank earnings create a sector-level headwind that no individual result has overcome. According to the RBA Financial Stability Review from March 2026, arrears risk continues to rise at the margin among vulnerable borrowers, even as the banking system remains well-capitalised.
The decision for existing holders is a valuation question, not an earnings question. Are current prices justified given the gap between where each stock trades and where the consensus expects it to settle over the next twelve months? That gap is widest at CBA, moderate at Westpac, and narrowest (with a positive sign) at NAB and ANZ.
For income-focused investors weighing whether the dividend case still holds despite negative implied price moves at CBA and Westpac, our full explainer on franking credits and bank share yields covers the grossed-up yield calculations across all four majors, the specific advantage for pension-phase SMSF members who receive franking credits as direct ATO cash refunds, and how to compare bank yields against current term deposit rates above 5%.
This article is for informational purposes only and should not be considered financial advice. Investors should conduct their own research and consult with financial professionals before making investment decisions. Consensus price targets are 12-month forward estimates and are subject to revision based on market conditions and company performance.