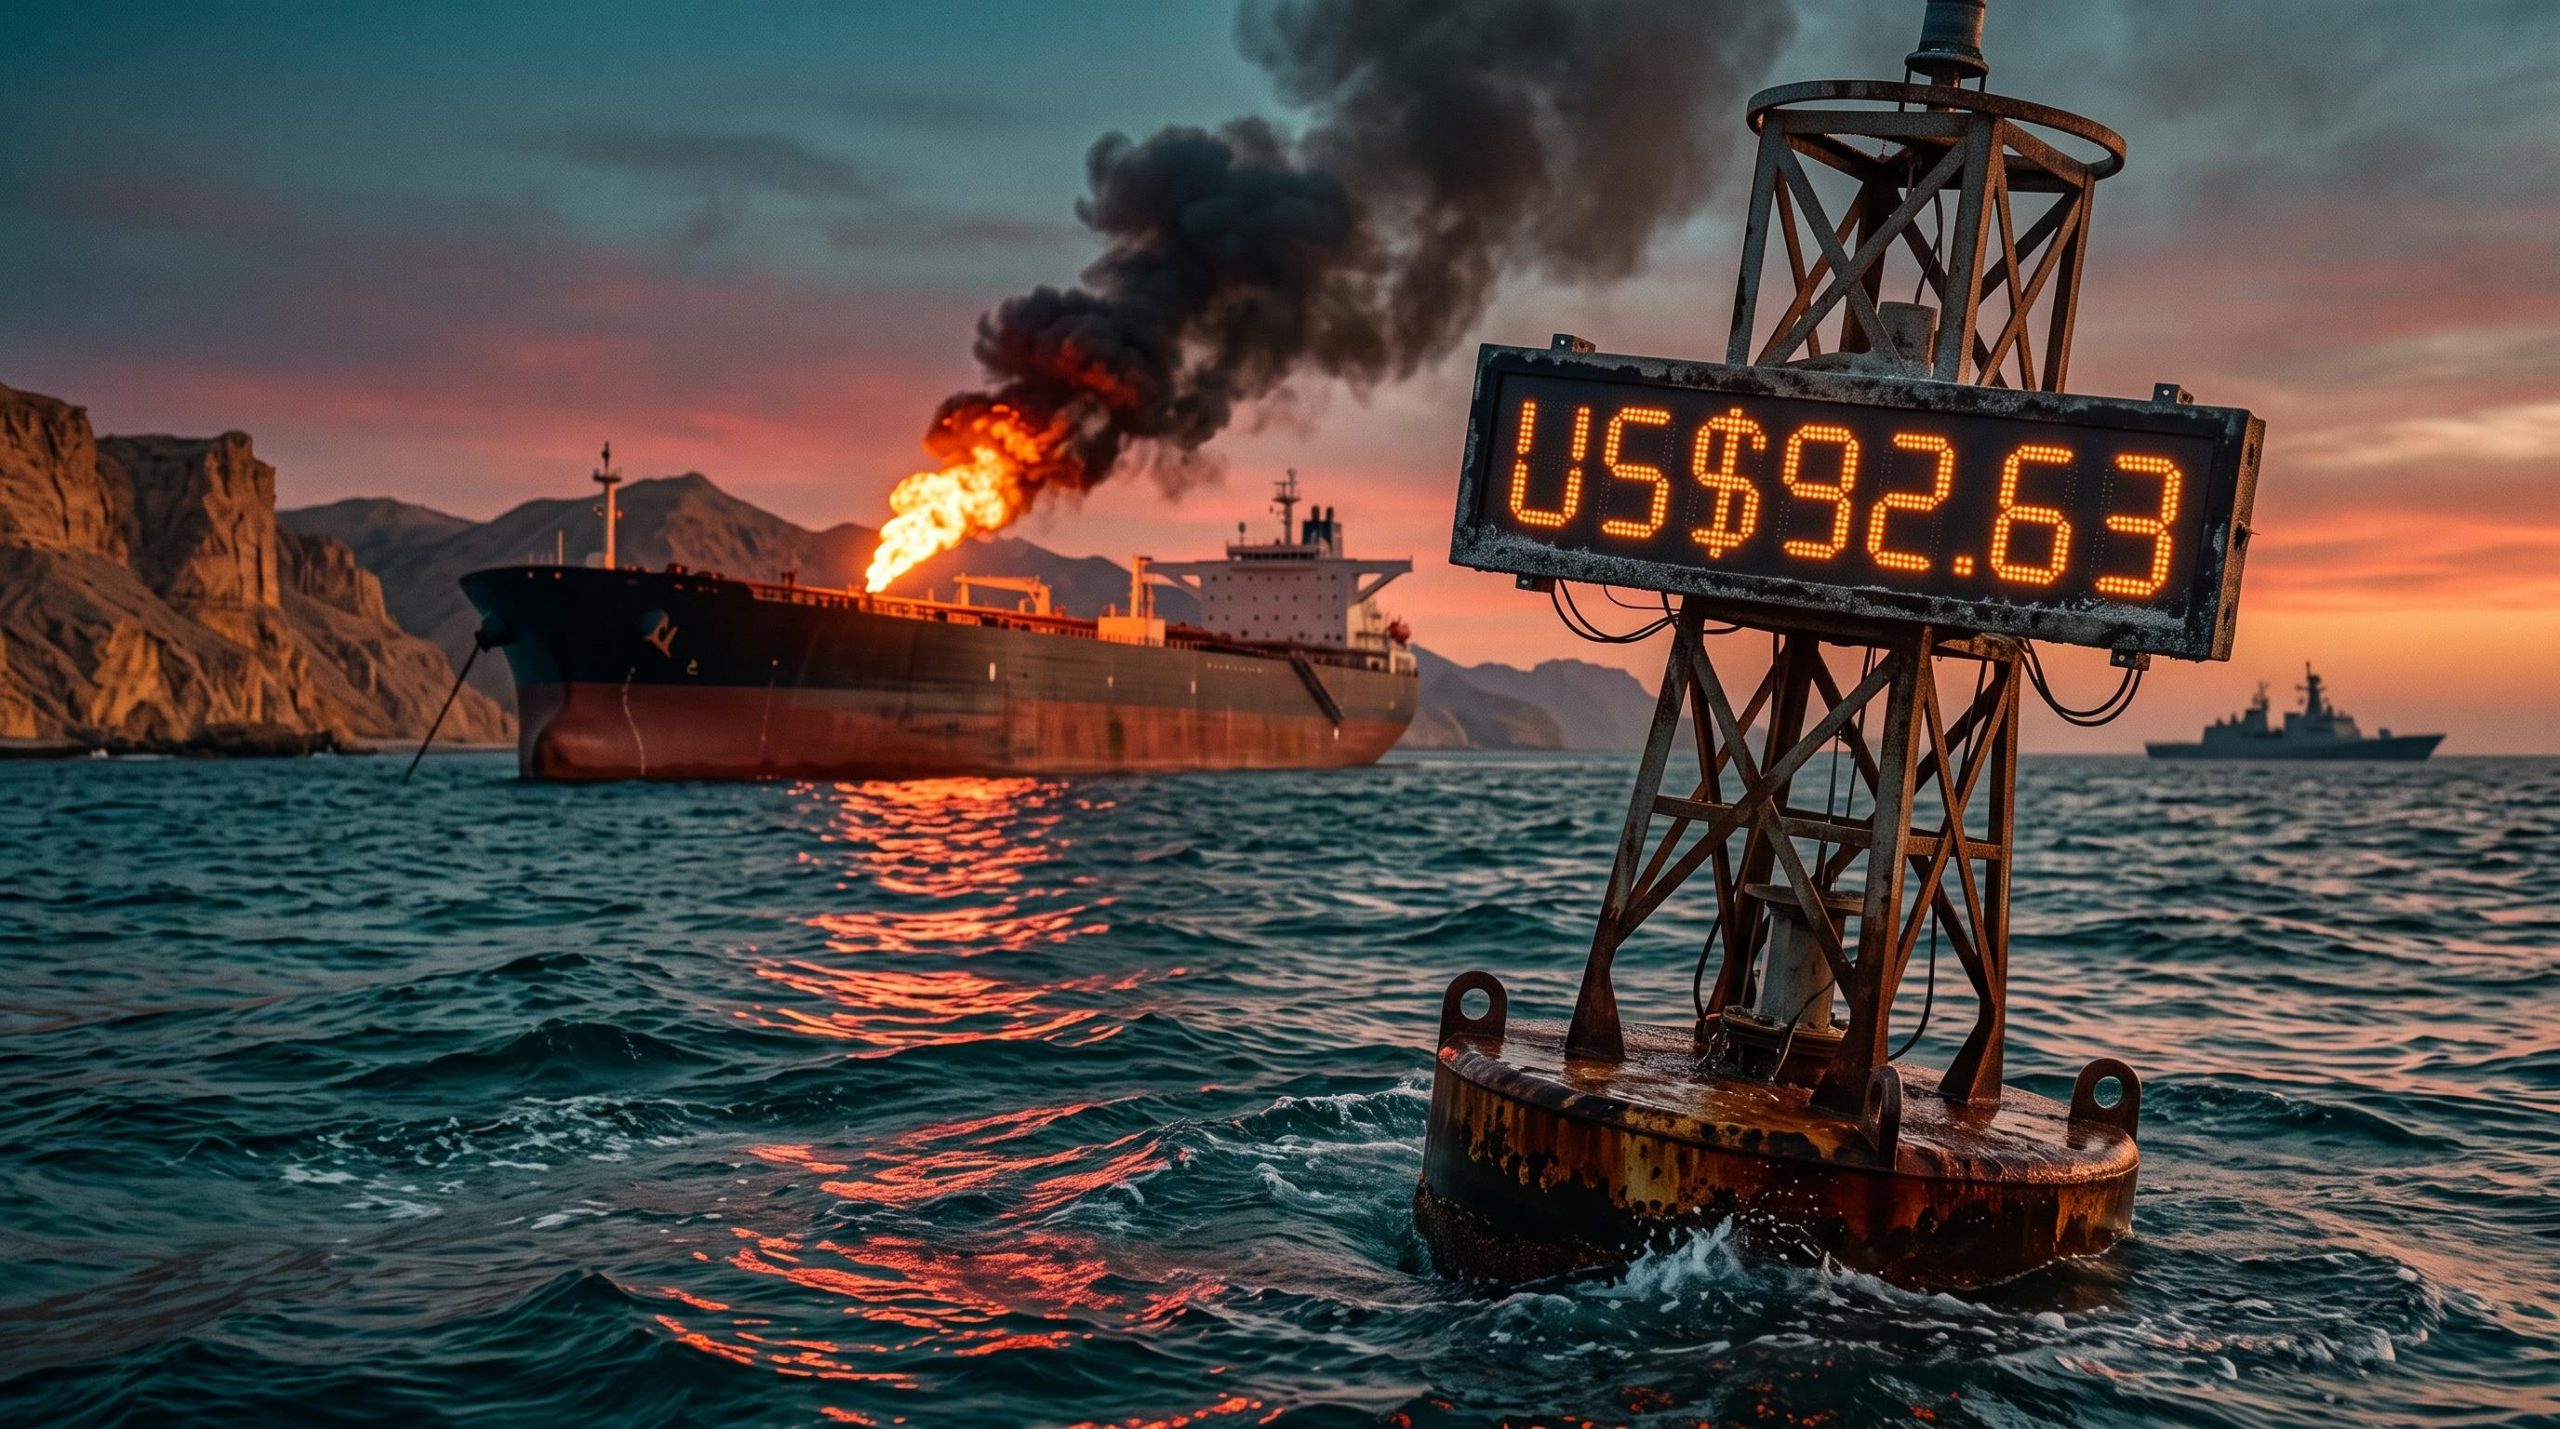
Brent crude bounced 1.2% to US$92.63 a barrel, according to Commerzbank research relayed by FXStreet. That sounds like a recovery until you set it beside the month so far: the same note had Brent down roughly 17% in November.
So the real question is not why oil rose. It is what is stopping a much bigger fall.
The answer runs through the Strait of Hormuz. Iran’s IRGC Navy claims two more tankers struck mines in the waterway overnight and were left burning. Those claims have not been independently confirmed, but they have revived fears about the world’s most sensitive energy chokepoint just as supply fundamentals turned firmly bearish.
This piece covers three things. You will see why geopolitical risk can hold prices up inside a falling market, and how to read the conflicting price figures now circulating. You will also get the signals that separate a durable floor from a bounce that fades within days.
Which Brent crude price is the right one, and what does the November slide really show?
The Commerzbank figure is clean and easy to quote: US$92.63, up 1.2%, down about 17% for the month. Commerzbank argued the latest mine incidents set a floor under oil prices even after a steep monthly decline.
Then the later data arrived. At 04:26 GMT on 12 November 2026, Reuters had Brent front-month futures at US$91.29, down US$1.47 (1.58%). Reuters linked the fall to easing escalation concerns, higher OPEC+ output and rising US inventories.
Neither source is wrong. The Commerzbank figures most likely describe an earlier intraday rebound or an earlier month-to-date calculation. The Reuters print captures a later moment, after the overnight bid had faded.
| Source | Timestamp | Brent level | Move | Stated driver |
|---|---|---|---|---|
| Reuters | 2 November | Not specified | Down more than 4% | Diplomatic hopes involving Iranian and Qatari officials |
| Reuters | 9 November | Not specified | Down more than 17% over prior week | Repricing of disruption duration |
| Reuters | 11 November | US$93.64 | Up US$2.15 (2.35%); down about 21% in November | Renewed shipping incident concerns |
| Commerzbank via FXStreet | Around 12 November | US$92.63 | Up 1.2%; down roughly 17% in November | Hormuz mine incidents |
| Reuters | 12 November, 04:26 GMT | US$91.29 | Down US$1.47 (1.58%) | Easing escalation, OPEC+ output, US inventories |
Read the table top to bottom and a pattern emerges. Each rebound has been followed by another leg lower, and by the latest Reuters count the November decline is closer to 21% than 17%.
What this tells you is that a quoted oil price means little without a source and a timestamp. The direction of travel across several days is a far better guide than any single print you see in a headline.
Intraday oil price volatility of this kind is not new: in May, Brent swung nearly US$2 in a single session even as it fell about 7% on the week, a pattern that masks the broader direction.
When big ASX news breaks, our subscribers know first
How does chokepoint risk create a price floor?
The intuitive story is simple: less oil gets through, so oil costs more. That story is incomplete, and it explains why Brent can fall hard while still finding support.
A risk premium is the extra amount buyers pay above what supply and demand alone would justify, because they fear a disruption. Commerzbank’s Carsten Fritsch said in October that Iran-related tensions, attacks and risk to Hormuz shipping were sustaining a substantial premium of exactly this kind.
The premium travels through several channels:
- Prompt barrel value: oil available now becomes worth more than oil promised later.
- Freight: tanker rates rise as owners demand compensation for danger. Freight has been reported at about US$30 per barrel, against about US$5 before the war.
- Insurance: cover becomes costlier or harder to obtain.
- Delayed deliveries: longer voyages and ship-to-ship transfers stretch delivery times.
- Reduced fungibility: alternative supply cannot easily substitute, because it sits in the wrong place or is the wrong quality.
LSEG Oil Research added that flows would not normalise immediately even after a political deal, because mine clearance, insurance and shipowners’ appetite for risk all take time.
War-risk insurance premiums have run at roughly 30 times normal rates, and maritime unions have classed Hormuz as an active war zone, which is why a diplomatic declaration alone cannot restore commercial shipping.
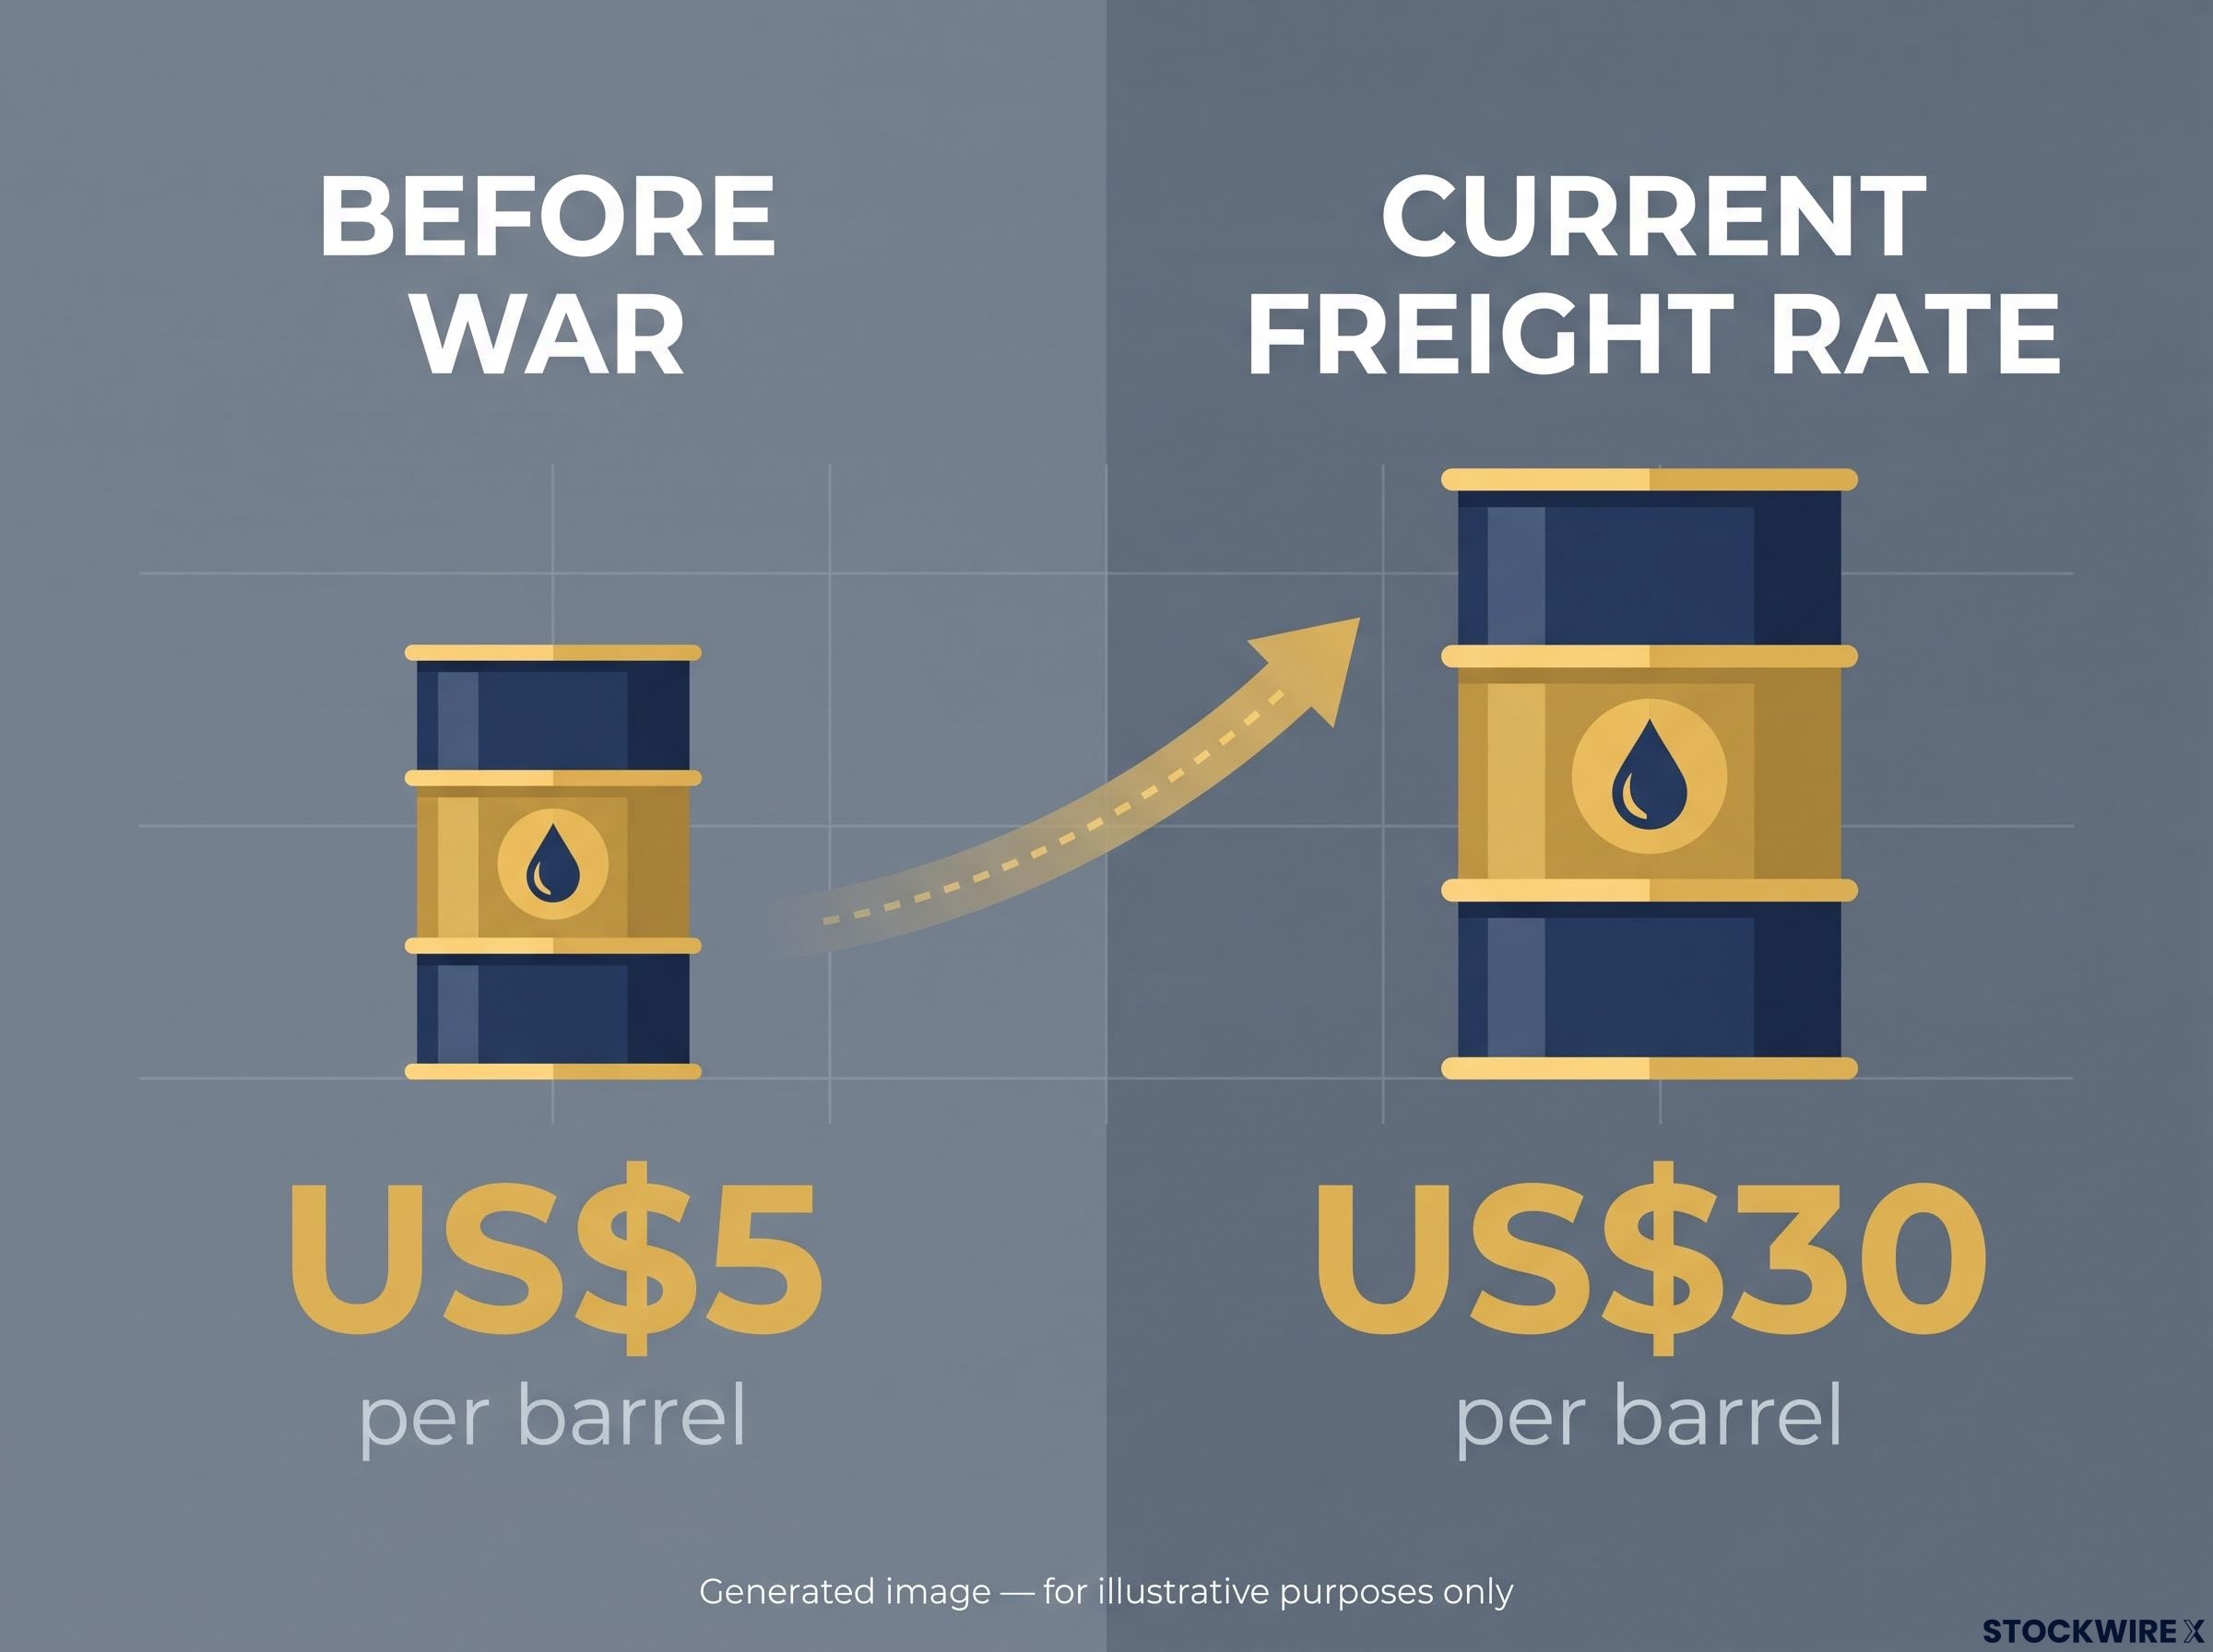
Current freight rates have surged to US$30 per barrel, compared to US$5 per barrel before the war.
Conditional forecast: Goldman Sachs Goldman Sachs raised its oil forecasts in November and estimated Brent could reach US$140 in 2027 if Gulf production stays materially below its 2025 average. This is a scenario, not a base case. Past performance does not guarantee future results, and projections are subject to market conditions and various risk factors.
Why prompt and deferred prices can diverge
Backwardation is a market structure where the nearest futures contract trades above contracts for later delivery. Reuters reported a sharp premium for prompt Brent over future-dated contracts, which means a physical squeeze today can coexist with an expected surplus tomorrow.
History shows markets grade these threats. In June 2019, attacks on two product tankers near Hormuz lifted second-month Brent about 2.1%, while the Dubai swap rose only 0.5%, according to Reuters. Traders treated the attacks as a warning, not a threat to crude exports.
For you, the takeaway is that a floor under front-month oil reflects logistics and insurance friction as much as lost barrels. A headline ceasefire may not remove it quickly.
Why do LNG flows and unverified mine claims matter for the backdrop?
Oil is only half of Hormuz’s importance. Liquefied natural gas (LNG), gas cooled into liquid form for shipping, depends on the strait even more heavily, according to the International Energy Agency (IEA):
- About 93% of Qatar’s and 96% of the UAE’s LNG exports transit Hormuz.
- That flow was about 19% of global LNG trade in 2025, with almost 90% heading to Asia.
- Delivered Qatar and UAE LNG fell about 62 bcm (billion cubic metres), or 63% year-on-year, in January-October 2026.
- In October, 31 LNG tankers transited, per S&P Global. Qatar’s Ras Laffan loaded more than 2.7 million tonnes, versus nearly 6.2 million in February, while UAE transits returned to pre-war levels.
That structural dependence is real and measured. The trigger headlines are a different matter.
| Date and source | Reported incident | Attribution | Confirmation status |
|---|---|---|---|
| 5 November, Reuters | Two tankers and a tugboat caught fire; one tanker allegedly hit a mine | IRGC | No vessel names or independent confirmation |
| 8 November, RFE/RL | Two tankers allegedly caught fire after hitting mines | IRGC Navy | Not verified by any maritime authority |
| 8 November, JMIC/UKMTO | Tanker fire near Khasab, Oman; crew evacuated | Military authorities | Not established as a mine strike |
| 11 November, UKMTO | Tanker incident in the strait | UKMTO | Cause and vessel not specified |
| 12 November, Reuters | Two supertankers disabled, later said to have struck mines | IRGC Navy via Iranian state media | Not independently confirmed |
The UK Maritime Trade Operations (UKMTO) and Joint Maritime Information Centre (JMIC) have reported incidents but have not confirmed mine strikes. No vessel names, flags, operators or casualty details have been verified.
For you, this means the premium rests on a genuine dependence, while the specific claims driving each bounce deserve caution until neutral maritime bodies back them up.
What is pulling Brent lower, and which signals decide what happens next?
The bearish case in numbers
The forces behind the November slide are substantial. Talks involving Iranian and Qatari officials sent Brent down more than 4% on 2 November. Gulf exports have been recovering under US Navy-protected convoys, and OPEC+ output rose in October, led by Saudi Arabia, Kuwait and Iraq.
JPMorgan estimated supply exceeded consumption by about 1.1 million barrels per day in September and 1.4 million in October. High prices have also destroyed demand, and US inventories are rising.
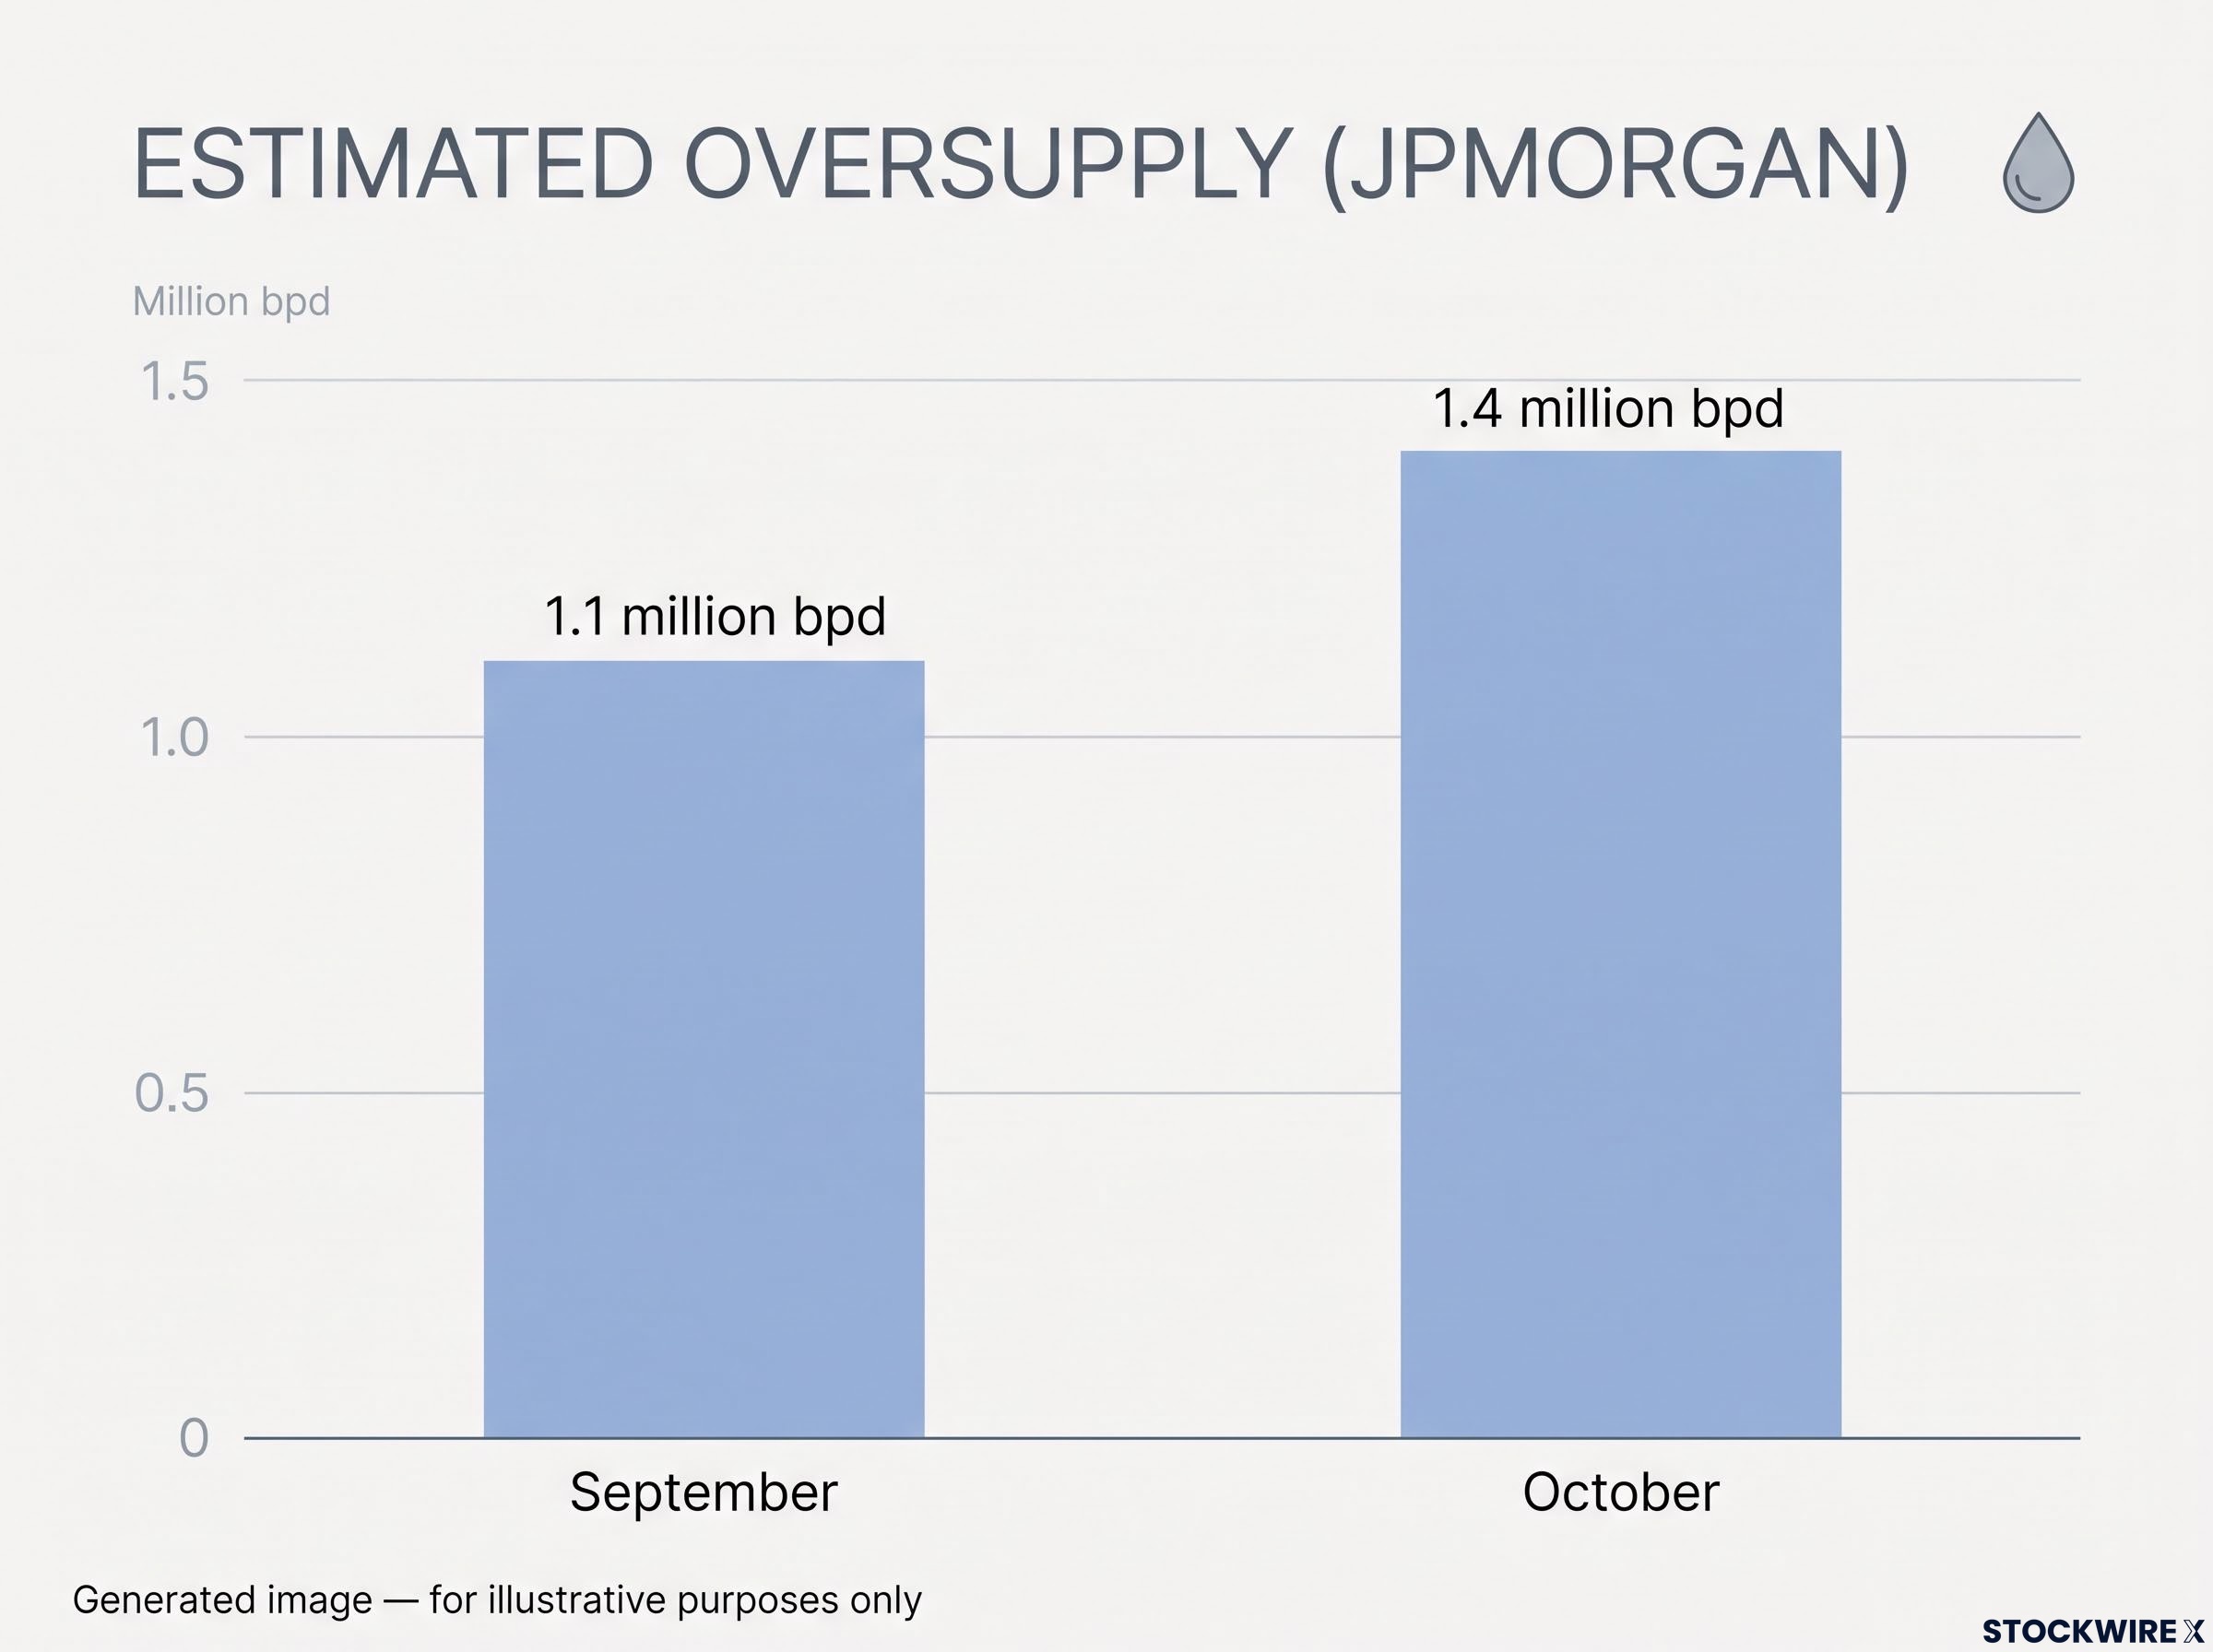
JPMorgan estimates that the gap between oil supply and consumption grew from 1.1 million bpd in September to 1.4 million bpd in October.
Against that sits a thinner counterweight. Commercial inventories were heavily drawn during the conflict, and prompt shipping capacity is scarce. Rystad Energy’s Janiv Shah described a market loosening towards oversupply but still carrying a physical quality and logistics differential.
That is the tug of war. Read the rebound as near-term physical risk pushing against a bearish forward balance, not as a trend reversal.
Rabobank has framed the slide below US$100 as false relief, arguing the drop reflects a smaller risk premium after US-Iran contacts rather than any gain in actual supply, which leaves Gulf exposure largely untouched.
What to watch
- UKMTO and JMIC advisories: named vessels and mine evidence would strengthen the floor; continued vagueness weakens it.
- AIS vessel traffic: rising tanker counts are bearish; stalling or reversing traffic is bullish.
- Qatar and UAE loadings: further recovery eases pressure; a relapse tightens it.
- Mine clearance and escorts: progress shortens the premium’s life.
- Freight and insurance: freight near US$30 a barrel signals the physical squeeze persists.
- OPEC+ decisions: sustained higher output offsets the geopolitical premium.
- Inventory reports: rising stocks reinforce oversupply; draws make Hormuz headlines bite harder.
- Diplomacy: a durable deal lowers the premium; failed talks or new attacks support prompt Brent.
Shifts here can also flow through to inflation expectations and wider risk appetite, though the research does not quantify those cross-asset effects.
What the rebound does and does not settle
Hormuz risk has slowed Brent’s slide. It has not overturned the market’s expectation of more supply and weaker demand, and the latest Reuters data show the bounce already giving ground.
Two habits will serve you well from here. Read every price with its source and timestamp, and treat incident claims with scepticism until UKMTO or JMIC confirm them.
If you check only two indicators, start with freight and insurance rates, then inventory reports. The first tells you whether the physical squeeze is easing. The second tells you whether the oversupply story is gaining ground. Together, they will show you which side of the tug of war is winning.
For readers wanting to see how a permanent premium could be built into prices, our detailed coverage of Iran’s proposed toll explains how a 7% cargo-value levy would add roughly US$5-6 per barrel.
This article is for informational purposes only and should not be considered financial advice. Investors should conduct their own research and consult with financial professionals before making investment decisions.